Alarm Escalation Rule:
Let us consider a server X which is running a crucial application to the business. When the CPU utilization of server X exceeds 60%, a critical alarm is raised to report the status of the server.
If the alarm is unattended
So the following alarm escalation rules are configured for the server X running the business application.
Corrective actions will be taken by the Product Head to troubleshoot the issue.
Workflow is a framework offered by OpManager through which tasks can be automated, ensuring ease of network management. Workflow is based on if...else condition. It executes tasks based on conditions, variables and actions defined by the user.
For example, let us consider Server A which runs a crucial business application. When the CPU Utilization of Server A exceeds 60%, a critical alarm is generated. Stopping the MSSQL processes on Server A will reduce its CPU Utilization.
So a workflow can be created based on the same condition. if the CPU Utilization of Server A exceeds 60%, an alarm is triggered and STOP MSSQL PROCESSES - action is executed automatically, ensuring uptime of Server A.
The device templates in OpManager contain predefined rules based on which a device is categorized and relevant monitors are associated soon after discovery. The ability to define custom templates for new device types or modify an existing template to accommodate yet another device type in the same template provides great flexibility to administrators.
That said, as an administrator, you will be able to make the best out of this feature if used to its full potential. For instance, some might end up defining a template for every variant of a device type instead of creating one template that can encompass all the variants.
Ideally, defining device templates before you initiate discovery helps in proper classification. Over 650 device templates are available out of the box. If SNMP is enabled on the monitored devices, and if proper credentials are configured in OpManager, most devices fall into the correct category. Modify an existing template or create a new one based on need.
1. When should I modify/update an existing template?
Assume you have purchased a new Cisco 805 router and you would like to monitor it using OpManager. OpManager already has a device template for Cisco 800 series routers with few sysOIDs in these series updated in the template. All you need to do is edit this template to include the sysOID of Cisco 805 router if it is not present already.

2. When should I create new templates?
Scenario 1
Let us now assume you have purchased a Cisco 11000 Series Content Services Switch. OpManager does not have a template yet (this is as of Build no.8721!). Just go ahead and create a new template.
Scenario 2
Assume you have a whole new set of Environment Sensors that are manageable (that supports SNMP). These devices cannot be classified under any of the default categories like servers, routers, switches etc, and deserve a separate category. The managing parameters too differ for this new device type. An ideal situation where you will define a new category view (Eg: Sensors) and define a fresh device template. You can have different models of sensors from the same vendor in a template or even combine Sensors from multiple vendors in the same template.
The steps you'd follow here would be as follows:
3. How to check for SNMP response to sysOID
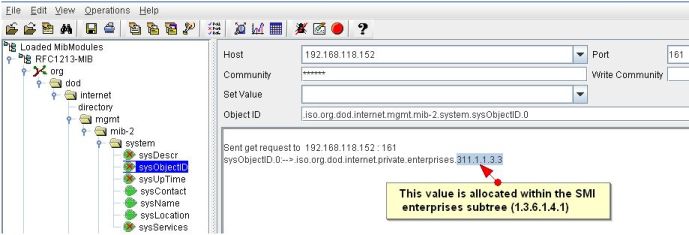
Even before you proceed to add or modify a template to accomodate a new device type, make sure the device is SNMP enabled and it responds to query from OpManager. Invoke the MibBrowser utility bundled with OpManager to check for response. Let me show you how to check for SNMP response.
1. From OpManager/bin, double-click to execute MibBrowser.bat.
2. In the MibBrowser GUI, enter the device name, the SNMP port, and the read community string (default is PUBLIC).
3. RFC1213 mib is loaded by default. Expand the mib to org->dod->internet->mgmt->mib2 ->system and select sysObjectID from this table.
4. From the toolbar above, click on the Get SNMP Variable icon (7th icon from the left) to see the response in the text area to your right.
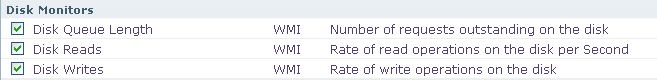
Monitoring basic CPU, Memory and Disk utilization gives a fair indication of where the problem could be, but you need to monitor more than just the resource utilization to actually determine the reason for application slowness. Multiple system resource parameters or even a single parameter can impact the performance of an application. Let's look at "Disk I/O" - one of key parameters that causes application performance related problems.
Why monitor Disk I/O
The hard disk is one of the slowest components on a server. The hard disk drive bandwidth is around 300 times slower than that of the memory and added to that, memory latency is very low - if you do the math, memory performs around 2000 times faster than that of the hard disk drive. Check out http://nathanaeljones.com/153/performance-killer-disk-io/ for a neat explanation.
So monitoring and keeping the Disk I/O at healthy levels can prevent a lot of application performance hiccups.
Does my server have Disk I/O problems?
Depending on your server, there are different ways of finding Disk I/O. Refer to http://www.performancewiki.com/diskio-tuning.html for the Disk I/O commands on various servers.
Another simple way, and what we recommend ;), is to use OpManager. OpManager monitors Disk I/O out-of-the-box for Windows servers (see screenshot below) and with a few customizations also for Unix-based devices.
This problem could due to the following reasons:
1)WMI is not configured properly in OpManager (OpManager uses WMI credential to monitor AD servers).
2)Required Monitors are not associated to the device in OpManager.
3)WMI might not be responding to the OpManager WMI request
4)WMI is not working properly on the device itself.
1)WMI is not configured properly in OpManager (OpManager uses WMI credential to monitor AD servers).
Configure WMI for multiple devices at a time:
1.Go to Admin --> Credential Settings
2.Click New
3.Configure the following parameters and click Add to add the credentials:
Credential Type: Windows
Name: Configure a name for the credential and also provide the description.
Configure the Domain NameU ID and the password (Example:- TestDomainTestUser Testpassword) > Click on "Add".
Associate the above credential using Quick Configuration Wizard to multiple devices:
1. From the Admin tab, select Quick Configuration Wizard.
2. Select the option Associate a credential to several devices and click Next.
3. All the available Credentials are listed. Select the Credential (the one you created above ).
4. Select the devices to which you want to assign the credential from the left column and move them to the right.
5. Click Finish. The Credential is associated to the selected devices.
Configuring WMI credential using device snap shot page(Single device):
Go to device snap shot page > Click on "Click here to change" option besides Passwords >select "Use the below credential for the device" option >Type in the username (Ex:domainnameuame) and Password > Click on Test credential (make sure its gets passed) and then Ok to save it.
In case OpManager itself is hosted on the AD server, then leave the username and password blank and click OK, as local host does not require the credentials.
2)Required Monitors are not associated to the device in OpManager.
Solution: Adding monitors for AD Monitors:-
Make sure the Category is selected as Domain controller to have the AD monitors associated automatically to the device.
In case if the monitors are absent go to ![]() Active Directory Monitors section of the device snapshot page and add the required AD monitors (Network Monitors ,Database Monitors NTFRS Process Monitors , System Monitors, Performance Counters Monitors and LSASS Process Monitors ).
Active Directory Monitors section of the device snapshot page and add the required AD monitors (Network Monitors ,Database Monitors NTFRS Process Monitors , System Monitors, Performance Counters Monitors and LSASS Process Monitors ).
3)WMI might not be responding to the OpManager WMI request
Solution:Use the wmiadap utility to update the WMI performance classes from the performance libraries. Running wmiadap updates all the performance classes. The /f switch in the below command forces an update of the WMI classes from the performance libraries.
Step 1:
1. Go to the monitored device.
2. Click Start-->Run,
For Windows 2000 winmgmt /resyncperf' command.
For Windows XP and 2003 'wmiadap /f' command.
3. After running this command about 4 times, wait for an hour and check whether AD monitors shows data.
Step: 2
1. Go to the monitored device.
2. Click Start-->Run-->services.msc
3. Restart WMI service
4)WMI is not working properly on the monitored device.
Solution: Still if you do not see the counter values, verify whether OpManager server is able to pull up AD counters information by executing the following queries.If you are able to pull the information for the following queries OpManager should be able to show the information in the dashboard.
If some of the below query gets the output and some of them not then the respective counters information associated with the non working classes will not be shown on the dash board.
1. From OpManager command prompt go to <OpManagerconfapplicationscripts>
2. Execute the following commands and make sure we get the output from the device.
cscript wmiget.vbs devicename domainnameuame password "ROOTCIMV2" "SELECT * from Win32_PerfRawData_PerfNet_Server"
cscript wmiget.vbs devicename domainnameuame password "ROOTCIMV2" "SELECT * from Win32_Processor"
cscript wmiget.vbs devicename domainnameuame password "ROOTCIMV2" "SELECT * from Win32_PerfRawData_PerfOS_System"
cscript wmiget.vbs devicename domainnameuame password "ROOTCIMV2" "SELECT * from Win32_PerfRawData_PerfOS_Memory"
cscript wmiget.vbs devicename domainnameuame password "ROOTCIMV2" "SELECT * from Win32_PerfRawData_NTDS_NTDS"
cscript wmiget.vbs devicename domainnameuame password "ROOTCIMV2" "SELECT * from Win32_PerfRawData_PerfProc_Process"
cscript wmiget.vbs devicename domainnameuame password "ROOTCIMV2" "SELECT * from Win32_OperatingSystem"
cscript wmiget.vbs devicename domainnameuame password "ROOTCIMV2" "SELECT * from Win32_LogicalDisk"
cscript wmiget.vbs devicename domainnameuame password "ROOTCIMV2" "SELECT * from Win32_PerfRawData_PerfOS_Processor"
If you are getting "Invalid class" error message for the above queries then either the corresponding wmi classes are absent or corrupted on the AD server.
Please refer the link below to re-register or rebuild the WMI classes.
http://windowsxp.mvps.org/repairwmi.htm
The OpManager iOS mobile application uses Apple Push Notification service (APNs) to receive remote notifications. The APNs acts as a portal between OpManager and your iOS device. If there are issues in receiving notifications on your iOS devices, kindly contact support with your build details.
Alternatively, upgrade to the latest version, in which these issues have been effectively fixed.
This problem could due to the following reasons:
1)WMI is not configured properly in OpManager (OpManager uses WMI credential to monitor MSSQL servers).
2)Required Monitors are not associated to the device in OpManager.
3)WMI might not be responding to the OpManager WMI request
4)WMI is not working properly on the device itself.
1)WMI is not configured properly in OpManager (OpManager uses WMI credential to monitor MSSQL servers).
Solution: Configuring WMI for multiple devices at a time :
1.Go to Admin --> Credential Settings
2.Click New
3.Configure the following parameters and click Add to add the credentials:
Associate the above credential using Quick Configuration Wizard to multiple devices:-
1. From the Admin tab, select Quick Configuration Wizard.
2. Select the option Associate a credential to several devices and click Next.
3. All the available Credentials are listed. Select the Credential (the one you created above ).
4. Select the devices to which you want to assign the credential from the left column and move them to the right.
5. Click Finish. The Credential is associated to the selected devices.
Configuring WMI credential using device snap shot page(Single device):
Go to device snap shot page > Click on "Click here to change" option besides Passwords >select "Use the below credential for the device" option >Type in the username (Ex:domainnameuame) and Password > Click on Test credential (make sure its gets passed) and then Ok to save it.
In case OpManager itself is going to be MSSQL server then leave the username and password blank and click OK as we do not require credential for the local host.
2)Required Monitors are not associated to the device in OpManager.
Solution: Adding monitors for MSSQL Monitors:-
Here are the steps to associate the MSSQL monitors to a device:
1.Go to the snapshot page of a device.
2.Scroll down and select the Monitors tab.
3.Click on Performance Monitors. The monitors are listed on the right.
4.Click the Add Monitor button on the right. A list of monitors is displayed.
5.Click the MSSQL Monitors button on top of this list. The monitors of all the MSSQL parameters are displayed.
6.From this list, select the required MSSQL Monitors and click on Add > List of MSSQL databases will be listed for which you want to associate Monitors
7.Check mark all the required databases and click on OK , Now you will get a dash board for MSSQL and data will be populated after some time.
3) WMI might not be responding to the OpManager WMI request
Solution:Use the wmiadap utility to update the WMI performance classes from the performance libraries. Running wmiadap updates all the performance classes. The /f switch in the below command forces an update of the WMI classes from the performance libraries.
Step 1:
1. Go to the monitored device.
2. Click Start-->Run,
For Windows 2000 winmgmt /resyncperf' command.
For Windows XP and 2003 'wmiadap /f' command.
3. After running this command about 4 times, wait for an hour and check whether MSSQL monitors shows data.
Step: 2
1. Go to the monitored device.
2. Click Start-->Run-->services.msc
3. Restart WMI service
4)WMI in the device is not working properly.
Solution: Still if you do not see the counter values, verify whether OpManager server is able to pull up MSSQL counters information by executing the following queries.If you are able to pull the information for the following queries OpManager should be able to show the information in the dashboard.
If some of the below query gets the output and some of them not then the respective counters information associated with the non working classes will not be shown on the dash board.
1. From OpManager command prompt go to <OpManagerconfapplicationscripts>
2. Execute the following commands and make sure we get the output from the device.
cscript wmiget.vbs <Devicename or IP> <DomainnameUame> <Password> ROOTCIMV2 "select * from Win32_PerfRawData_MSSQLSERVER_SQLServerBufferManager "
Example:OpManagerconfapplicationscripts>cscript wmiget.vbs MSSQLSERVER1 TestUame Password ROOTCIMV2 "select * from Win32_PerfRawData_MSSQLSERVER_SQLServerBufferManager "
cscript wmiget.vbs <Devicename or IP> <DomainnameUame> <Password> ROOTCIMV2 "select * from Win32_PerfRawData_MSSQLSERVER_SQLServerCacheManager "
cscript wmiget.vbs <Devicename or IP> <DomainnameUame> <Password> ROOTCIMV2 "select * from Win32_PerfRawData_MSSQLSERVER_SQLServerPlanCache "
cscript wmiget.vbs <Devicename or IP> <DomainnameUame> <Password> ROOTCIMV2 "select * from Win32_PerfRawData_MSSQLSERVER_SQLServerDatabases"
cscript wmiget.vbs <Devicename or IP> <DomainnameUame> <Password> ROOTCIMV2 "select * from Win32_PerfRawData_MSSQLSERVER_SQLServerGeneralStatistics "
cscript wmiget.vbs <Devicename or IP> <DomainnameUame> <Password> ROOTCIMV2 "select * from Win32_PerfRawData_MSSQLSERVER_SQLServerReplicationAgents "
cscript wmiget.vbs <Devicename or IP> <DomainnameUame> <Password> ROOTCIMV2 "select * from Win32_PerfRawData_MSSQLSERVER_SQLServerLocks"
cscript wmiget.vbs <Devicename or IP> <DomainnameUame> <Password> ROOTCIMV2 "select * from Win32_PerfRawData_MSSQLSERVER_SQLServerMemoryManager"
cscript wmiget.vbs <Devicename or IP> <DomainnameUame> <Password> ROOTCIMV2 "Select * from Win32_PerfRawData_MSSQLSERVER_SQLServerGeneralStatistics"
If you are getting "Invalid class" error message for the above queries then either the corresponding wmi classes are absent or corrupted on the MSSQL server.
Please refer the link below to reregister or rebuild the WMI classes.
http://windowsxp.mvps.org/repairwmi.htm
Problem 1
While applying a service pack (.ppm file) upgrade in a Windows system (For versions 12.7.000 and above) with PostgreSQL as the backend, the following error message is shown:

Identifying the problem:
Command to identify whether dll missing problem exist:
where /r %SystemRoot%\System32 api-ms-win-crt-stdio-l1-1-0.dll api-ms-win-crt-string-l1-1-0.dll api-ms-win-crt-runtime-l1-1-0.dll
where /r %SystemRoot%\SysWOW64 api-ms-win-crt-stdio-l1-1-0.dll api-ms-win-crt-string-l1-1-0.dll api-ms-win-crt-runtime-l1-1-0.dll
Output if dll is missing:
C:\Program Files\ManageEngine\OpManager->where /r C:\Windows\System32 api-ms-win-crt-stdio-l1-1-0.dll api-ms-win-crt-string-l1-1-0.dll api-ms-win-crt-runtime-l1-1-0.dll
INFO: Could not find files for the given pattern(s).
C:\Program Files\ManageEngine\OpManager->where /r C:\Windows\SysWOW64 api-ms-win-crt-stdio-l1-1-0.dll api-ms-win-crt-string-l1-1-0.dll api-ms-win-crt-runtime-l1-1-0.dll
INFO: Could not find files for the given pattern(s).
Output if dll exists:
C:\Program Files\ManageEngine\OpManager->where /r C:\Windows\System32 api-ms-win-crt-stdio-l1-1-0.dll api-ms-win-crt-string-l1-1-0.dll api-ms-win-crt-runtime-l1-1-0.dll
C:\Windows\System32\downlevel\api-ms-win-crt-runtime-l1-1-0.dll
C:\Windows\System32\downlevel\api-ms-win-crt-stdio-l1-1-0.dll
C:\Windows\System32\downlevel\api-ms-win-crt-string-l1-1-0.dll
C:\Program Files\ManageEngine\OpManager->where /r C:\Windows\SysWOW64 api-ms-win-crt-stdio-l1-1-0.dll api-ms-win-crt-string-l1-1-0.dll api-ms-win-crt-runtime-l1-1-0.dll
C:\Windows\SysWOW64\downlevel\api-ms-win-crt-runtime-l1-1-0.dll
C:\Windows\SysWOW64\downlevel\api-ms-win-crt-stdio-l1-1-0.dll
C:\Windows\SysWOW64\downlevel\api-ms-win-crt-string-l1-1-0.dll
Solution:
For the above error traces, check the below files present under
If the above dll files are missing in the above mentioned file path, the Universal C Runtime in Windows should be updated.
For more information refer the links given below:
In Windows 2003 Server, SNMP service is available which supports onlySNMP version v1 and v2c. If you want to add SNMPv3 support, you need toinstall snmpv3 supported agent. Download the Net-Snmp Agent tosupport the same.
Please follow the below steps to install snmpv3 agent.
1. First Download the Active Perl from the below link
http://downloads.activestate.com/ActivePerl/Windows/5.10/ActivePerl-5.10.0.1002-MSWin32-x86-283697.msi
2. Install the Active perl first. Also you need to install the OpenSSL.
3. Download the exe of NetSnmp Agent from the below link
http://sourceforge.net/project/showfiles.php?group_id=12694&package_id=162885
4. Install the Net-Snmp Agent.
5.After installing the netsnmp agent. Herewith I have attached the conffile, Please rename the snmp.conf.txt as snmp.conf and snmpd.conf.txtas snmpd.conf. Copy the the snmpd.conf and snmp.conf under thedirectory c:utcsnmp
6. Then register the agent by executing registeragent.bat file and run the below command in command line to start the agent.
net start "net-snmp agent"
7. Now the agent is started at port 8001.
Releated Links:
http://www.netadmintools.com/art487.html
To enable SNMP on ESX Server version 3.5:
1. Login as root
2. Edit the snmpd.conf file and add "rocommunity xxxx" where xxxx is your read-only community string). The file is uusually located in /etc/snmpd.
3. While you're editing the snmpd.conf file, also add "dlmod SNMPESX /usr/lib/vmware/snmp/libSNMPESX.so"
4. Restart the SNMP daemon - /etc/init.d/snmpd restart
In some cases, you may also need to edit the firewall settings on the ESX server to allow the SNMP traffic through. To do this:
Login as root and issue the following commands:
2. esxcfg-firewall -e snmpd
3. chkconfig snmpd on
4. service snmpd start
For more information, visit the VM Ware page on how to configure SNMP on the ESX Server.
You can run OpManager as a Unix Service.
Follow the steps mentioned below to install OpManager as a service on a linux box.
1. Copy the content given in blue below to a text file and save it to /etc/init.d directory as opmanager.
#!/bin/bash
#
# Startup script for the pmagent
#
# chkconfig: 345 99 02
# description: Run the OpManager 5 program
INITLOG_ARGS=""
prog="opmanager"
progname="AdventNet ManageEngine OpManager"
RETVAL=0
# Edit the following to indicate the 'bin' directory for your installation
MDIR=/usr/local/OpManager/bin
PRG=$MDIR/opmanager
if [ ! -d "$MDIR" ]
then
echo "Invalid directory $MDIR"
exit 1
fi
start()
{
mv -f /var/log/opmanager.log /var/log/opmanager1.log
echo "Starting $progname"
cd $MDIR
nohup sh StartOpManagerServer.sh >/var/log/opmanager.log 2>&1 &
RETVAL=$?
echo
[ $RETVAL = 0 ] && touch /var/lock/subsys/OpManager
}
stop()
{
echo "Stopping $progname"
cd $MDIR
sh ShutDownOpManager.sh admin admin >>/var/log/opmanager.log 2>&1
}
case "$1" in
start)
start
;;
stop)
stop
;;
*)
echo "Usage: $prog {start|stop}"
exit 1
;;
esac
exit $RETVAL
mv /etc/init.d/opmanager.txt /etc/init.d/opmanager
2. Edit the MDIR variable in this file which should point to the bin folder of OpManager Installation directory. Typically, the default installation folder on a Linux box will be /root/ManageEngine/OpManager/bin. Hence the value for MDIR will be
MDIR=/opt/ManageEngine/OpManager/bin
3. Provide executable permissions for this script using
chmod 755 /etc/init.d/opmanager
4. Use chkconfig command to add opmanager as a service
chkconfig --add opmanager
You can start OpManager in the nohup mode so you don't have to worry about the service being terminated when the console is closed. The service will continue to run in the background. Make these changes in the start and stop script files of OpManager:
in start
nohup /opt/ManageEngine/OpManager/bin/StartOpManagerServer.sh
in stop
nohup /opt/ManageEngine/OpManager/bin/ShutDownOpManager.sh
You might encounter errors such as 'command not found'. Its possible that few relevant library files are not available on the system on which you are trying to install OpManager. Install the packages and proceed with OpManager installation. For instance, if you encounter such an issue in Ubuntu, here is what you need to do:
$ apt-get install libnewt0.51
$ ln -s /usr/lib/libnewt.so.0.51 /usr/lib/libnewt.so.0.50
$ wget http://www.tuxx-home.at/projects/chkconfig-for-debian/chkconfig_1.2.24d-1_i386.deb
$ dpkg --force-all -i chkconfig_1.2.24d-1_i386.deb
Source : http://ubuntuforums.org/archive/index.php/t-20583.html
1. In the Client window, click Register link on the menu bar.
2. Browse and select the Registered License file (AdventNetLicense.xml) provided to you and click Register.
3. Verify the licensing details displayed in the page and click Close.
If you are applying the Registered License after expiry of the evaluation license then do the following:
1.Start the server. You will see the message "Trial Period has Expired".
2. Click OK to enter the License details.
3. Browse and select the Registered License file (AdventNetLicense.xml) provided to you and repeat the steps mentioned above.
You need to procure the extended trial license from Manageengine. This is provided purely on discretion. Send an email request to sales@manageengine.com
It is an abbreviation for Package for Patch Manager and has nothing to do with Perl. The File with .ppm extension is known to work with the Update Manager tool which is bundled with AdventNet Products. This tool helps to upgrade to the newer version keeping the data intact. In OpManager,you can access this tool using Start -> Programs ->ManageEngine OpManager -> Update Manager. Alternatively, you canalso invoke the tool from /opmanager/bin/UpdateManager.bat/sh.
The OpManager WAN RTT Monitor monitors the latency between two locations usingCisco's IP-SLA, therefore either of the locations should have the Cisco router enabled with IPSLA agent which will act as a source and the target can be any IP in the other location(Need not be a cisco router).
OpManager can create a database and its tables only if the MSSQL account has DBOwner privilege. It connects to MSSQL server using SQL username and password. So have to enable SQL authentication.
For default MSSQL instance,port number will be 1433.
http://msdn.microsoft.com/en-us/library/ms177440.aspx
http://support.microsoft.com/kb/823938
For named instance, DB host should be entered as hostnameinstancename
To view the detailed traffic report from Netflow Analyzer, the prerequisites are,
If the device has been added successfully, but not displayed under the Virtual Devices map, search for that device. Go to its snapshot page and look for the device type. If it is mentioned as ‘unknown’, wrong credentials might have been provided or it is not reachable during discovery. Provide the correct credentials and click on ‘Rediscover Now’ under Actions tab in the snapshot page, to discover it as an ESX host.
OpManager, with the help of installed VMware Tools, identifies the IP address of the VM and maps it to the host. In case the VMware Tools are not installed, OpManager discovers it using VM's entity name. You can assign the IP address for such VMs in the host snapshot page (screenshot of the same is given below). Click on the 'No IP Address' link corresponding to the VM to assign the IP address for that VM. Similarly, you can click the assigned IP address to choose another one as the primary IP for that particular VM.
CIDR, short for Classless Inter-Domain Routing, is a replacement for the older Classful network addressing architecture that was in use since 1981. CIDR was introduced in 1993 to address the issue of IP address shortage.
The CIDR method divides the address space for Internet Protocol Version 4 (IPv4) into five address classes. Each class, coded in the first four bits of the address, defines either a different network size, i.e. number of hosts for unicast addresses (classes A, B, C), or a multicast network (class D). The fifth class (E) address range is reserved for future or experimental purposes. Now, IPv6 is fast replacing IPv4 allowing huge expansion for more users and devices on the internet.
A seed device is the core switch in your network. The switch must have SNMP-enabled so that OpManager is able to query the device and draw the links automatically, showing the connectivity of all the devices on your network. As changes happen to the networks frequently, OpManager allows you to configure an interval (in days) to re-draw the map. For instance, if a change happens once in a week, you can configure OpManager to re-draw the map every seven days.
After layer 2 discovery and mapping, whenever a link on the map is clicked, the error "Interface associated with this link does not exist in OpManager", pops up.
The interface link connected between the two network devices may not be added in OpManager. Hence the pop up message. for instance, lets say Router1 is connected to Router2 through interface Ethernet0/0 of Router1. In case the Ethernet0/0 interface is not added in Router1, you will encounter the above error. Once you add the interface in Router1 by rediscovering the interfaces and try to draw the map, you will get the interface traffic details in the pop up message.
This error is encountered when configuring a seed file for Layer2 mapping.
In order to get the networks map, the switches should support SNMP protocol. The mibs that are used to find the connectivity between network devices are given below,
i) BRIDGE-MIB
ii) RFC-1213-MIB
iii) CISCO-CDP-MIB.
Most other vendors switches support Bridge MIB. So for non-Cisco-devices, we can get the connectivity details from this mib. If you still encounter the error, it is due to OpManager using RFC1213 and ipRouteTable to create the maps. This RFC has been deprecated and has been replaced by RFC2096 and ipCidrRouteTable. This can be replicated with Mib Browser. Try to see if your device is compliant with RFC1213 or RFC2096. There should soon be a patch from the team to ensure that all devices are mapped correctly.
Here are the steps to configure SNMPv3 on arouter. Lets configure a privileged User called Henry with the relevant details below.
Configure the user in router using the following commands,
1. First telent the router .
2. Check whether the engineID is already configured or not using the below commands
show snmp engineID
If it shows engineID details so there is no need to issue the belowcommands. If the above command gives empty result, issue the belowcommand.
snmp-server engineID local 8000063000100a1ac151003
3. Create the view for read / write / notify.
snmp-server view readview internet included
snmp-server view writeview internet included
snmp-server view notifyview internet included
4. Create the user
snmp-server user Henry privGroup v3 auth md5 authUser priv des56 privUser
5. Map the user with group.
snmp-server group privGroup v3 priv read readview write writeview notify notifyview
Thats all.. Snmp V3 is correctly configured in that Router.
Now to check whether its done properly do a snmpwalk using the following command
snmpwalk -d -v 3 -a MD5 -A authUser -l authPriv -u Henry -x DES -X privUser <TargestHostName>:<TargetPort> system
Ex: snmpwalk -d -v 3 -a MD5 -A authUser -l authPriv -u Henry -x DES -X privUser proto-test3:161 system
If you can see some reply in the command line it really works Smile
For Detailed information on SNMP v3 configuration on Routers please check the below link
http://www.cisco.com/en/US/docs/ios/12_0t/12_0t3/feature/guide/Snmp3.html
Now add a new Credential in OpManager under Admin --> CredentialSettings with those relevant details and add a new device to OpManagerand then check whether it helps. Do let me know how it works.
Some users experience the issue of 'missing interfaces' when viewed in the Infrastructure view. Understanding how discovery of interfaces happens in OpManager will make the reasons easier to understand.
OpManager queries the ifTable and ipAddrTable of RFC1213-MIB with configured SNMP parameters for that device in OpManager. For the ifIndexes(OID: .1.3.6.1.2.1.2.2.1.1) present in ifTable , if there is an ipAdEntAddr(OID: .1.3.6.1.2.1.4.20.1.1) in ipAddrTable then that will be added as an interface in SnmpInterface table along with its properties like speed, index, description, phyMedia, phyAddress and parent-device. If the address is pingable then the interface will be a managed one otherwise added as unmanaged interface. If the ifType is loopback or the ipAdEntAddr is 127.0.0.1 that interface will not be added. In OpManager the number of indexes present in ifTable are taken . If the interfaces don't have an IpAddress, then OpManager adds them in the format IF-<primary ip address of Router>-index along with its properties.If the device has more than two interfaces and ipForwarding(OID: .1.3.6.1.2.1.4.1) is enabled then that will be categorized as Router.
However,for devices other than Router, the unnumbered interfaces,the interfaces that have an ifIndexe but does not have an ipAddrEntAddr in ipAddrTable, will not be added.
If the Router is misconfigured, like two addresses hold same index in ipAddrTable then last one will be added while first one will not be added and so will be missing from the Router view.This limitation is because for us index is a key so no duplication is entertained in that.
To resolve this issue, check if is there anything wrong with the routers IOS if duplication of indexes is there and fix those issues. Following this, delete and re-add the device.
| Admin | Operational | Status | Colour coding |
|---|---|---|---|
| Down | Up/Down | Critical | Red |
| Up | Up | Clear | Green |
| Up | Down | Trouble | Orange |
| Up | Dormant(Ready to receive/ transmit packets) | Clear | Green |
| Up | Not Present /Unknown/testing | Attention | Yellow |
If the Admin and Operational status are UP, and also the threshold is violated for any of the monitor in the interface, the port will be moved to the trouble state (Orange color).
If the SNMP Agent responds to the Temparture OID from the Cisco-ENVMON MIB, then you can monitor the Cisco Router Temperature in OpManager
First,we need to make sure that the route to be monitored is in the Routing table of the router.To check this,please run the show IP route in the privileged mode.
For example :
cisco2811#show ip route
Gateway of last resort is 192.168.118.2 to network 0.0.0.0
C 192.168.118.0/24 is directly connected, FastEthernet0/0
S* 0.0.0.0/0 [1/0] via 192.168.118.2
As seen above,the route for network address 192.168.118.0 exists in the routing table (in this case it is directly connected)
If the next-hop address for the network address 192.168.118.0 is known we can monitor this route.
In Default RFC-1213MIB,we have the OID IPRouteNextHop (.1.3.6.1.2.1.4.21.1.7) this will provide the entire routing table information.
ipRouteNextHop.0.0.0.0:-->192.168.118.2
ipRouteNextHop.192.168.118.0:-->192.168.118.23
As seen in the above output,the next-hop address is 192.168.118.23 which is the expected behavior.
In order to monitor this specific route of 192.168.118.0,we can append the network address with the above mentioned OID i.e. 1.3.6.1.2.1.4.21.1.7. 192.168.118.0
So,for this OID (.1.3.6.1.2.1.4.21.1.7. 192.168.118.0) the Output in MIB will be the IP of the next hop.
Once you find the OID of the Specified Route, you can easily monitor the Route by adding custom SNMP monitor.
Add the IP address as a string OID by unchecking the Numeric box.
If the next hop does not contain this IP address(192.168.118.0) it can be set as the threshold value and you will get the alarm. If it contains this IP address (192.168.118.0) it can be set as the rearm value where there is no alarm or alarm is cleared.
Now associate the monitor to the device.
| S.No | SNMP Monitors | Traps |
|---|---|---|
| 1 | Pull Model: OpManager sends SNMP request to the SNMP agent running on the monitored device and receives the response. | Push Model: Monitored device(SNMP agent) sends messages in the form of traps to the trap destination(OpManager) |
| 2 | Communication: both ways(UDP 161) | One way. Only from device to trap destination (UDP 162) |
| 3 | SNMP requests can be scheduled using monitoring intervals. | Traps are spontaneous. They will reach the destination as soon as they are generated. |
| 4 | Custom SNMP monitors can be created for the non default metrics. These monitors convert the raw SNMP response into a meaningful metric with unit. | Custom SNMP Trap processors are can be created for the new trap messages. They process the trap messages and convert them into meaningful alarms. If there is no trap processor, traps will be dumped under Alarms-->Unsolicited traps. |
| 5 | SNMP community string is mandatory to get a SNMP response | Community string is not mandatory to receive the trap message. |
Switch Port Mapper does not display the MAC Address and the IP Address fully.
The Router input may not be specified or the ARP cache may not be updated.
1. The Router input is not specified. Enter the Router name to map the MAC Addresses to IP Addresses. The Router should be in the same subnet as that of the devices connected to the switch.
2. If the router input is not given, the information is obtained from the ARP cache of the switch. A cache file is also maintained locally to store this information. Perform a ping scan of the subnet to update the cache and then perform Switch Port mapping. This will improve the MAC to IP resolution.
If the above things are correct, please do the steps below
1. Open the MIB Browser from <OpManager>\\Bin Folder
2. Host Name ( Switch Name )
3. provide the community String of this device
4. Click on Load MIB and load the BRIDGE.MIB
5.Now try to query these values BRIDGE.MIB -->> mib2-->>.iso -->> org -->> dod -->> internet-->> mgmt-->> mib-2 -->> dot1dBridge -->>dot1dTp -->>dot1dTpFdbTable -->> dot1dTpFdbEntry -->>dot1dTpFdbAddress
Try to query these values. If you get repliesalong with the MAC Address thenthe values will be displayed in the SWITCH PORT MAPPER.
Traps are cryptic messages of a fault that occurs in an SNMP device. SNMP traps are alerts generated by agents on a managed device. These traps generate 5 types of data:
Authentication failure alarms are raised due to some monitoring system trying to access the device with wrong community strings. It may be opmanager or some other monitoring system installed in your network sending snmp queries with wrong community strings.
Configure the correct community strings. In Opmanager it is under Configure--> Passwords. Also check other installations of opmanager or third party monitoring applications for wrong community strings.
If you need to know a clear picture on this issue, like which device sends the wrong SNMP community string. Install a packet sniffer software(www.ethereal.com) on the device which sends the authentication traps and capture packets. By analyzing the capture packets, you can find the device which sends the SNMP query with wrong community string. Send us the captured packets for analysis along with IP address of OpManager server and from device which youre getting authentication traps.
Rearm value is the value which the determines the monitor has restored to normal condition. For instance, the threshold condition for a memory monitor is selected as greater than [>] and the threshold value is configured as 75. The monitored memory value of that device is 80. Now alert is raised and the monitor is in violated condition. At the next poll the monitored value is 72. An alert for returning to normal condition is generated. At the next poll again the monitored value goes to 80. Again a threshold violation alert is generated. In order to avoid this, enter the rearm value. Only if the monitored value reaches the rearm value the monitor goes to the normal condition and a normal alert is raised. Note: If you select threshold condition greater, then the rearm value should be lesser than the threshold value and vice versa.
Check below for the possible reasons for not receiving the traps and its corresponding resolution.
1. Trap port might be occupied in opmanager server. ---> Make sure the that trap port of OpManager is not occupied by trap service of Operating System (ie) port 162 should be free. If not free it and restart opmanager.
2. Device might not be monitored in OpManager. --> Device should be added in OpManager to receive the traps from that device.
3. Trap destination might be wrong --> OpManager server should be the trap destination for the device which sends traps.
If the issue persists, follow the steps below to check whether the trap is received properly on the OpManager server.
1. Stop OpManager. Make sure the port 162 is not occupied.
2. Open the file MibBrowser.bat located under \OpManager\bin folder.
3. Go to View --> Trap Viewer and check whether the traps are received properly.
4. If the traps are not received in the trap receiver, the traps are not reaching the OpManager server and you can sort that problem which will make OpManager receive the traps.
5. If you are receiving the traps on the trap processors and not on OpManager, contact Support.
Edit the file "trapport.conf" under /OpManager-Home/conf. Change the port from 162 to the one you wish. Restart OpManager for the changes to take effective.
No, Layer-2 maps work for non-Cisco devices as well. You might sometimes encounter the error,"No switch links found for this device. Please select different seed device" when trying to draw network maps for non-Cisco devices. To get the Layer-2 maps for other vendor switches, it must meet the following criteria:
If you still encounter the error, it is due to OpManager using RFC1213 and ipRouteTable to create the maps. This RFC has been deprecated and has been replaced by RFC2096 and ipCidrRouteTable. This can be replicated with Mib Browser. Try to see if your device is compliant with RFC1213 or RFC2096. There should soon be a patch from the team to ensure that all devices are mapped correctly.
There are many mechanisms available to find the network connectivity. OpManager uses the general algorithm to find out the connectivity between switches, routers and network devices using SNMP. Layer 2 network connectivity falls under the category as mentioned below.
i) Router to Router connectivity.
ii) Switch to Switch connectivity.
iii) Switch to Network devices such as Router, Firewall, Access Point connectivity.
iv) Router to subnet connectivity.
v) End devices connected to a switch.
Router to Router connectivity / Router to subnet connectivity :
The routing algorithm is configured on all the routers and routing table details can be fetched from the router by querying ipRouteTable of RFC1213-MIB. The ipRoutable table contains an entry for each route present in the router.
The oids that we query are,
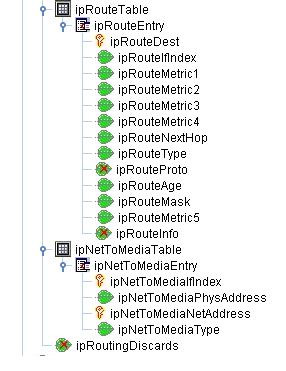
This routing table contains both direct and indirect routing path from a particular device. This implies that the router interface is directly connected to another router interface without intermediate switch or hub.
ipRouteDest - The destination IpAddress of this routing path may be network address or a router ip address.
ipRouteIndex - The interface through which the next hop of this routing path should be reached.
ipRouteNextHop - The ipaddress of the next hop of this routing path. It contains either source ipaddress i.e same ip address in case it is connected to a network or connected router ip address.
ipRouteType - The type of this routing path ( direct, indirect, invalid etc).
If routing type is direct it implies that we can reach the subnet which is specified in the ipRouteDest through this interface and the next hop contains the same ip address of this router. The interface can be identified by the route index value. So we will obtain the router to subnet connectivity as switch link object. The switch link object is formed in such a way that source --> destination along with connected interface.
If routing type is indirect, it means that the router is connected to another router. We have the source router and remote router ip address, which is obtained in the next hop node, and the interface index. So we will determine the router to router connectivity.
For example, Router 192.168.112.7's iproutingTable output,
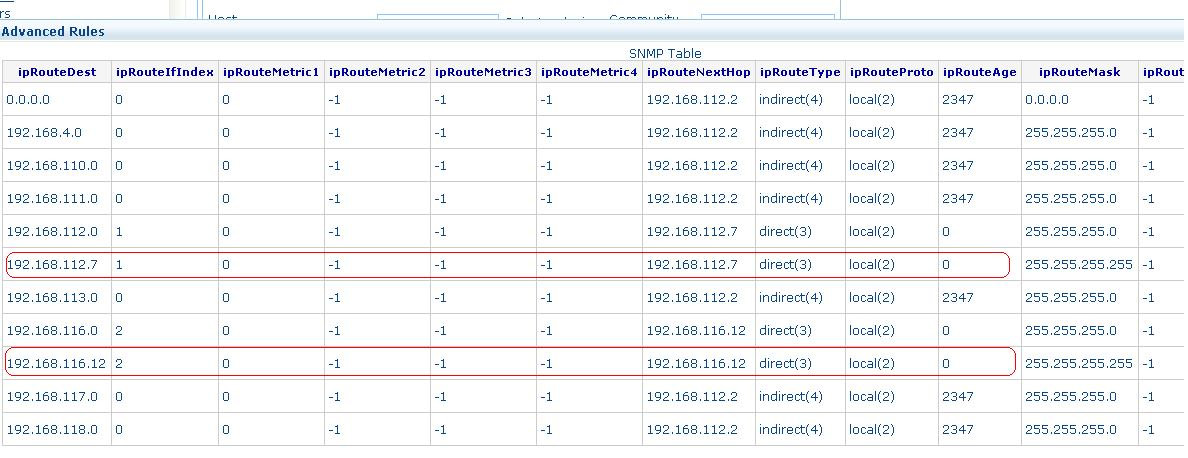
The router 192.168.112.7 is connected to 192.168.116.12 via 192.168.112.7's interface 2. Also the subnet 192.168.112.0 is reached via this router.
Switch to Switch Connectivity
The management information base (MIB) objects required to find the switch connectivity is as follows:
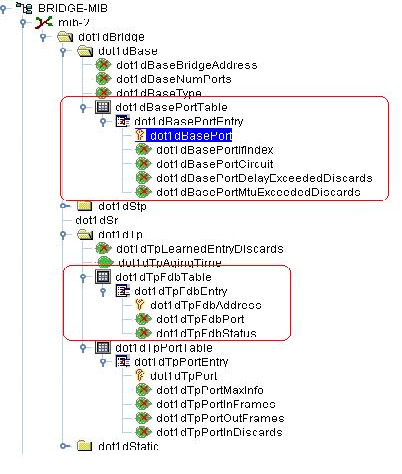
OpManager implements the Topology discovery algorithm which is explained in "Ip Network Topology Discovery using SNMP" ( Click the link). To find the switch to switch connectivity OpManager uses the values in the above table. The Bridge mib dot1dTpFdbTable contains MACAddress of the device which is reachable via this switch as well as port and status info. The dot1dTpFdbStatus can be in one of the five states- other ( 1 ) , invalid ( 2 ) , learned ( 3 ) , self ( 4 ) , mgmt ( 5 ). The type learned refers to active device connection. OpManager considers this type alone to find out the connectivity. This table has macaddress with port relationship and its corresponding ifIndex is obtained by querying the dot1BasePortTable. This gives only mac address of the device, so ipaddress of the device is obtained by querying RFC1213-MIB's ipNetToMediaTable.
The main algorithm is
1. Switch set = Filter the L2, L3, L4, and L7 switches that support Bridge MIB
2. Switch pair set = Make pairs of switches; if there are n switches there will be n2 sets
3. For each switch pair set, for ex: { Si, Sj}
a) Get the set of MAC for Si i.e., {Mia..Mil} from ifPhyaddress
b) Get the set of MAC for Sj i.e., {Mja..Mjk} from ifPhyaddress
c) If AFT of one of the dot1dBasePortEntry (Pi and Pj) of Si and Sj has at least one MAC address Mil and Mjk of each other
then
i) Get the mapping of Pi and Pj with the ifIndex Ifi and Ifj
ii) Set the connectivity of Si and Sj for interface Ifi and Ifj
iii) Store the connectivity information in database.
Switch to network device connectivity using CDP
Cisco Discovery Protocol (CDP) is propitiatory data link layer protocol which is developed by Cisco system. It is used to share information about directly connected Cisco devices. The above details are obtained by querying the tables below:
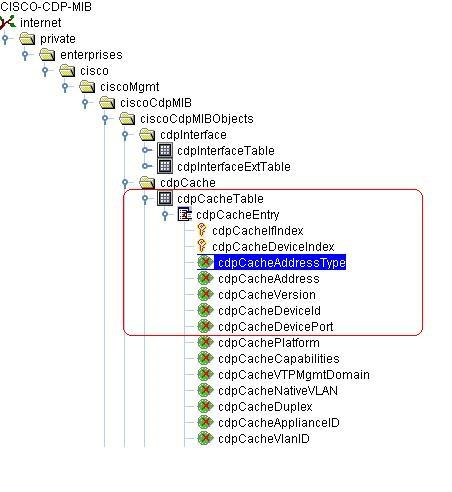
When the above table is queried, OpManager forms the switch link between the cisco device and the connected devices. This is because this table has the ip address of the connected devices as well as the details of interface through which it is connected.
You need to enable UDP jitter.
UDP Jitter Operation Vs RTP VoIP Operation
UDP Jitter is an operation that sends a stream of UDP test packets specially crafted for performance measurement. There is another operation called "RTP VoIP". There are fundamental differences between the two:
RTP VoIP sends a real RTP stream, while UDP Jitter sends a simulated stream. Both looks the same from the outside, but RTP VoIP packets contains a real RTP stream.
RTP VoIP uses and requires at lease one hardware codec to run. It needs DSP resources and voice interfaces to run on.
RTP VoIP will compute the MOS score based on the delay and number of DSP frames lost. UDP Jitter provides IP-based metrics, while RTP VoIP provides DSP-based metrics.
RTP VoIP is an operation that is very specific for VoIP, and UDP Jitter is more generic.
RTP VoIP is not designed to be deployed at large scale, while UDP Jitter is.
It is recommended to use UDP Jitter as much as possible, and it will be enough for the large majority of the cases. When more detailed information is needed, or for troubleshooting purposes, an RTP VoIP operation can be triggered on demand at specific time and location. RTP VoIP is not meant to replace UDP Jitter.
Courtesy: Info sourced from here:
http://docwiki.cisco.com/wiki/IOS_IP_SLAs_UDP_Jitter_Operation_Technical_Analysis
OpManager uses IP SLA's UDP jitter operation to determine the connection jitter, round-trip-time, packet loss and latency. It therefore uses this synthetic traffic to simulate traffic close to the real time traffic and does not monitor it real time. The function of IPSLA is to identify quality issues proactively by simulating the real time environment.
The need to use synthetic traffic can best be illustrated with an example. Let us assume that a call is scheduled for your CEO with a prospective client at 3.00 PM on a particular day. For some reason, the VoIP connectivity breaks at around 2.30 PM and the concerned people are not aware. Imagine you or the CEO discovering the issue just when the call commences! This is a situation a VoIP administrator would dread to be in. This is where, the method of sending synthetic traffic over the same WAN link through which traffic flows real time, helps.. You would have identified the packet drop much earlier and could have worked around the bottleneck much earlier.
OpManager primarily relies on Cisco's IP-SLA for monitoring the VoIP QoS metrics between two locations, therefore both the locations should have Cisco Router enabled with IPSLA agent. From IOS Version 12.3(14)T all Cisco routers support monitoring of VoIP QoS metrics
When you want to test a link from your office to another location, you need a Cisco router enabled with IPSLA agent ( IOS version 12.4 or later ) at each end.
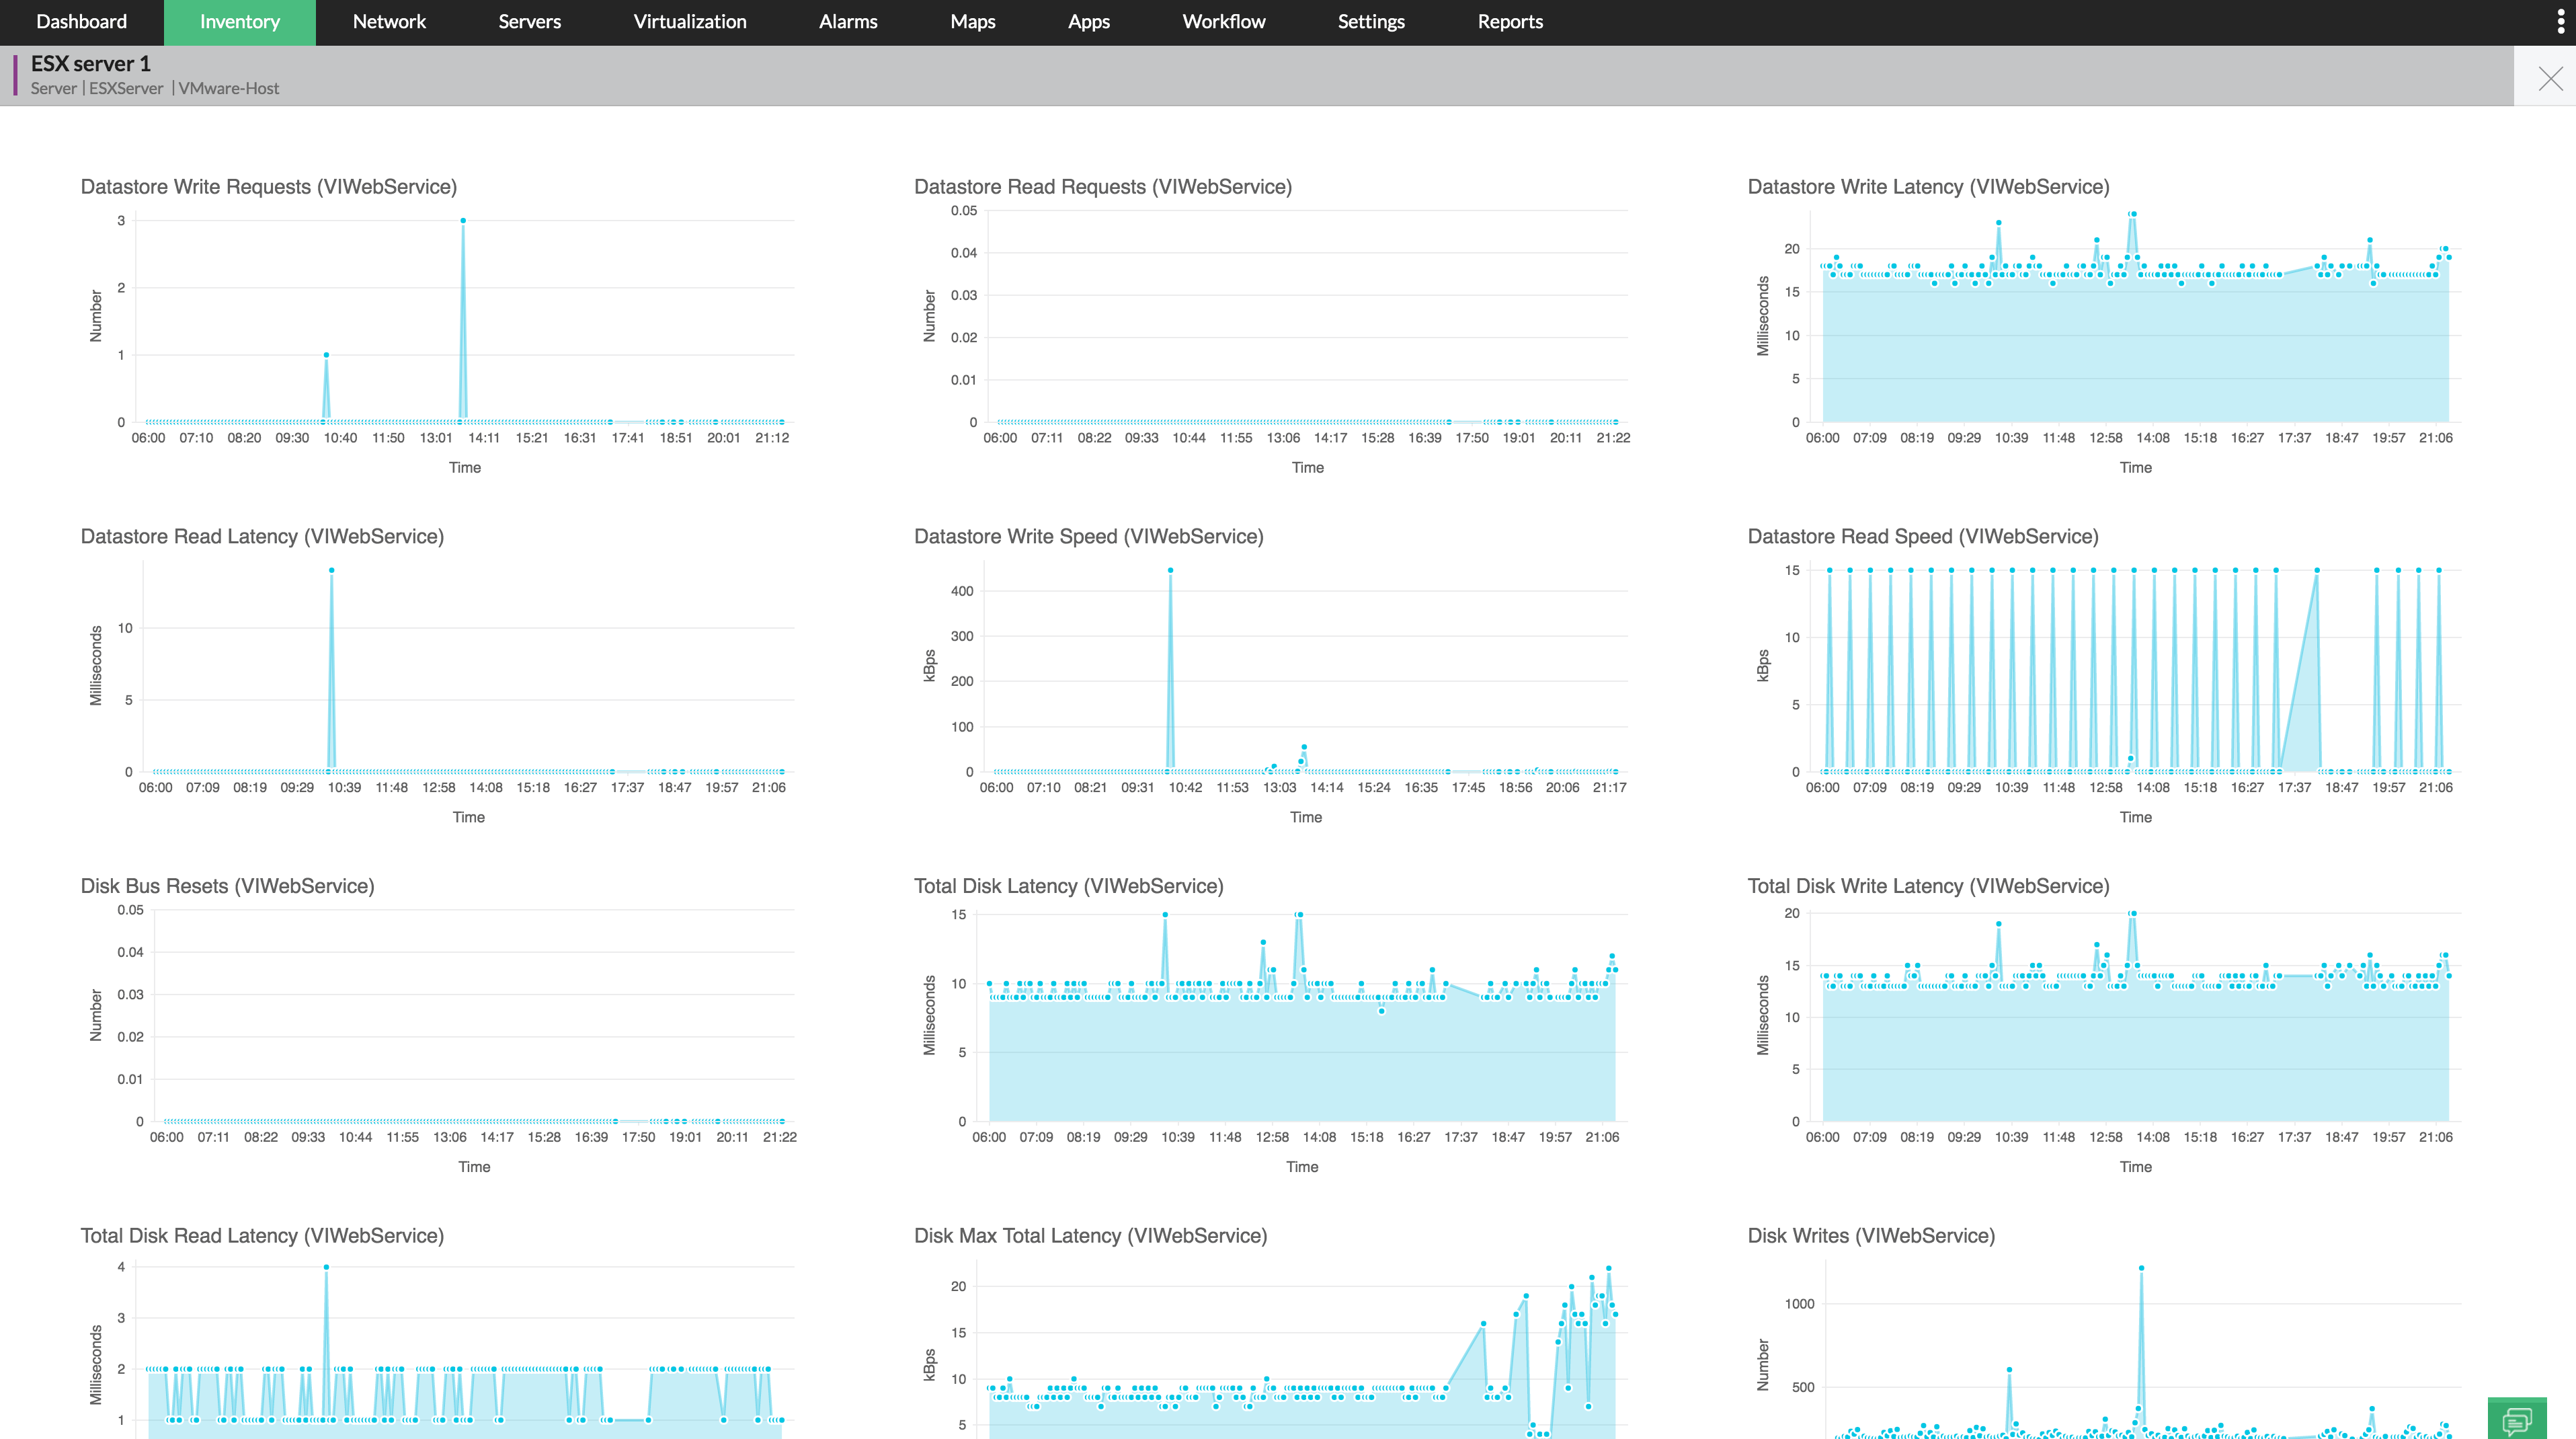
Yes, OpManager has extensive disk monitors, with graphical reports for the following:
OpManager pulls the details via the API, so make sure you configure the VMware credentials properly. You can access the monitor details from the host snapshot page and can see the reports on per VM basis too. Here's a screenshot for reference:
To start with, it is important to understand how OpManager categorizes the devices into servers, routers, switches etc. OpManager relies on industry standard protocols like SNMP, CLI, and WMI to 'identify' the devices. SNMP is the standard protocol across all device categories while CLI is specific to Unix-based servers, and WMI is specific to Windows environment.
A device is grouped under 'Unknown' devices view due to the following reasons:
Devices classified under 'Unknown' category
So, even if OpManager is able to ping and discover the device successfully, it does not know where to put the device and therefore classifies it under 'Unknown'! If you find any of your servers or other infrastructure device missing in the relevant category map, select the Maps --> Unknown category view and check if it is present here. You can move such devices to the relevant category, or rediscover them after enabling the SNMP/ CLI/WMI protocol and configuring the credentials.
Here are the Availability STATE information:
1. ACTIVE = 1 corresponds to the Device in UP state.
2. DOWN = 2 corresponds to the Device in DOWN state.
3. DEPENDENT_UNAVAILABLE = 3 corresponds to the DEPENDENCY DEVICE's down state.
4. ON_HOLD = 4 corresponds to the state when the Device is UNMANAGED ( like via Actions -> UnManage )
5. ON_MAINTENANCE = 5 corresponds to the device state when it is part of a DOWNTIME SCHEDULE that is in progress
6. PARENT_DOWN = 6 corresponds to the interface state when the parent ( device on which the INTERFACE is present) is down
7. PARENT_UNMANAGED = 7 corresponds to the interface state when the parent ( device to which the INTERFACE is present ) is UNMANAGED
In the database,this STATE column is present in the ManagedObject Database table
Codecs (Coder/Decoder) serve to encode voice/video data for transmission across IP networks. The compression capability of a codec facilitates saving network bandwidth and it is therefore appropriate that you choose the correct codec for your IP network. Here is a quick reference to the codecs with the corresponding packets size and bandwidth usage:
| Codec & Bit Rate (Kbps) | Operation Frequency | Default number of packets | Voice Payload Size | Bandwidth MP or FRF.12 (Kbps) |
Bandwidth w/cRTP MP or FRF.12 (Kbps) |
Bandwidth Ethernet (Kbps) |
| G.711a/u (64 Kbps) |
60 msecs by default. You can specify in the range of 0 - 604800 msecs. | 1000 | 160 + 12 RTP bytes | 82.8 Kbps | 67.6 | 87.2 |
| G.729 (8 Kbps) |
1000 | 20 + 12 RTP bytes | 26.8 Kbps | 11.6 | 31.2 |
In order to monitor VoIP between two locations, you need to specify the links that you want to monitor using OpManager, that is, specify the source and target. The source router (Cisco router with IP SLA agent enabled) must be discovered in OpManager first. Only if this router is discovered in OpManager with valid SNMO read and write community strings configured, you will see the router listed as a source device and you will be able to pick so that you can successfully add a VoIP monitor.
Please follow these steps to discover a source router in OpManager
1. Go to the source router telnet session and enable snmp read and write communities.
2. Go to Admin -- Credential Settings -- New
Enter valid read and write communities which is enabled in the source device.
3. Go To Admin --Add Device
Enter the name or IP address of the source device, select the newly added credential and then click on Add Device.
4. Go to VoIP Monitors -- Settings
Select newly added source router and proceed with the configuration.
Connect to that ESX host via vSphere client and do a refresh datastore.You can infact automate this refresh to happen every 5/10 minutes by creating a cronjob. Here is the procedure as cited by one of OpManager users in our forums- a nice workaround:
1. Connect to your ESXi with SSH or Telnet
2. Open your root file in your crontabs directory with the vi editor:
vi var/spool/cron/crontabs/root
3. Edit the file and put the following line in it:
*/5 * * * * /bin/vim-cmd /hostsvc/datastore/refresh <your_datastore_name>
4. Save the file
5. Restart the cron daemon
6. Be happy
Now the datastore you configured at <your_datastore_name> will be refreshed every 5 minutes.
This message is encountered when trying to turn interfaces on and off using the Interface Enable/Disable button (drill down to the interface level). To perform this action, OpManager requires the write community to be enabled for the device in OpManager. Whenever you enable or disable any interface of the device in OpManager, it will write them on the router or switch using the write community.
So, check if you have configured the correct write community on the device in OpManager and give a try again.
When trying to delete a WAN RTT monitor, the following error is encountered:
[Exception in:/webclient/common/jsp/PageNavigation.jsp] null
A possible corruption of the Cisco RTT MON MIB could cause this error when trying to delete a WAN RTT monitor.
Copy this MIB to the \OpManager\mibs folder replacing the original file and restart OpManager service. You must be able to delete the monitor now.
OpManager accepts only SQL Authentication credentials with DB Owner & DB Creator rights.
By default OpManager uses the following ports to monitor devices ..
SNMP-161
SNMP Traps - 162.
WMI - 135 & 445
Telnet - 23
SSH - 22
ICMP ping
32-bit counters:
Ref mib: RFC-1213-MIB
Ref tables: ifraw(raw data), ifhourlysum(Sum up collected raw data for every hour and stored in this), ifhourlyrate, ifdailysum,ifdailyrate
In Traffic(bps) : InOctets*8*1000/deltatime ()
Out Traffic(bps): OutOctets*8*1000/deltatime
In Packets per sec: (INUCAST+INDISCARDS+INERRORS+INUNKNOWNPROTOS+INNUCAST)*1000/deltatime
Out Packets per sec: (OUTUCAST+OUTNUCAST)*1000/(DELTATIME)
In Bytes: INOCTETS
Out Bytes: OUTOCTETS
In Util(%) : (InTraffic/Inspeed)*100 = (InOctets*8*1000*100/deltatime*inspeed)
Out Util(%):(OutTraffic/OutSpeed)*100 = (OutOctets*8*1000*100/deltatime*Outspeed)
Total util(%): (Inutil+outUtil)/2
64-bit Counters:
Ref mib: RFC-1213-MIB,IFMIB
Ref tables: ifhcraw(raw data), ifhchourlysum(Sum up collected raw data for every hour and stored in this), ifhchourlyrate, ifhcdailysum,ifhcdailyrate
In Traffic(bps) : InOctets*8*1000/deltatime
Note: we will poll for .1.3.6.1.2.1.31.1.1.1.6.ifIndex to get In Traffic. Sometimes agent may implement 64-bit counters partially for interfaces. In that case query to .1.3.6.1.2.1.31.1.1.1.6.ifIndex oid will give zero values. At the time we will take 32-bit counter value. We will query to .1.3.6.1.2.1.2.2.1.10.ifIndex
Out Traffic(bps): OutOctets*8*1000/deltatime
Note: we will poll for .1.3.6.1.2.1.31.1.1.1.10.ifIndex to get In Traffic. Sometimes agent may implement 64-bit counters partially for interfaces. In that case query to .1.3.6.1.2.1.31.1.1.1.10.ifIndex oid will give zero values. At the time we will take 32-bit counter value. We will query to .1.3.6.1.2.1.2.2.1.16.ifIndex
In Packets per sec: (INUCAST+INDISCARDS+INERRORS+INUNKNOWNPROTOS+HCINMCAST+HCINBCAST)*1000/deltatime
Out Packets per sec: (OUTUCAST+HCOUTMCAST+HCOUTBCAST)*1000/(DELTATIME)
In Bytes: INOCTETS
Out Bytes: OUTOCTETS
In Util(%) :(InTraffic/Inspeed)*100 = (InOctets*8*1000*100/deltatime*inspeed)
Out Util(%):(OutTraffic/OutSpeed)*100 = (OutOctets*8*1000*100/deltatime*Outspeed)
Total util(%): (Inutil+outUtil)/2
You may experience this if there is some issue in the database or if there is an issue with AD authentication. Please try restarting OpManager and check if it works. Else, email the Support information file for analysis.
Opmanager might throw this error when there is a dot(.) in the IP Address. If this is not the case, email the exact IP and the netmask to our support to help reproduce and resolve the error.
The inbuilt monitor for WMI based Disk Queue length is for all disks(ie "_Total"). If you want this for a specific disk, use custom WMI monitor.
Performance Monitors--Add Monitors--->WMI monitors
This will list all the available classes. When you select disk queue length, you can see the partitions as instances. Select the partition and add monitor. Note that the disk queue length monitor is found under the WMI-based Disk Monitors.
It depends on the job done by the scripts. Use the Test script option to determine the approximate timeout period. If the scripts perform very basic operations, 10 seconds would suffice.
Every time, the script content is written to a file in disk and this takes some time. Monitoring interval also depends on the number of script monitors associated. (though we haven't determined the exact number yet!). We suggest that you configure a 10 min monitoring interval for local scripts and 15 mins for scripts running on remote machines.
A sample query:
(SELECT al.*,si.ifalias,si.ifcircuitid FROM IntferrorThreshold idt INNER JOIN ManagedObject mo ON idt.id=mo.moid INNER JOIN SNMPInterface si ON mo.name=si.name INNER JOIN Alert al ON al.entity=CONCAT("IF_ERROR_",idt.id))
UNION
(SELECT al.*,si.ifalias,si.ifcircuitid FROM IntfdiscThreshold idt INNER JOIN ManagedObject mo ON idt.id=mo.moid INNER JOIN SNMPInterface si ON mo.name=si.name INNER JOIN Alert al ON al.entity=CONCAT("IF_DISCARD_",idt.id))
These errors occur because of stray entries for these devices in the database from their previous discovery. This is resolved by cleaning up the entries from the relevant tables. Here is how you do it:
- Extract the enclosed Zip file to the OpManager installation directory. This will create a new folder "RemoveDBEntires" and 4 files will be kept under that folder.
- Run the script RemoveDBEntries.bat(RemoveDBEntries.sh for Linux) both using IP Address and Device name. Make sure the server is running, when you execute the script. Thisscript will remove the partially added entries from the database.
- RemoveDBEntries script accepts the device name and ip address as argument.
cmd> cd [OpManager Home]/RemoveDBEntries
cmd> RemoveDBEntries.bat IPaddress
cmd> RemoveDBEntries.bat <devicename>
Example:
\\OpManager\\RemoveDBEntries>RemoveDBEntries.bat 192.168.12.34
\\OpManager\\RemoveDBEntries>RemoveDBEntries.bat opman.zohocorp.com
This script will remove the partially added entries from the database.
- After executing the script, please restart OpManager service and add the device.
Note: It may take couple of minutes to view the newly added device.
OS: Windows 2000 and above / R.H. Linux 7.2 and above.
Attachment : RemoveDBEntries.zip for Version 7 and above
2006_11_8_12_34_26_RemoveDBEntries.zip for Version 6
RemoveDBEntriesNew.zip for OpManager 8030 & above (till build 8052)
RemoveDBEntriesNew-8720.zip for OpManager build 8700 & above
Note 1: Use RemoveDBEntriesNew.zip only for OpManager build 8030 and above (till build 8052 ) , here the zip file will create a folder in the name of RemoveDBEntriesNew instead of RemoveDBEntries while extracting. Follow the same steps above from the cmd> cd [OpManager Home]/RemoveDBEntriesNew directory instead of cmd> cd [OpManager Home]/RemoveDBEntries.
Note 2: Use RemoveDBEntriesNew-8720.zip only for OpManager build 8700 & above , here the zip file will create a folder in the name of RemoveDBEntriesNew instead of RemoveDBEntries while extracting. Follow the same steps above from the cmd> cd [OpManager Home]/RemoveDBEntriesNew directory instead of cmd> cd [OpManager Home]/RemoveDBEntries.
Attached Files :
2006_11_8_12_34_26_RemoveDBEntries.zip
This can happen if a dependent mib is missing. Please download the attachment, place it under OpManager\mibs folder and try again.
Settings -> quick configuration wizard -> Monitoring Intervals => Device availability monitoring using ping. Is done at the interval configured here.
Monitor specific interval => Data collection interval for that metric alone(WMI/SNMP/CLI). Irrespective of the device availability monitoring interval, the particular performance parameter is monitored at the interval specified here, at the monitor level.
Both are necessary for overall device health monitoring.
Let us assume you have manually classified a device into Windows2008 category and then go on to apply the Win2008 template to the device to associate monitors.. The template is not applied properly for the following reasons:
1. If you are running OpManager on Linux and the template has WMI-based monitors.
2. If you have installed on Windows, but have not configured the WMI authentication credentials for the monitored device (in this case, the win 2008 device)
3. If the device has SNMP and you have not provided the SNMP credentials for the device.
Configure the credentials for the device and proceed with applying the template.
OpManager has an in-built MySQL and TOMCAT which needs lot of changes to run as non-root user. So we didn't provide this option. It is the same for all our ManageEngine products.
OpManager has four different severity levels for the alarms. Severity levels of device down alarms (availability monitoring) are already predefined
Here is the list with the severity and the events which will trigger the alarms with these severities
1)Service Down: When is service down and URL monitor is down
2)Attention: When the device is down for the 1st poll in availability
3)Trouble: When the device is down for 3 consecutive polls in Availability
4)Critical: When the device is down for 5 consecutive polls in Availability. This is the highest severity in OpManager.
5)Clear: At any stage if an alarm is cleared.
As you can see, the severity will automatically change for the device down alarms based on the number of missed polls.
Similar to device down alarms, Interface down alarm severity(Trouble) is also predefined.
But for other alarms like threshold violation, Traps and event logs, user can configure any severity(Attention or Trouble or Critical) and the severity will be the same even if the alarm is repeated.
The details of the tables are:
The performance data tables in OpManager 7 are quite distributed, enabling better reporting. Here is a quick summary of the tables that you will need to take custom reports
1. ElementsAvailabilityHourly - Every day device availability reports are taken from this table.
2. ElementsAvailabilityDaily - This table is queTried for availability reports for over a week. Has data archived every 24 hours.
3. IfRaw_<date> - This table has data of interface traffic, errors, discards etc
4. IfHourly_<date> - This has values archived every one hour for all the interface data
5. IfDaily_<date> - This has values archived every 24 hours
OpManager archives the above performance tables after the row-count exceeds apprx 250,000 rows. So, to know the date of the table to be queried, query the table METATABLE. This lists all the perforformance tables. The current performance tables (the names of which are mentioned above) will have the value as -1 for ENDTIME field.
Each element/device is a managed object and has a unique ID, which you can retrieve using MOID field in the ManagedObject table. The value of this MOID is the same as ElementID field in the above tables. So, you can use a join between these two tables to create custom reports.
Besides the above tables, the host resources data such as that of CPU, Memory etc are persisted in the following table:
1. Statsdata<current date>: This stores the current or raw data. That is, the data as and when collected. This table is created every 24 hours. New table is created at 12.00 midnight.
2. Statsdata_hourly: Which has values archived every one hour. Hourly data is stored for a period of 15 days by default and can be set to a maximum of 90 days.
3. Statsdata_daily: Which as values archived every 24 hours. Daily data is stored for a default period of 1 year and can be set to store for a max of 10 years.
For additional information refer to DatabaseSchema.conf located under OpManager/conf folder
If Hyper-V discovery/rediscovery fails, try troubleshooting your Hyper-V resources as below.
For our team to troubleshoot this, it's essential that we have the necessary logs of discovery/rediscovery of the Hyper-V host (with debug enabled).
Even if the right credentials have been provided, data collection could fail for a number of reasons.
Some cipher suites are not supported by Java owing to security reasons. Since OpManager also uses Java, URLs that use some of the weakly encrypted algorithms cannot be monitored using OpManager. The latest version of OpManager uses Java 8.
For example, the cipher suite TLS_DH_anon_WITH_AES_256_GCM_SHA384 is not supported by Java, therefore URLs using this suite for encryption cannot be monitored using OpManager.
To find the cipher suite used by a particular URL:
To know more on supported cipher suites in Java 8, visit Oracle's Java Cryptography Architecture documentation on Java 8.
You can use Workflows to automate actions like moving, copying or deleting files/folders in your device.
If there's no communication between the agent and OpManager server, first check if you can ping the OpManager-installed device from the agent-monitored device.
Alarms in OpManager are raised to notify a user. When an alarm is raised, the user can deploy any of the following actions: Clear, Acknowledge/UnAcknowledge and Delete based on the requirement.
Clear:
The Clear option in Alarms is used to resolve an alarm. Generally a user can define the threshold values for monitors associated to devices based on various severity levels. The severity levels available in OpManager are:
When a device violates, say, the critical threshold value of a monitor, then OpManager would send an alarm notification with red colour. Likewise, the alarm notification raised for a particular threshold violation is different from the other.
The Rearm value of a monitor associated to a device indicates that the device has returned back to normalcy.
Once the alarm attains the Rearm value, OpManager will automatically clear the alarm raised for the particular device. Users can also clear an alarm at any stage manually.
Acknowledge
The Acknowledge option in alarms is used to denote whether an alarm has been attended or not. Once if an admin/operator clicks on the Acknowledge option on the OpManager for an alarm, the user details will be updated on the alarm. Until someone acknowledges an alarm the particular alarm will stay unassigned.
Delete
Users can delete alarms in OpManager and the difference between deleting and clearing is that when an alarm is cleared, the record of the alarm wil be retained and available in the All Alarms page in OpManager. But, when an alarm is deleted the details of the alarm will be completely erased from OpManager.
How to Clear/ Delete/ Acknowledge alarms in OpManager?
Alarms can be cleared, deleted or acknowledged in three ways in OpManager.
Alarms page

Alarms snapshot page

Device snapshot page

Border Gateway Protocol (BGP) is used to check the connecting signals from the router. Whenever the signal from a particular router is down, a BGP trap will be sent to the monitoring tool.
What are Flaps?
A BGP trap is sent to the OpManager when the connecting signal from the router is either up or down and a flap is the combination of an up and a down signal.
For instance, say a signal from Router A is lost for a few seconds, this status will be taken as 'down; when the signal again comes back alive, the status will be taken as 'up'. This combined pair of a down and an up constitutes one flap.
Flap count in OpManager
OpManager would raise an alarm when the specified value of flap count is violated. By-default, there are two severity levels associated with flaps in OpManager: Critical and Clear.
When more than 5 flaps occur within the time duration of 1 hour, then the severity level is considered as Criticlal and an Alarm is raised.
On the other hand, if less than 5 flaps occur in a time duration of 1 hour, then the Alarm will be cleared, as it attains the Rearm value.

The 10028 Event will be created when the WMI request to the remote device failed due to wrong credentials.
Sample message:
Event 10028 DCOM was unable to communicate with the computer xx.xx.xx.xx using any of the configured protocols; requested by PID yyyy.
How can I troubleshoot this 10028 error?
If all of these conditions have been satisfied, the event will be stopped automatically.
The communication between the Central and a Probe of OpManager Enterprise Edition can be configured via HTTP or HTTPS. Although users have the liberty to choose one type of protocol over the other, it is advisable to configure and communicate via HTTPS for enhanced security.
When the communication protocol configured in both the Central and the Probes is HTTP, OpManger Central notifies the user to convert to HTTPS with the following message.
"The ongoing communication between the Central and all the Probes connected to it is established via HTTP. Convert to HTTPS for enhanced security."
To convert HTTP into HTTPS,
The following message appears in OpManager Probes when the communication between the Probes and the Central is via HTTP.
"Probe is currently communicating with the Central via HTTP. Please convert to HTTPS for secured communication."
The communication between a Probe and the Central occurs via HTTP due to either of the following reasons.

Host name verification is done to ensure that a client communicates with a valid and trusted server. For example, you use a browser (client) to access a website (web server). The browser sends a request to the website to verify its credibility.
The website in turn sends the SSL certificate details and the client checks whether the website name used in the browser's URL field matches the Common Name (CN) or Subject Alternative Name mentioned in the SSL certificate. If there is a match, then secure communication is established between the client and the server.
Impacts of failed host name verification
An SSL certificate ensures a secure data transaction between the client and the server. All the information transacted between the two entities happens in an encrypted channel. But, when the host name does not match the one specified in the SSL certificate, then it may indicate that the contacted server is false and the user may end up sharing personal or sensitive data to a fraudulent server
Recommended practice in OpManager
In OpManager, you have to specify URL address for few functionalities such as URL monitoring, third party integration using webhooks or while configuring SMS server settings. Wherever URLs are involved, it is highly recommended to specify the exact hostname as given in the security certificate to ensure a secure connection.
If you have any questions about OpManager, feel free to raise a support request and we’ll get back to you.