Endpoint Central Agent Troubleshooting Tool
Table of contents
- What is Agent Troubleshooting Tool
- Understanding the need for troubleshooting agents
- How to troubleshoot Endpoint Central agents
- Additional troubleshooting steps
What is the Agent Troubleshooting Tool
Endpoint Central works on the principle of agent server communication, where the agents residing on end-user machines, contact the central server once every 90 minutes as per the agent refresh policy. In addition, the agents will contact the central server during device startup and user login instances. The agent troubleshooting tool supported by Endpoint Central allows end-users to troubleshoot the agents and restore connection rather than requesting their IT administrators to look into the issue.
Understanding the need for troubleshooting agents
The Endpoint Central agent might go down due to network level issues or issues that breaks the agent service. IT administrators can view the live status of the managed agents under the Scope of Management view. When an agent is marked "down" (indicated with red color monitor icon), IT administrators can remotely connect to those endpoints and troubleshoot it. Likewise, end-users can check the status of their agent by accessing the tray icon. Whenever the agent icon is down, end-users can access this tool and troubleshoot their agent. Once the troubleshooting process is done, the tool will provide a detailed report on the agent communication issues and the fix.
How to troubleshoot the Endpoint Central Agent
- Windows
- Linux
- Mac
This tool will be available in the Endpoint Central agent installed machine. Troubleshooting can be performed by informing the end-user to initiate the action or by assisting them remotely. To access the troubleshooting tool click the troubleshoot option in the agent tray icon. Click on "Start Troubleshooting" button to initiate the process. Alternatively, agent troubleshooting tool can be accessed through ManageEngine\UEMS_Agent\bin\agent_troubleshooting_tool.exe. The troubleshooting tool will appear like this one shown in the below image:-
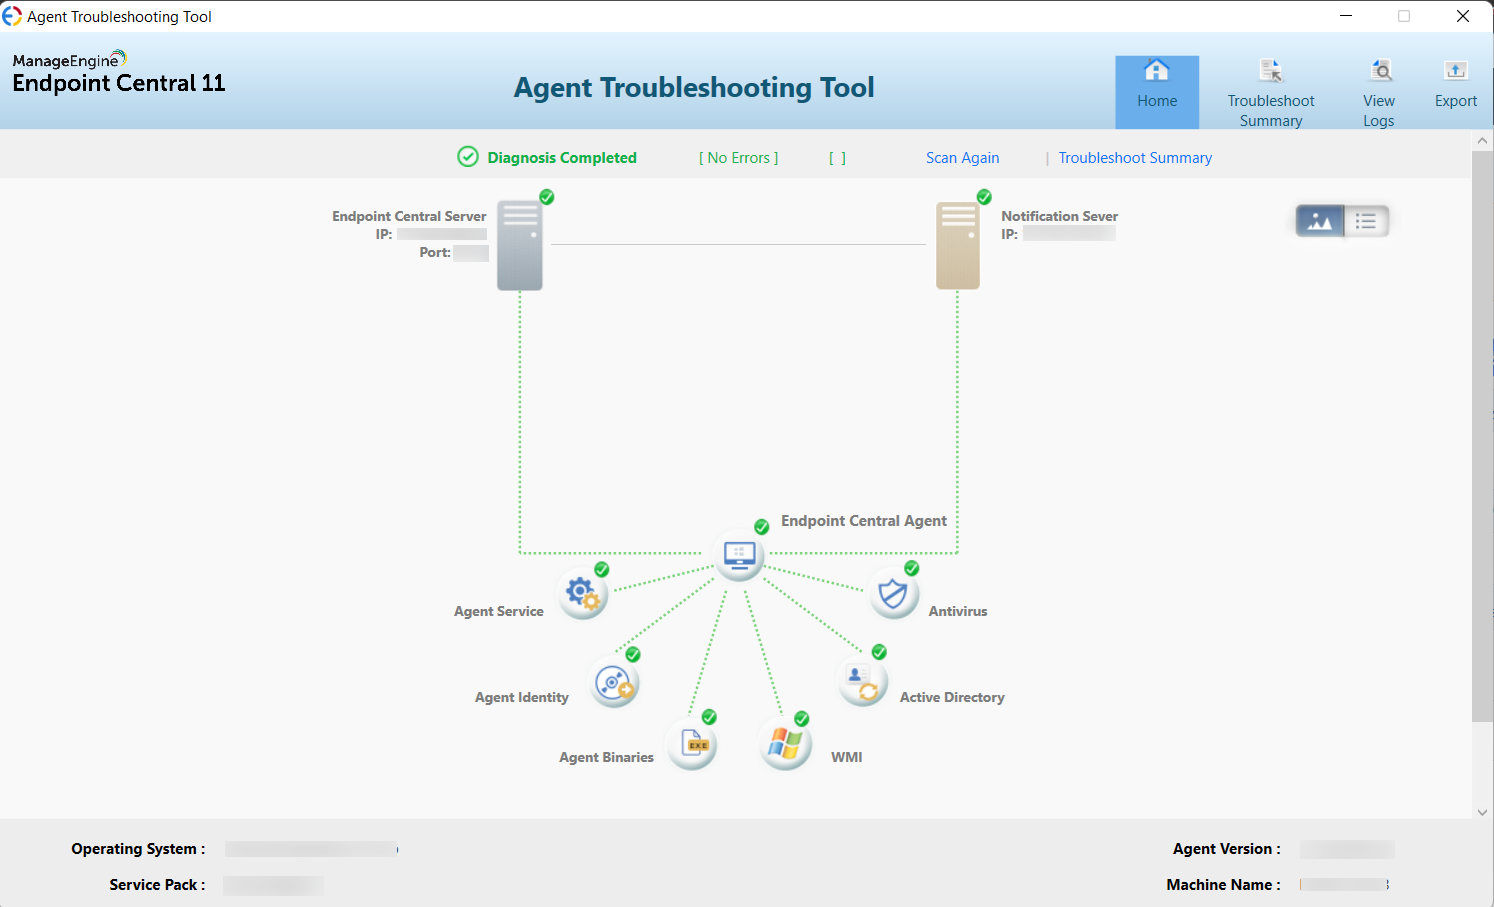
Note: The above image consists of an agent that is directly managed by the central server (OP) without a distribution server.
The troubleshooting action will diagnose the primary network level issues and display the results graphically. Here is a list of information that is pulled as a result of this troubleshooting action:-
- Agent Binaries
- Agent Identity
- Agent Service
- Antivirus
- Active Directory Connection Status
- Distribution Server Connection Status
- Notification Server Connection Status
- Endpoint Central Server Connection Status
- WMI Connection Status
Note: When you click on each component, it will display detailed information about its status. The troubleshooting tool runs once every 24 hours, storing the data that is displayed on the first click. Clicking the Scan Again button will fetch the current connection status.
Components in Troubleshooting Tool
- Agent Service : Agent Service displays the status of the Agent service, showing if it is running or not. If a warning or error message appears, clicking on the service provides access to attached KB articles for issue resolution.
Note: The ManageEngine UEMS - Remote Controlservice remains in a stopped state and only operates during a remote connection. Only ManageEngine UEMS - Agent service and ManageEngine Unified Endpoint Security - Agent run regularly.
Agent Identity: The Agent Identity displays details about the agent machine name, OS Name, Last bootup time, OS install date, Identifying number, and UUID. An error indication occurs if the agent machine was imaged from another machine and has not fully recovered.
Agent Binaries: It verifies successful extraction of agent binaries during installation and upgrade. Warning/error flags indicate unsuccessful extraction. (Example: Sample binaries like Software Metering Report, USB Report, Notification Server Client, Inventory Management, Patch Management)
WMI Connection Status: Windows Management Instrumentation (WMI) consists of specifications from Microsoft designed to streamline device and application management across a network of Windows computing systems. When the agent fails to retrieve WMI details from Windows, it triggers an error. This failure hampers Helpdesk requests, preventing their transmission to the server and impeding the functionality of UUID details and related functions.
Active Directory Connection Status: This displays the result of the Active Directory connection, providing domain and group details to which the machine and user are joined. In case the Active Directory connection fails, domain details cannot be updated, and patches and configurations related to the domain will not occur.
Antivirus: Lists installed Antivirus software and their associated GUIDs (Globally Unique Identifiers).
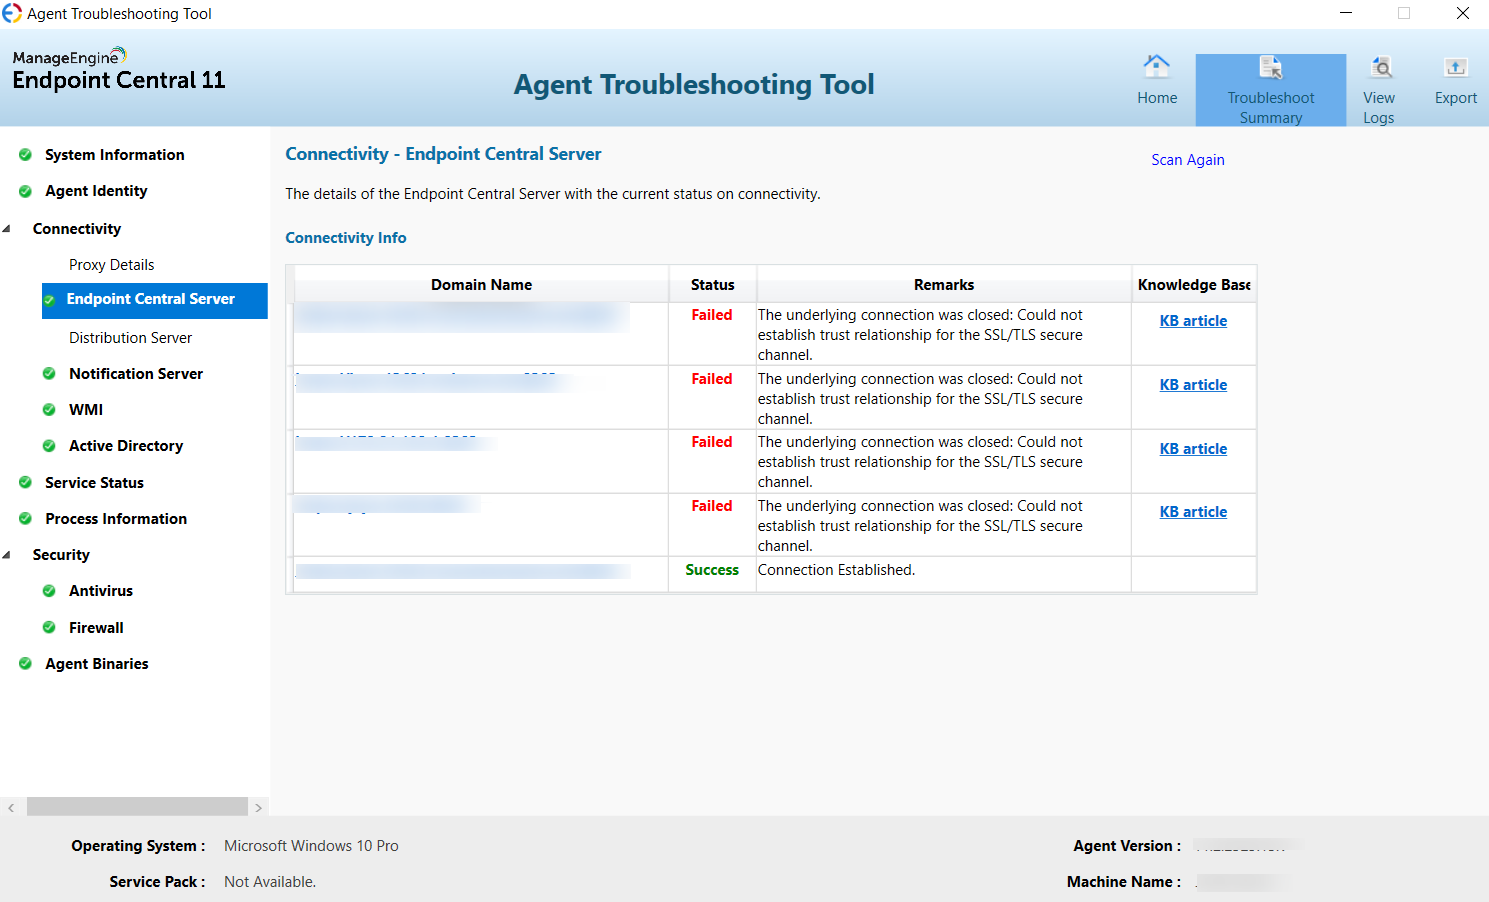
Endpoint Central Server Connection: Displays the connection status between the agent and server, automatically checking ping and port connection with server address. It showcases all addresses used by the agent to contact the server. Server-related issues are highlighted in the error column, with reconnection steps mentioned in the attached KB articles.
For Endpoint Central Cloud, The troubleshooting tool will display the agent's connection with the server through all cloud addresses. As the Cloud does not have a Notification server component, all agent-to-server refresh and on-demand functions occur via the cloud addresses
- Distribution Server: The Distribution Server (DS) verifies the Agent-to-Distribution Server connection using ping and port connections. When the agent operates under the Distribution Server, all agent configurations, patch deployments and upgrades occur through the Distribution Server. It automatically validates the ping and port connection with the Distribution Server address. The Distribution Server establishes a connection with the agent via the Distribution Server name and IP. Any server-related issues will be displayed in the error column. Steps for reconnection will be available in the attached KB article simultaneously.
Note:The Distribution Server component will only be listed in the Agent Troubleshooting Tool, if the agents are managed under the Distribution Server.
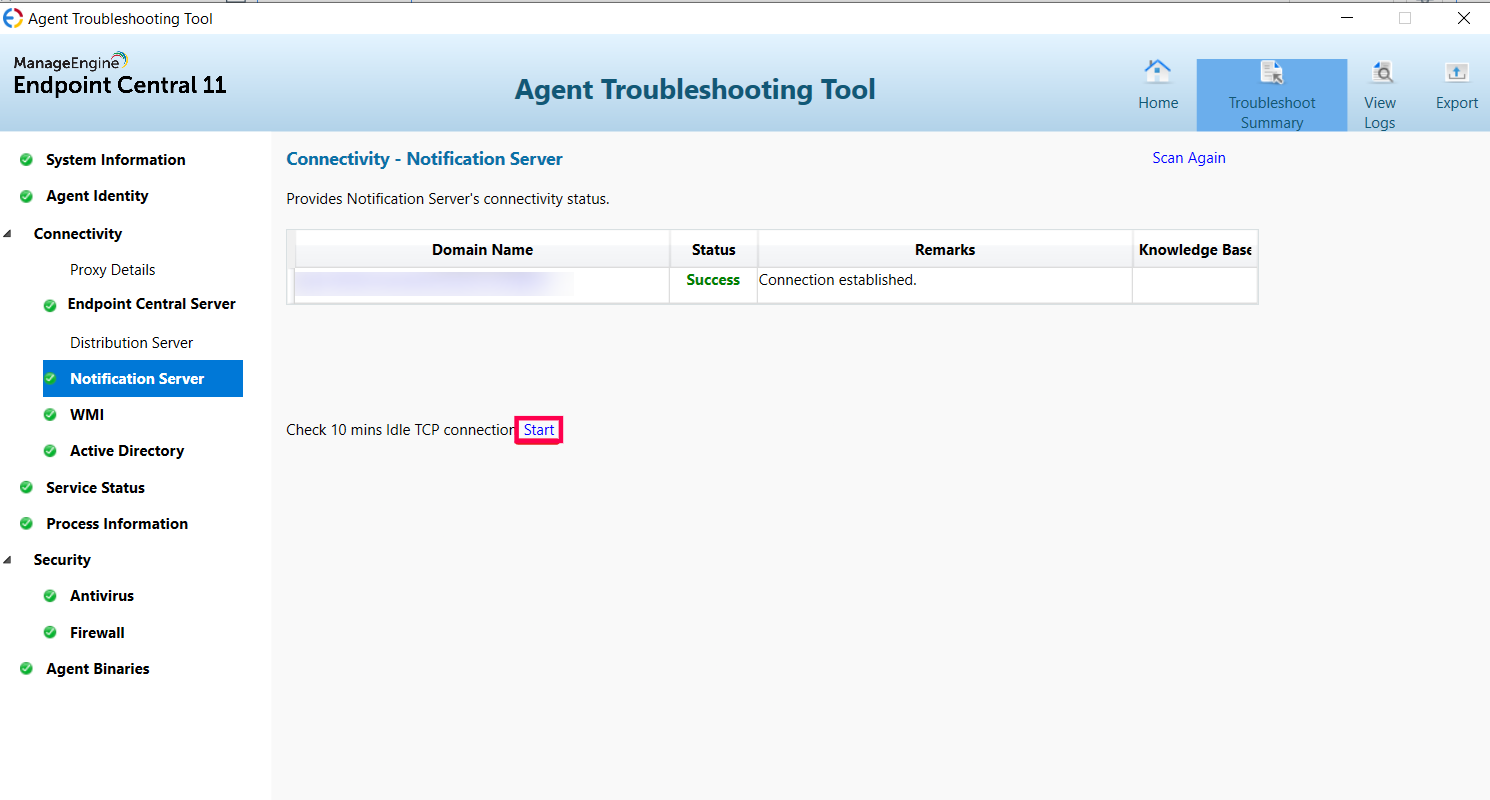
- Notification Server Connection: The Notification Server, a crucial component, manages all on-demand actions executed by on-premise agents. These actions include remote connections, on-demand configurations, and patch deployments. The Agent's notification server connection status is displayed here. The notification server necessitates a 10-minute idle connection for live status updates to the server and to execute on-demand actions initiated from the server. Any connection issues are promptly updated in the remarks column. To verify the 10-minute idle connection, simply click on Start in the Notification Server Summary. This action will inspect the idle connection and provide the result.
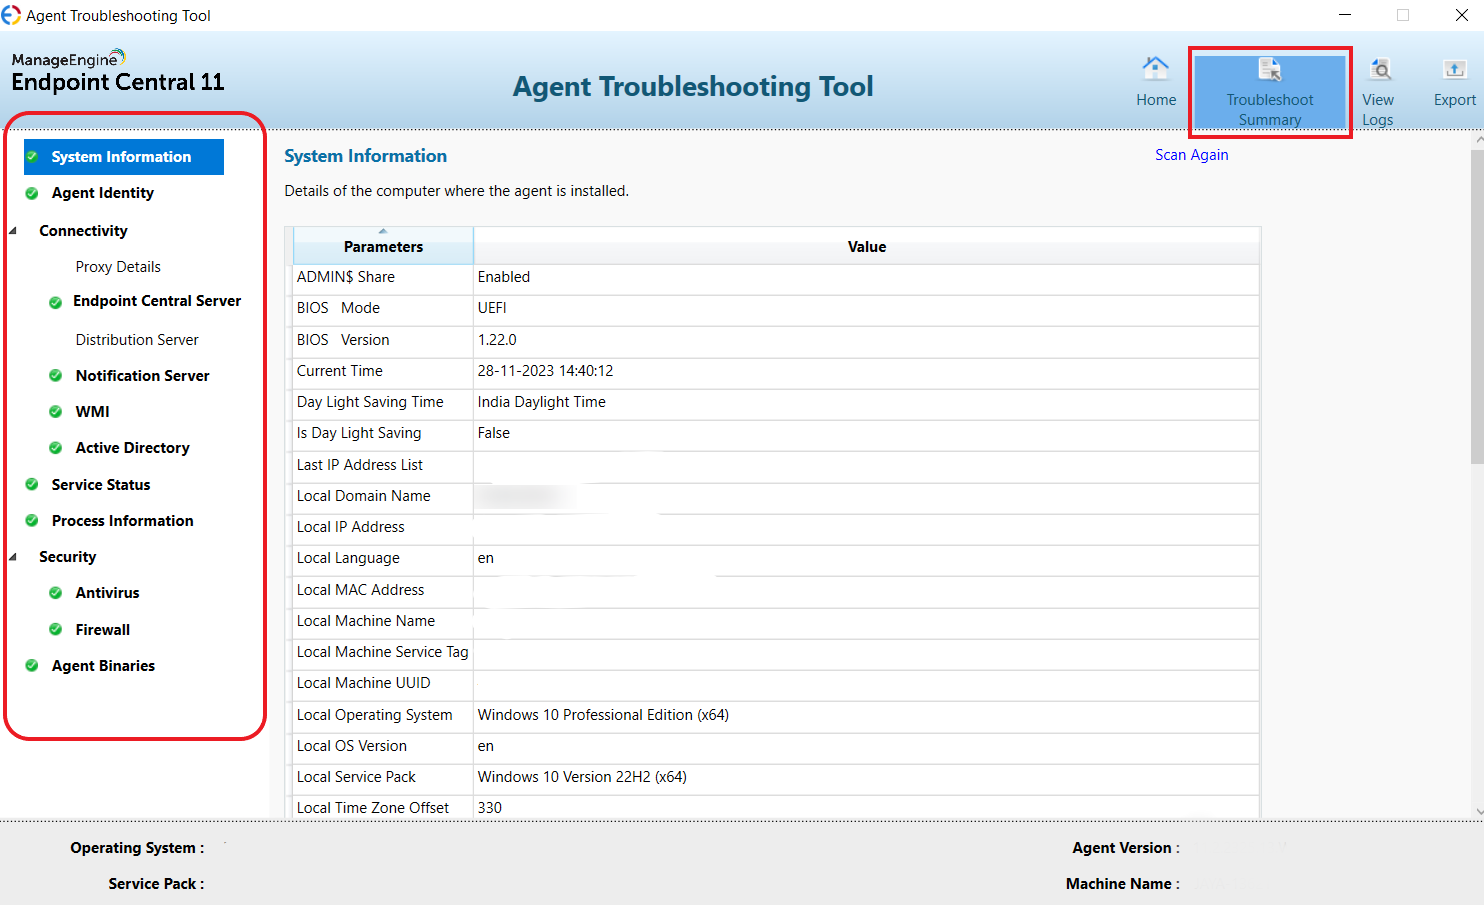
Troubleshooting Summary
The Troubleshooting Summary provides detailed information on system details, agent specific details such as version and installed location, firewall configurations, and the connection status of agent components.
View Logs
Agent logs are easily accessible via the Troubleshooting tool by selecting View Logs. Additionally, logs are segregated for each component, such as system information, configuration, patch, and others.
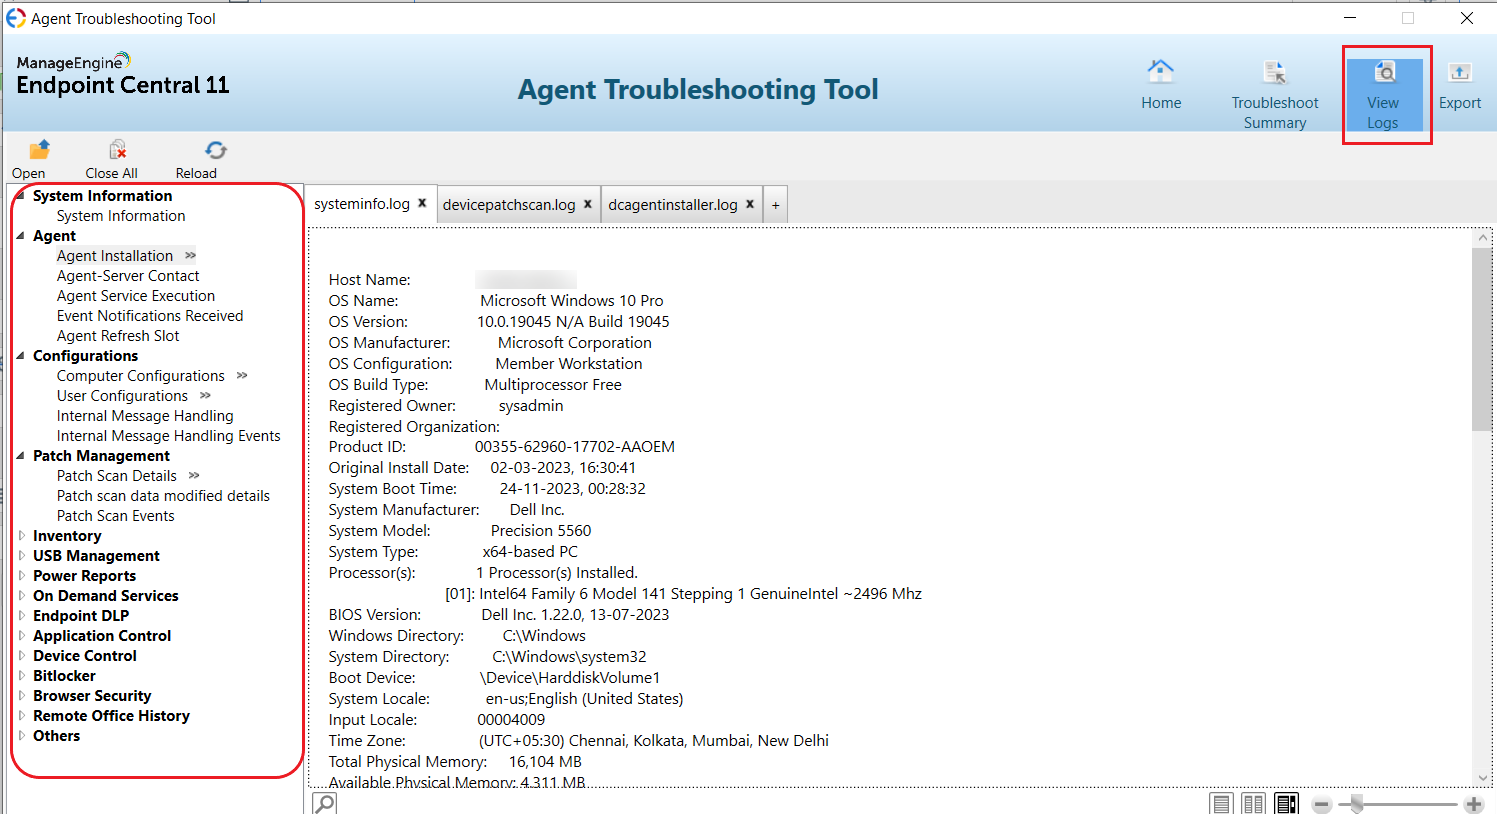
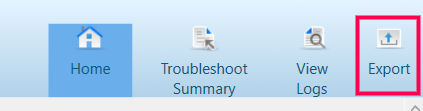
Export
In case if you could not troubleshoot the agent's connectivity issues using the KB articles mentioned above, you can share all the details available in the troubleshooting tool with our support for assistance by clicking on the Export option
Additional troubleshooting steps
If you wish to verify the agent server connection manually, follow the steps given below:
To check if the necessary ports are opened,
- Run the following command in the command prompt: telnet <Server Address> <Server Port>
- A blank screen indicates a successful connection. The same steps are applicable to check the Agent-DS connection as well.
To check the data transfer,
- Access the product console through your browser.
- If there is any blockage in data transfer between agent and server, the EC Server console will fail to open. It might be caused by some restriction in network firewall or some other restriction in network level.
To test file downloads from the agent machine,
- File downloads can be verified by accessing the following URL from the agent machine browser: https://<Server_Address>:<Server_Port>/client-data/ns-status-details.xml
- If a .xml file is displayed and available for download, it denotes a successful connection.
For version 2203 and above, the troubleshooting tool will be available in the agent.
- Navigate to <Agent Installed Directory>/bin.
- Open terminal in the same location and run the command sudo ./dctroubleshootingtool
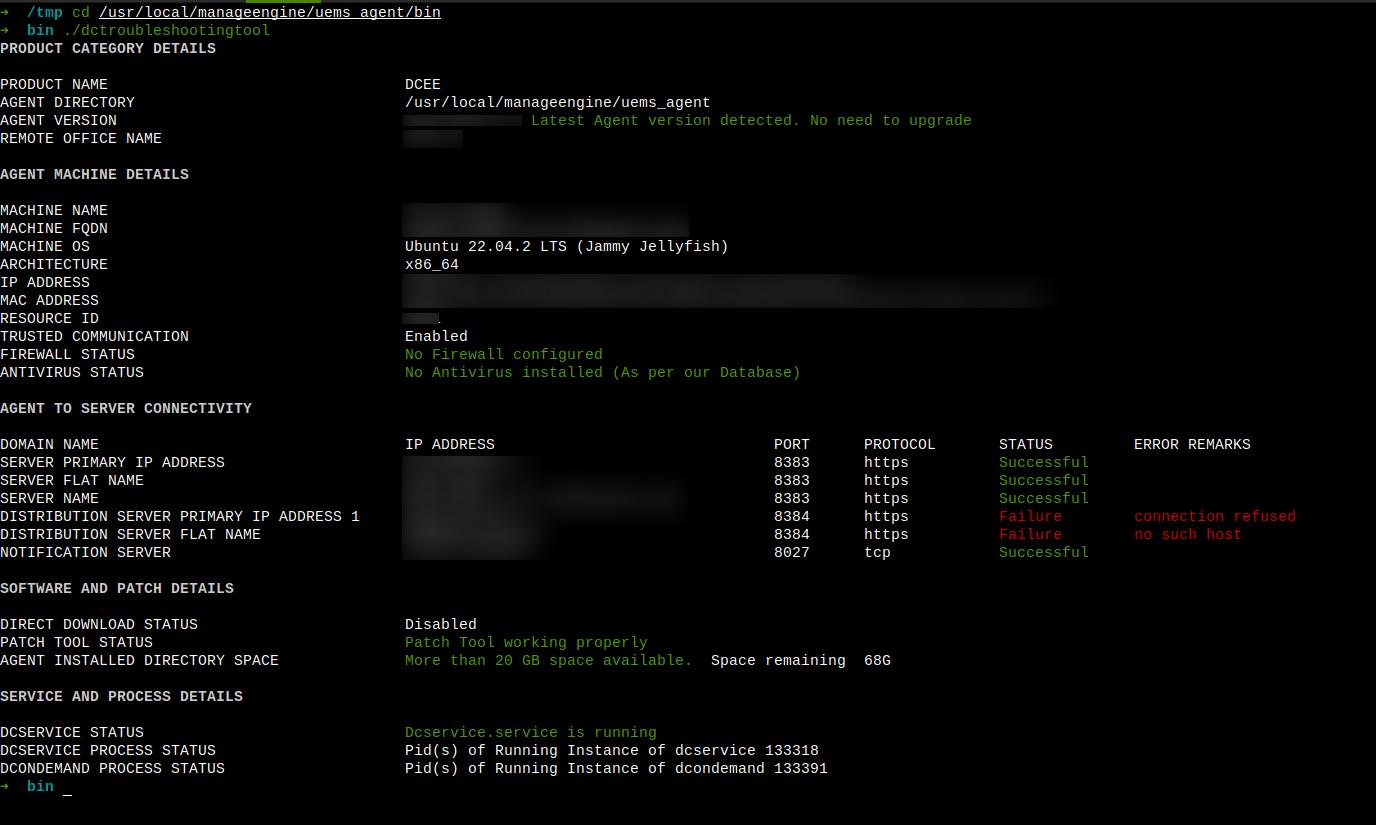
Checks performed by the troubleshooting tool
Product details:
- Product code
- Agent directory path
- Agent version
- Remote Office Name
Agent machine details:
- Machine hostname
- Machine FQDN
- IP address
- MAC address
- Resource ID
- Firewall and antivirus status
Server connectivity details:
- This series of checks shows whether the Central server, Distribution server (If agent is under remote office), On-demand server, Remote control server are reachable from agent or not.
Patch and Software Details:
- The availability of the following is checked
- A supported patch tool (apt/yum/zypper) in the agent machine.
- A minimum agent directory free space of 20 GB in the agent machine. This is a pre-requisite for patching.
Vendor Connectivity: (only for cloud agents)
- For the various OS flavors, the connectivity between the agents and the respective patch vendor is checked.
Service and Process Details:
- Service Status - Checks whether dcservice is active or not.
- Process Status - Running Linux Agent process will be shown with PIDs.
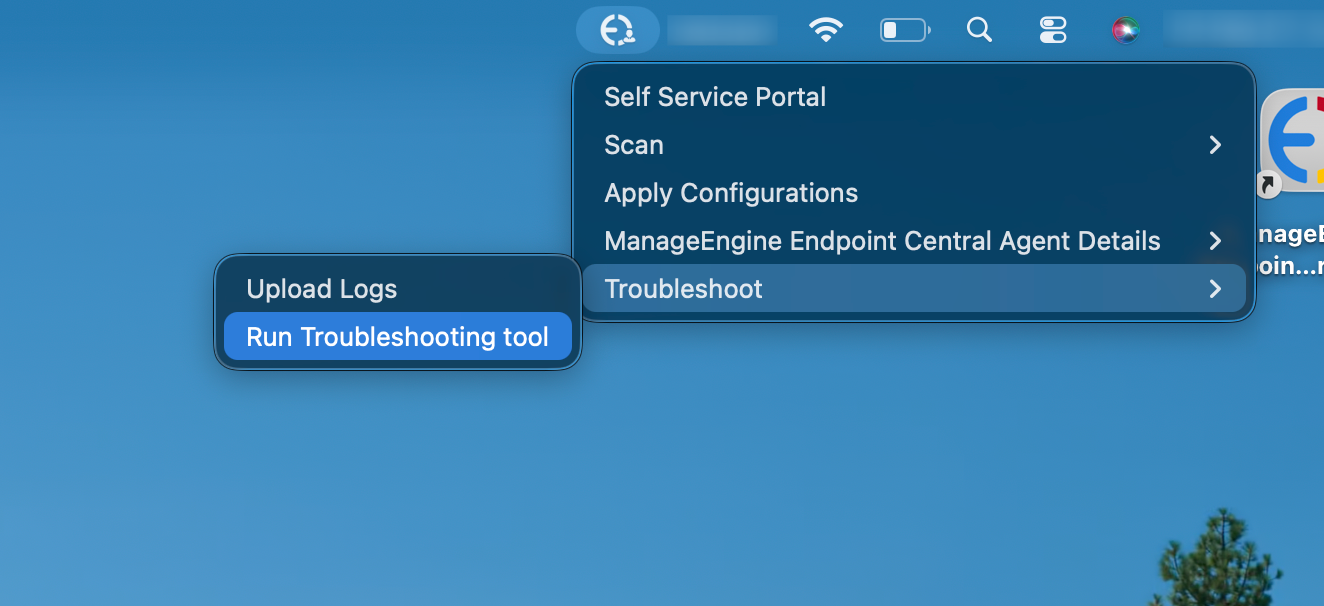
For version 11.4.2544.01.M and above, the troubleshooting tool will be available in the macOS agent.
- Navigate to the agent tray icon in the menu bar and select Tray Icon > Troubleshoot > Run troubleshooting tool.
- Alternatively, open Terminal and run the following command:
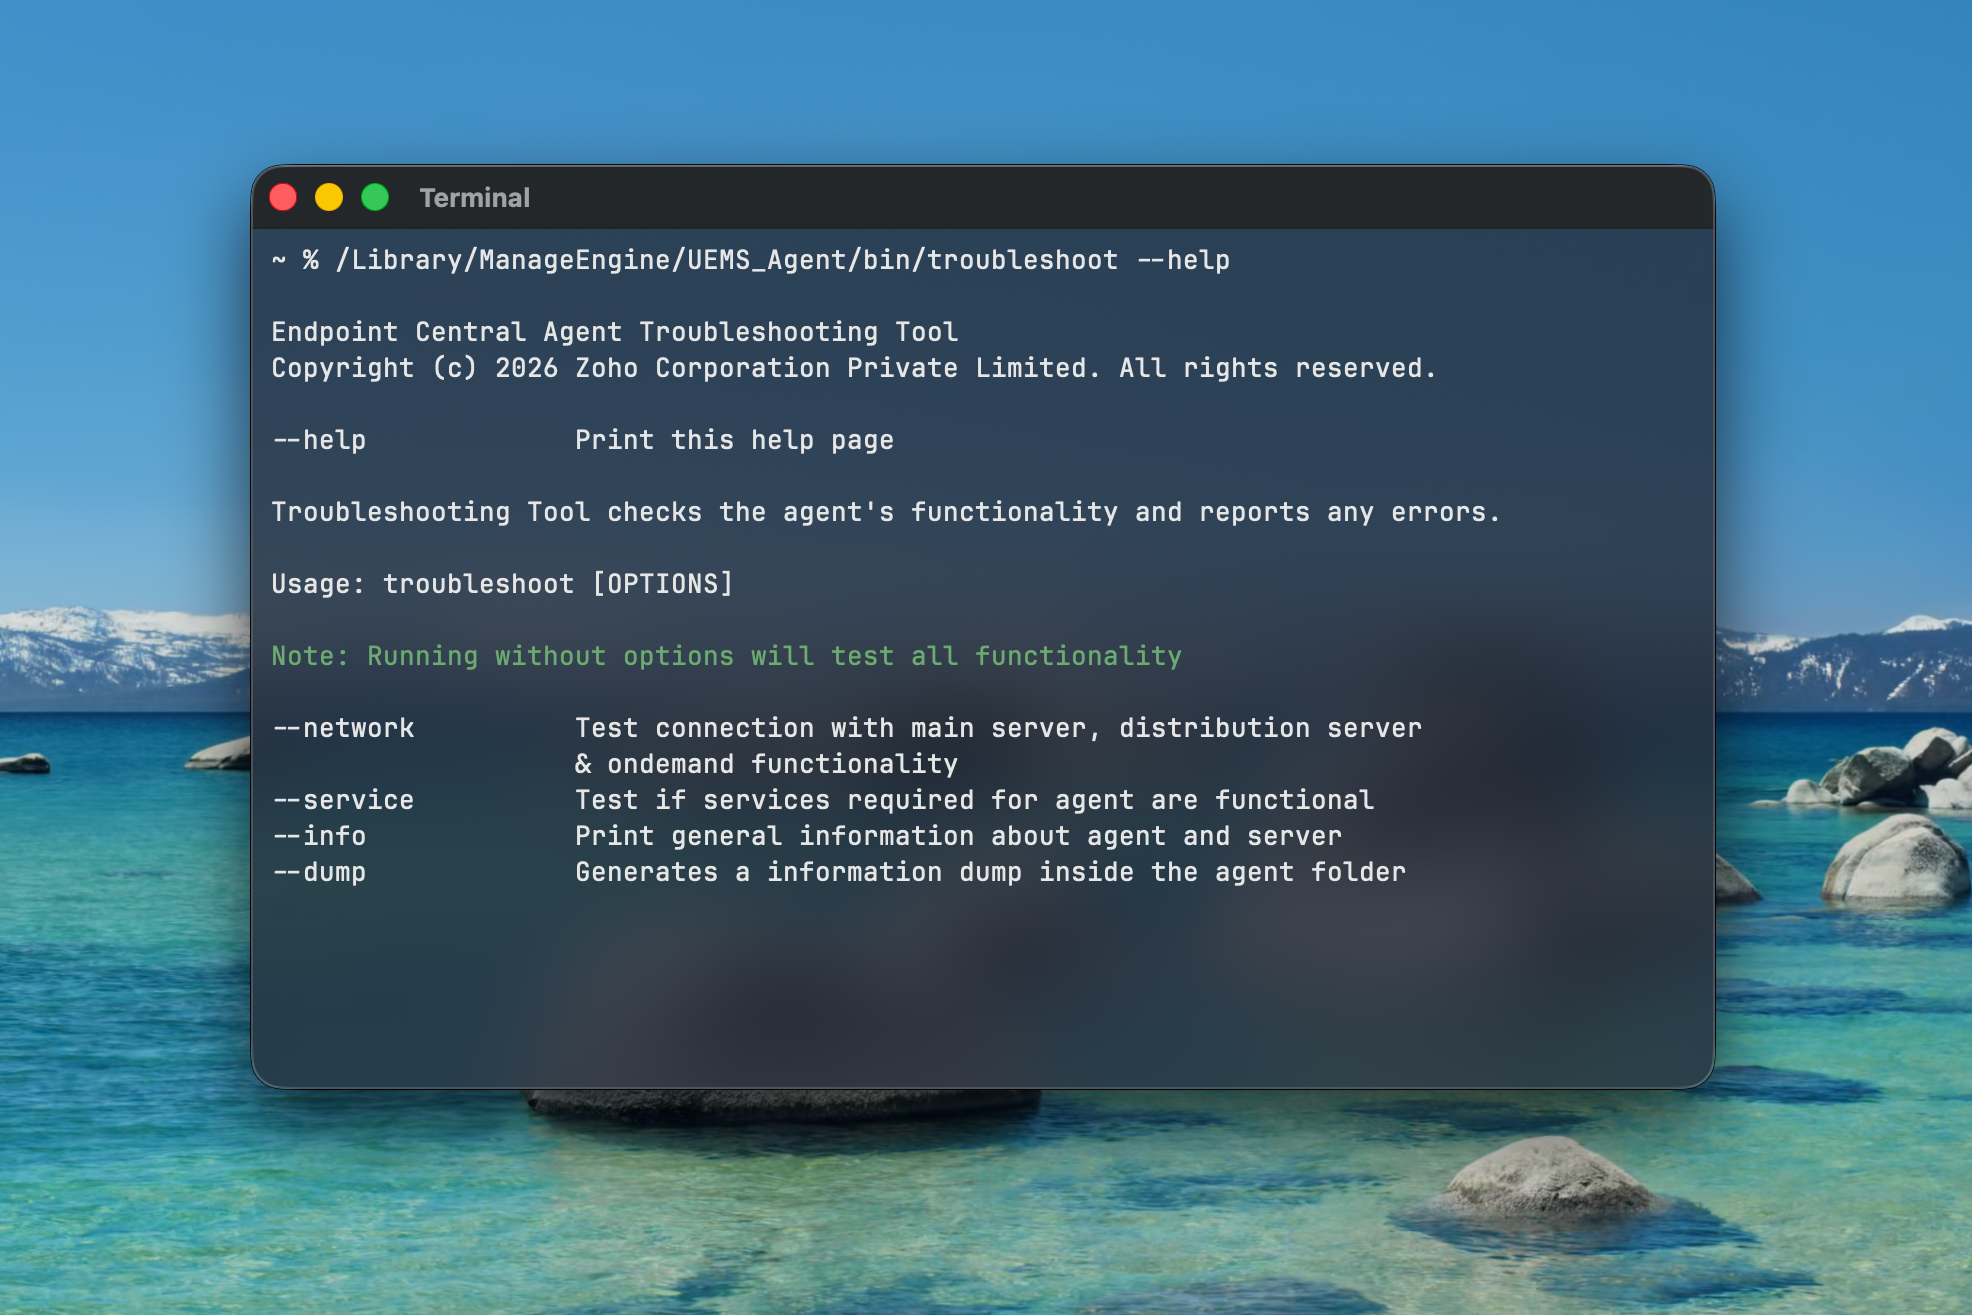
/Library/ManageEngine/UEMS_Agent/bin/troubleshoot - To view the available options, run the command
troubleshoot --helpin Terminal.
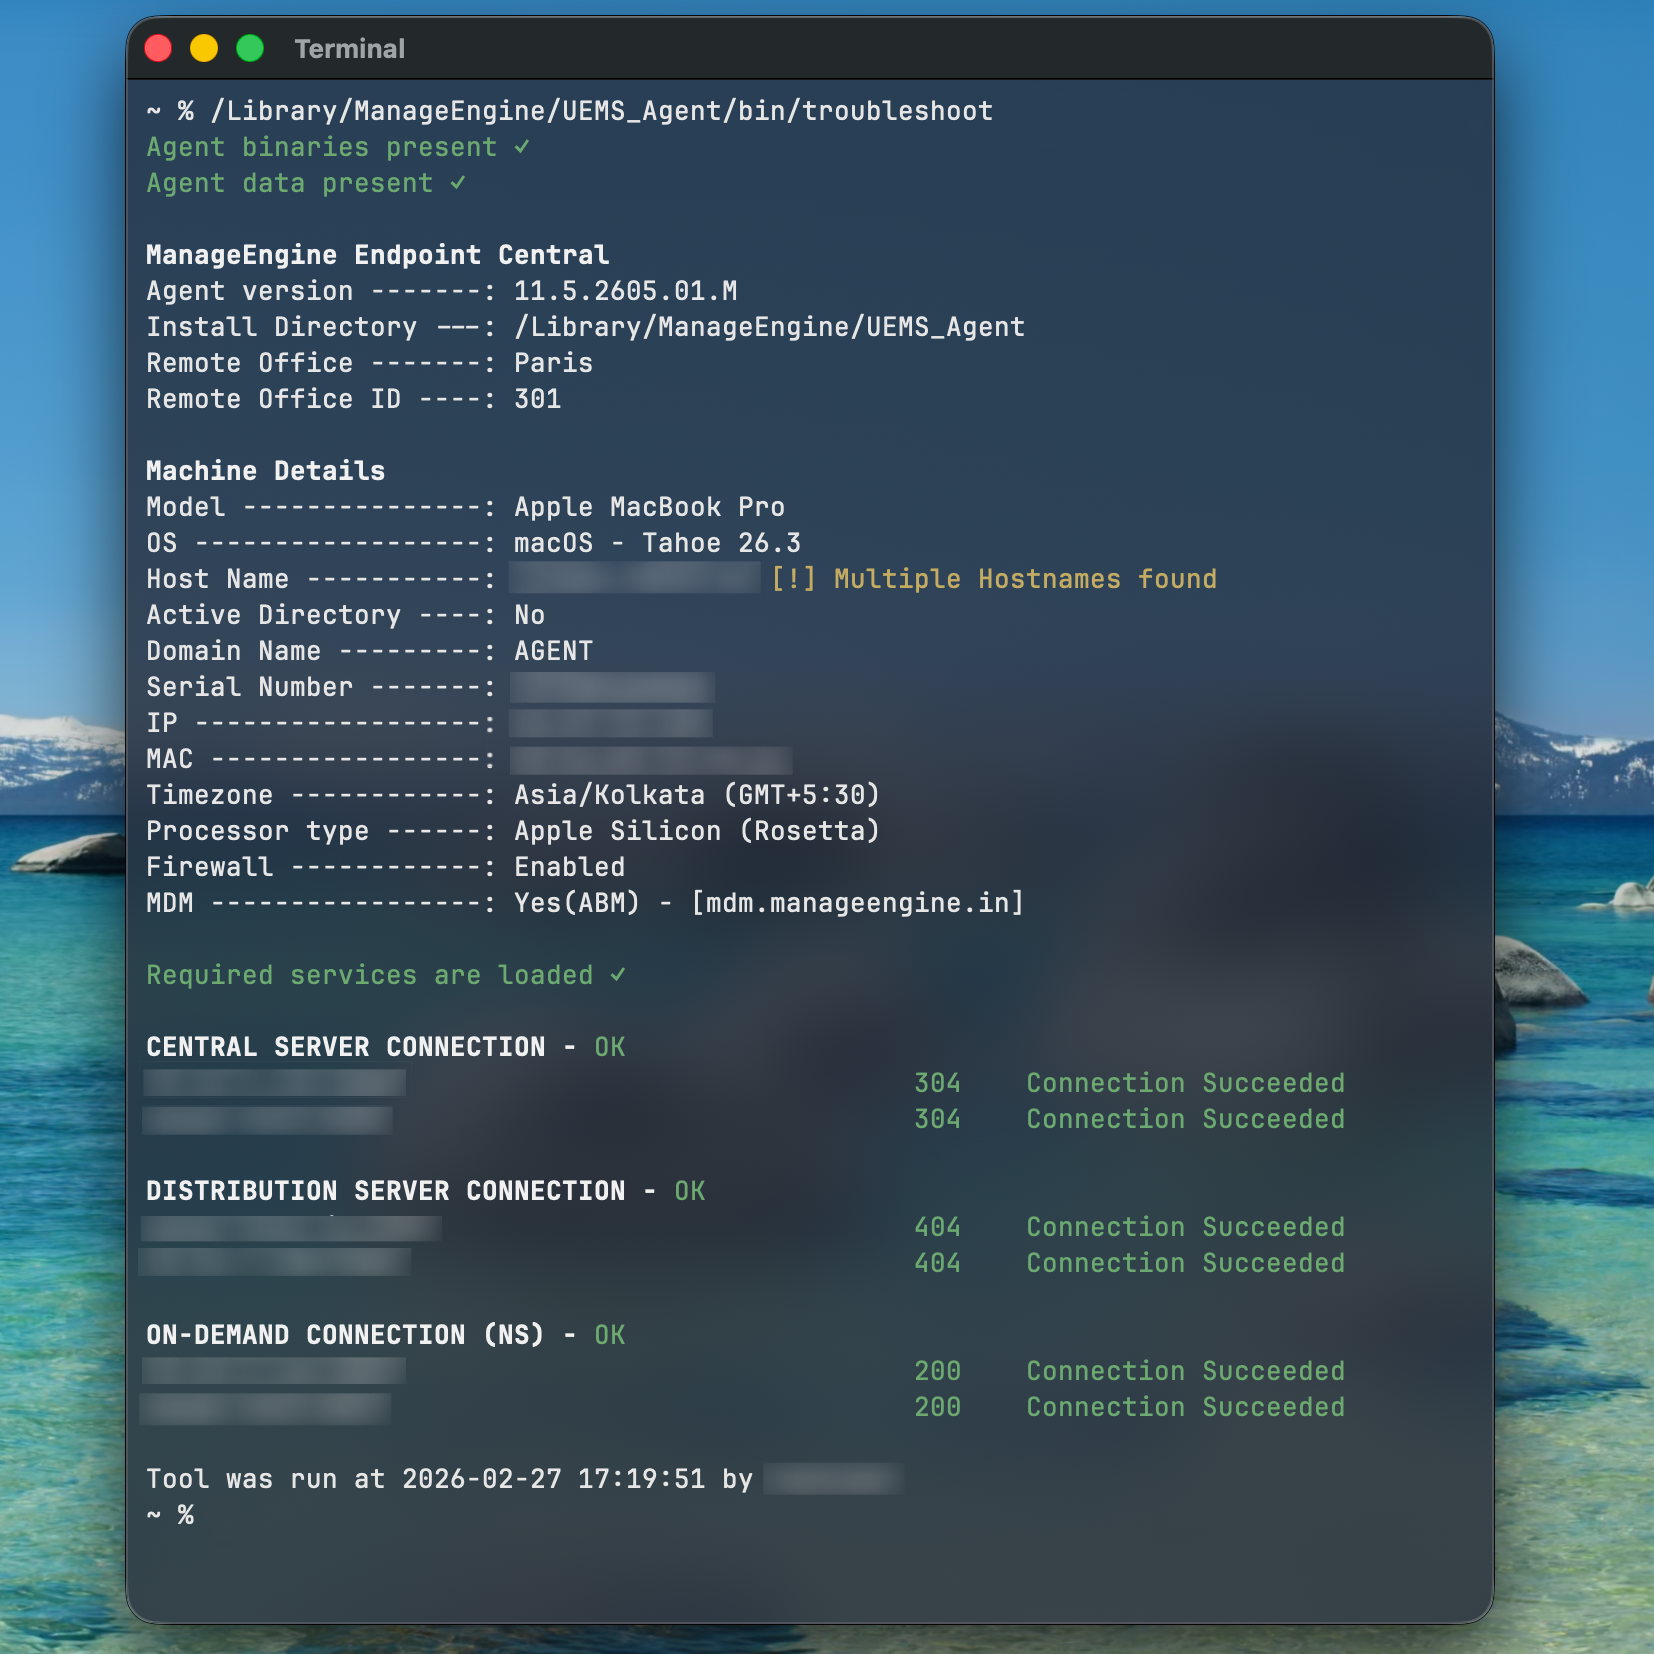
Checks performed by the troubleshooting tool
Server connectivity details:
- Connection status with the main Endpoint Central server
- Connection status with the Distribution Server (if the agent is managed under a remote office with a DS)
- On-demand functionality to verify if the agent can receive and execute on-demand actions from the server
Service and Process Details:
- Checks whether all services required for the agent to function are running properly
- Reports any services that are inactive or have failed
Agent and Server Information:
- Agent version and installation directory
- Server address and communication details
- MDM enrollment status and MDM server address (if the machine is enrolled in MDM)
Additional Troubleshooting Steps:
If you wish to verify the agent-server connection manually, follow the steps given below:
1. Verify Open Ports (Agent-Server & Agent-DS,On demand connectivity)
nc -vz <Server Address> <Server Port>2. Validate Agent-Server Data Transfer
- Launch Endpoint Central Console via Safari browser
- Expected Result: Console loads successfully
- Failure Indicators: Console fails to load or displays connection errors. This might be due to network firewall restrictions or other network level configurations
3. Cloud Agent Domain Connectivity
For Endpoint Central Cloud, ensure that the domains required for agent-server communication are accessible. Refer here for the complete list: Domains required for agent communication