Endpoint Central Cloud integration with Splunk Enterprise
Table of contents
When Endpoint Central is integrated with Splunk, both vulnerability data and audit logs are forwarded to Splunk. This provides administrators with a consolidated view of all detected vulnerabilities and records of actions performed through the console, such as configuration changes, deployments, and administrative activities. Splunk’s analytics can then be used to monitor these events, identify patterns or anomalies, and generate reports and dashboards for auditing, compliance, and security monitoring purposes.
- Currently, only Vulnerability data and Action Log Viewer data from Endpoint Central are posted to Splunk.
- Vulnerability data is applicable only for the Endpoint Central with Security edition or Vulnerability Add-On purchased.
Installing the ManageEngine Endpoint Central add-on in Splunk
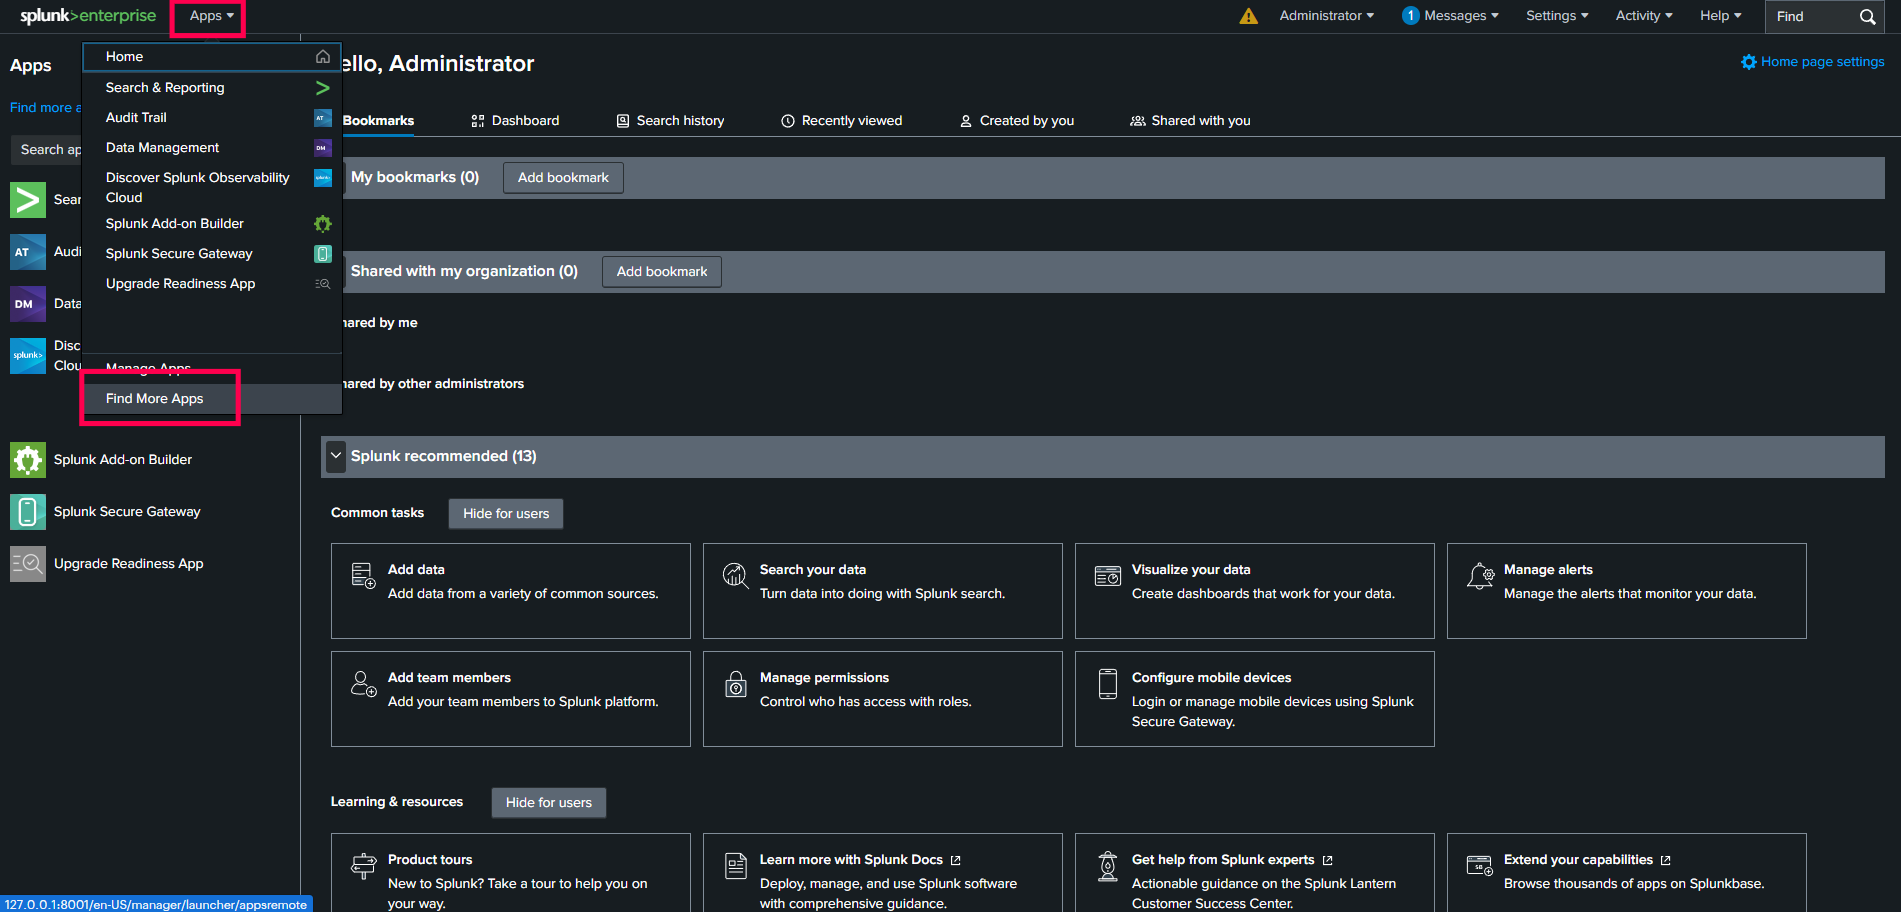
- Navigate to the Splunk Home page.
- In the Header menu, click on Apps.
- Select Find More Apps to be redirected to Splunk's Marketplace.
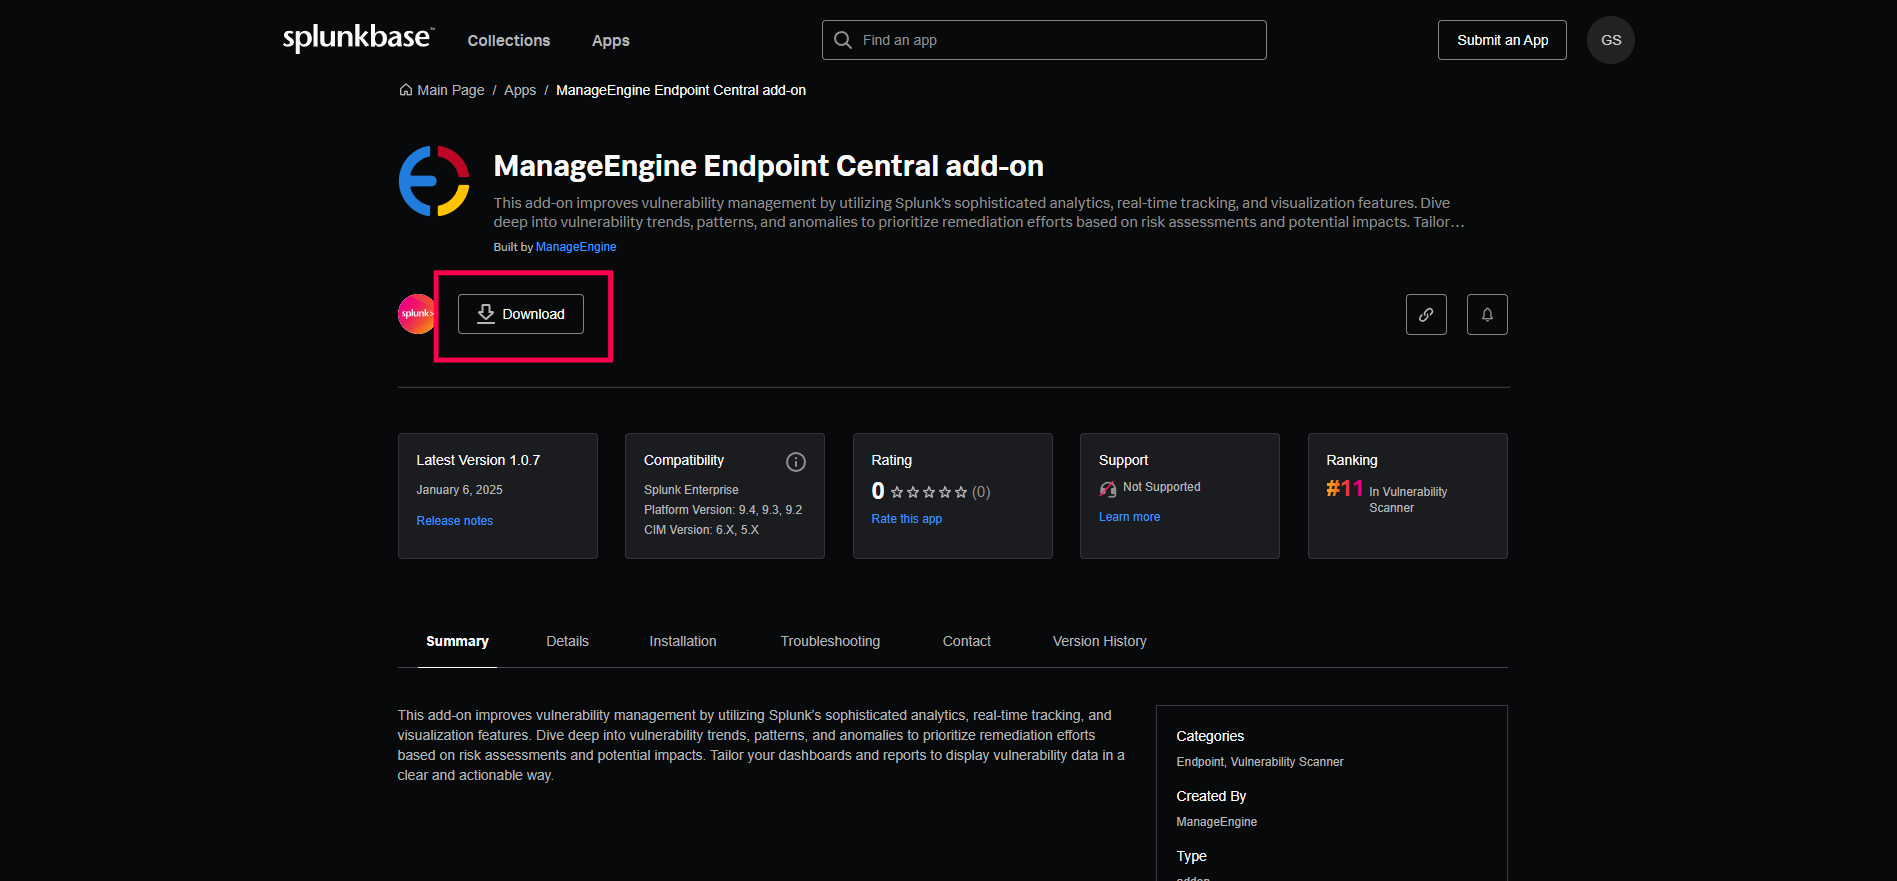
- Search for the ManageEngine Endpoint Central Add-On app.
- Click Download and enter your username and password.
Click Agree and Install. Now you can access the application from the Splunk home page or the Apps menu.
Configuring the app in Splunk for the Endpoint Central
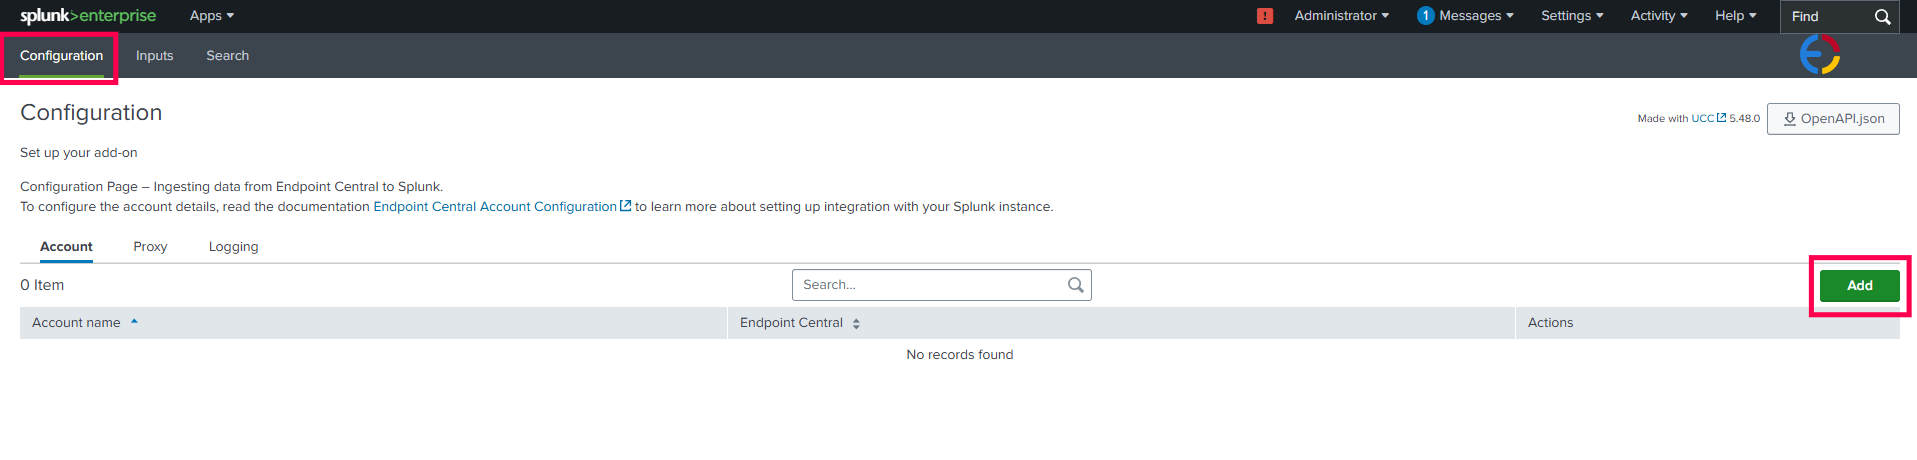
- Navigate to the Splunk homepage and click on the Apps option in the header menu.
- Select the ManageEngine Endpoint Central Add-On app.
Navigate to Configurations and click the Add button.
In the pop-up window, choose Endpoint Central Cloud from the Deployment Type dropdown menu.
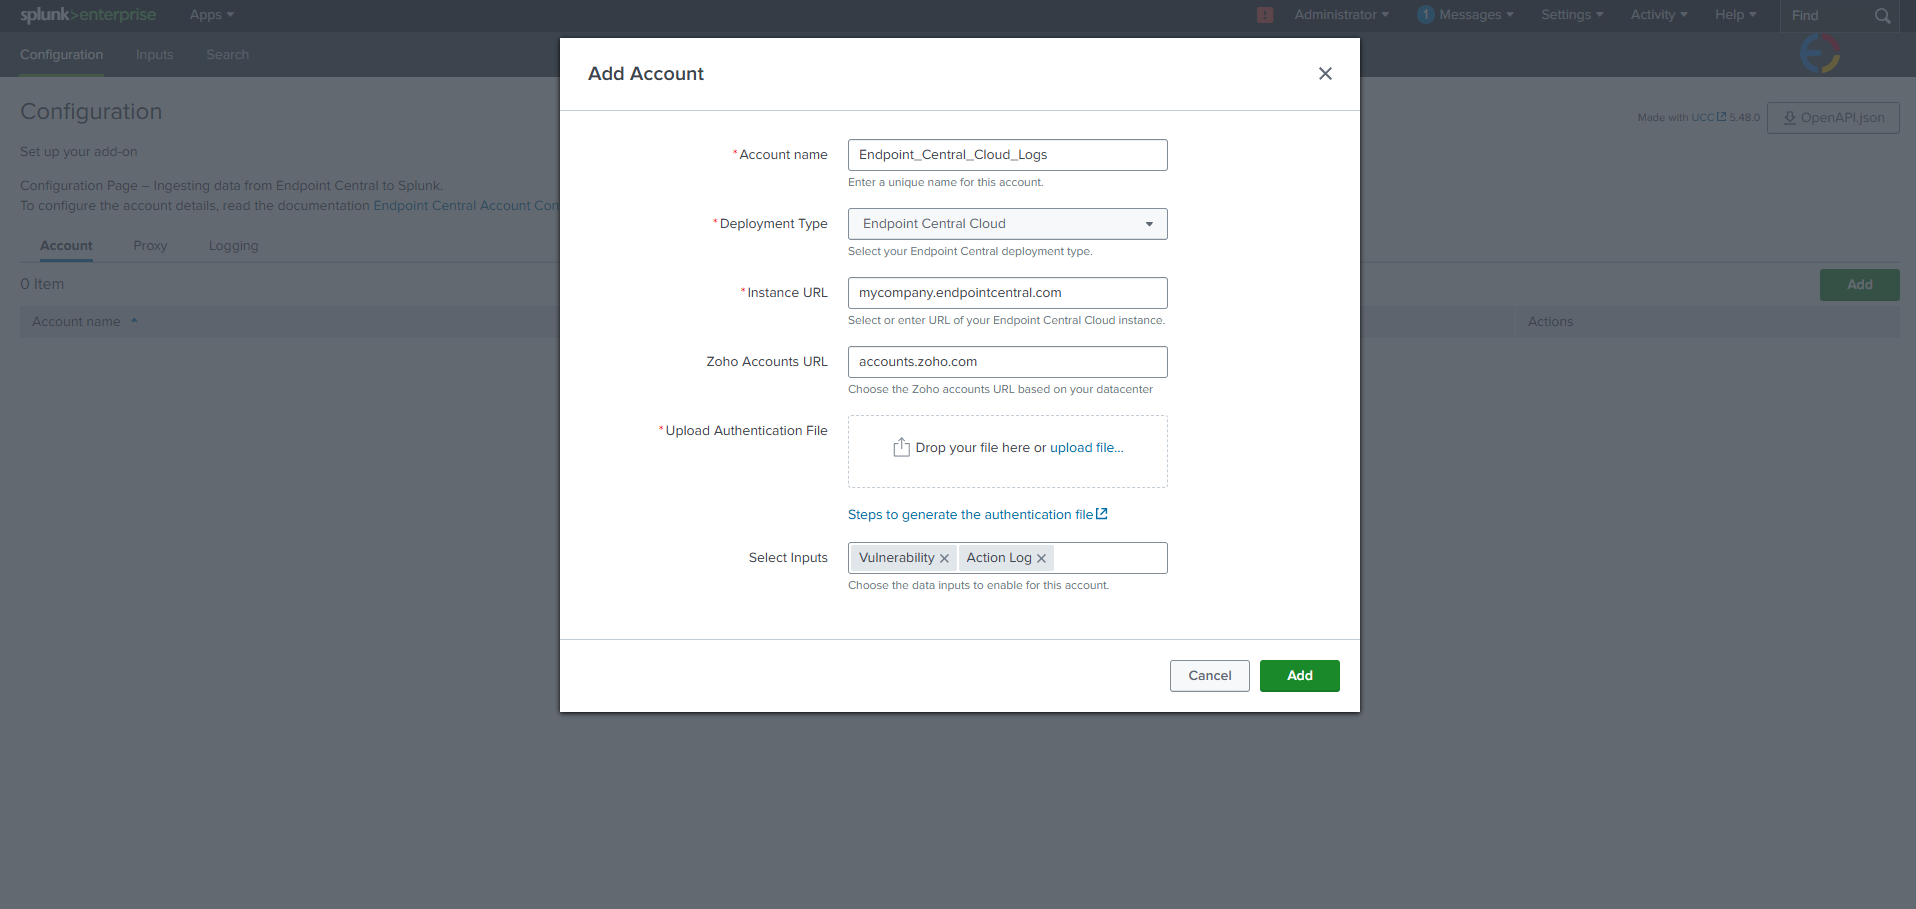
For guidance on the Endpoint Central Instance URL and Zoho Accounts URL, refer to this document. Fill in the appropriate values based on your data center.
NoteThe Zoho Accounts URL is displayed only if a custom domain is configured for your Endpoint Central Cloud instance.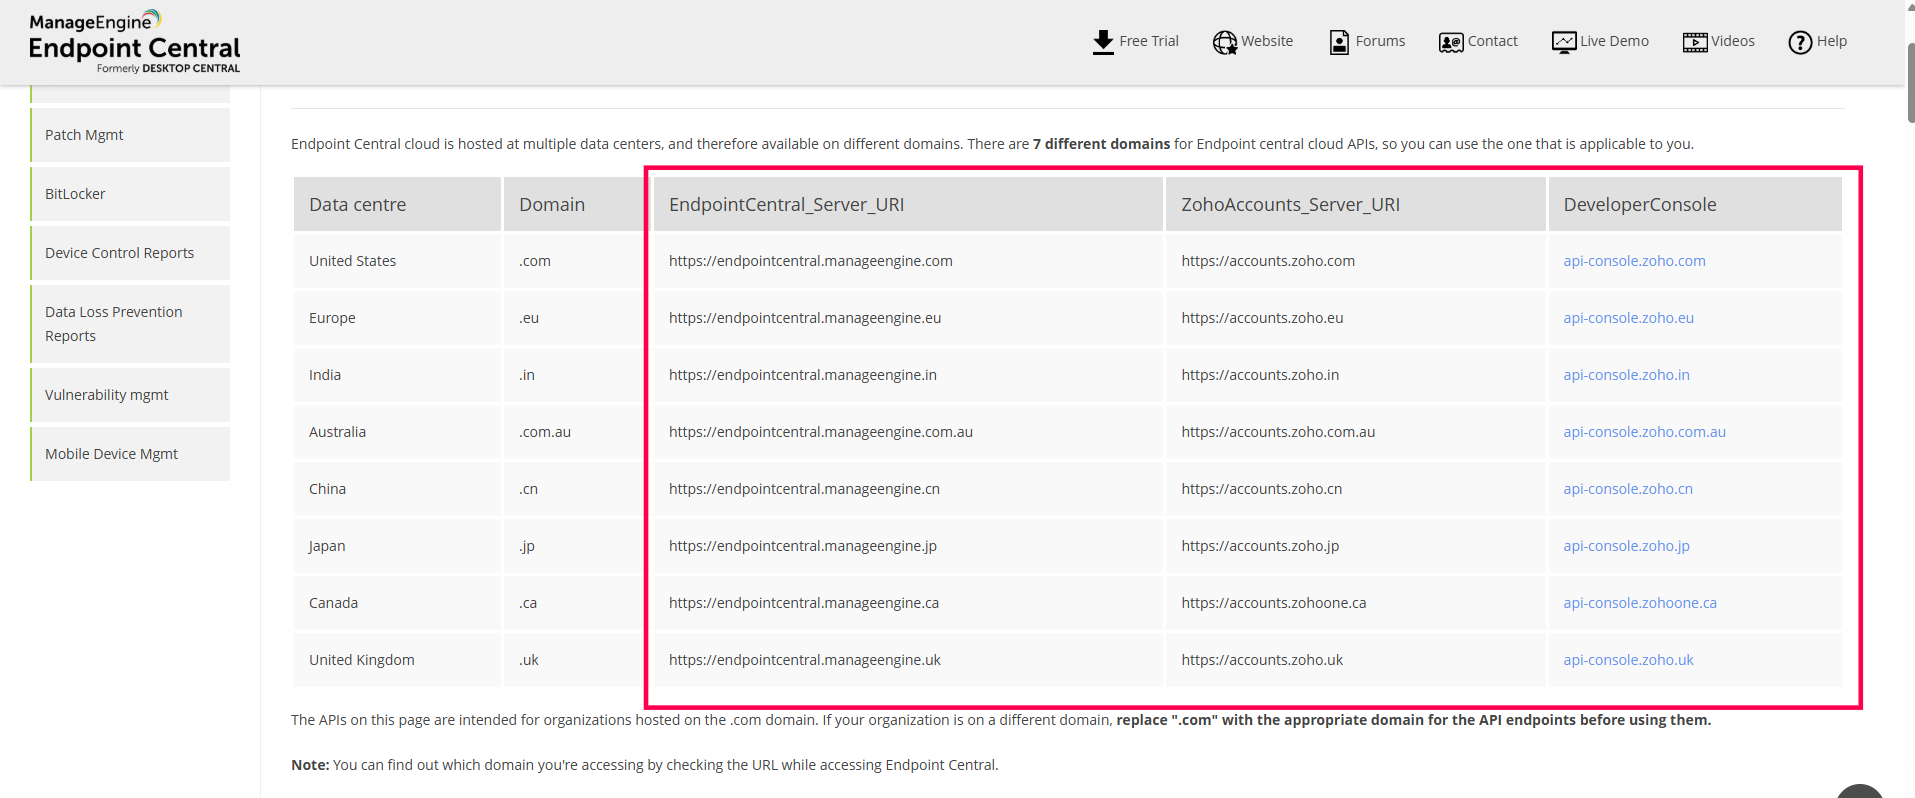
Generating an Authentication File
- To generate the authentication file, open the developer console based on your data center as specified in this document.
- Log in with your Endpoint Central Cloud account.
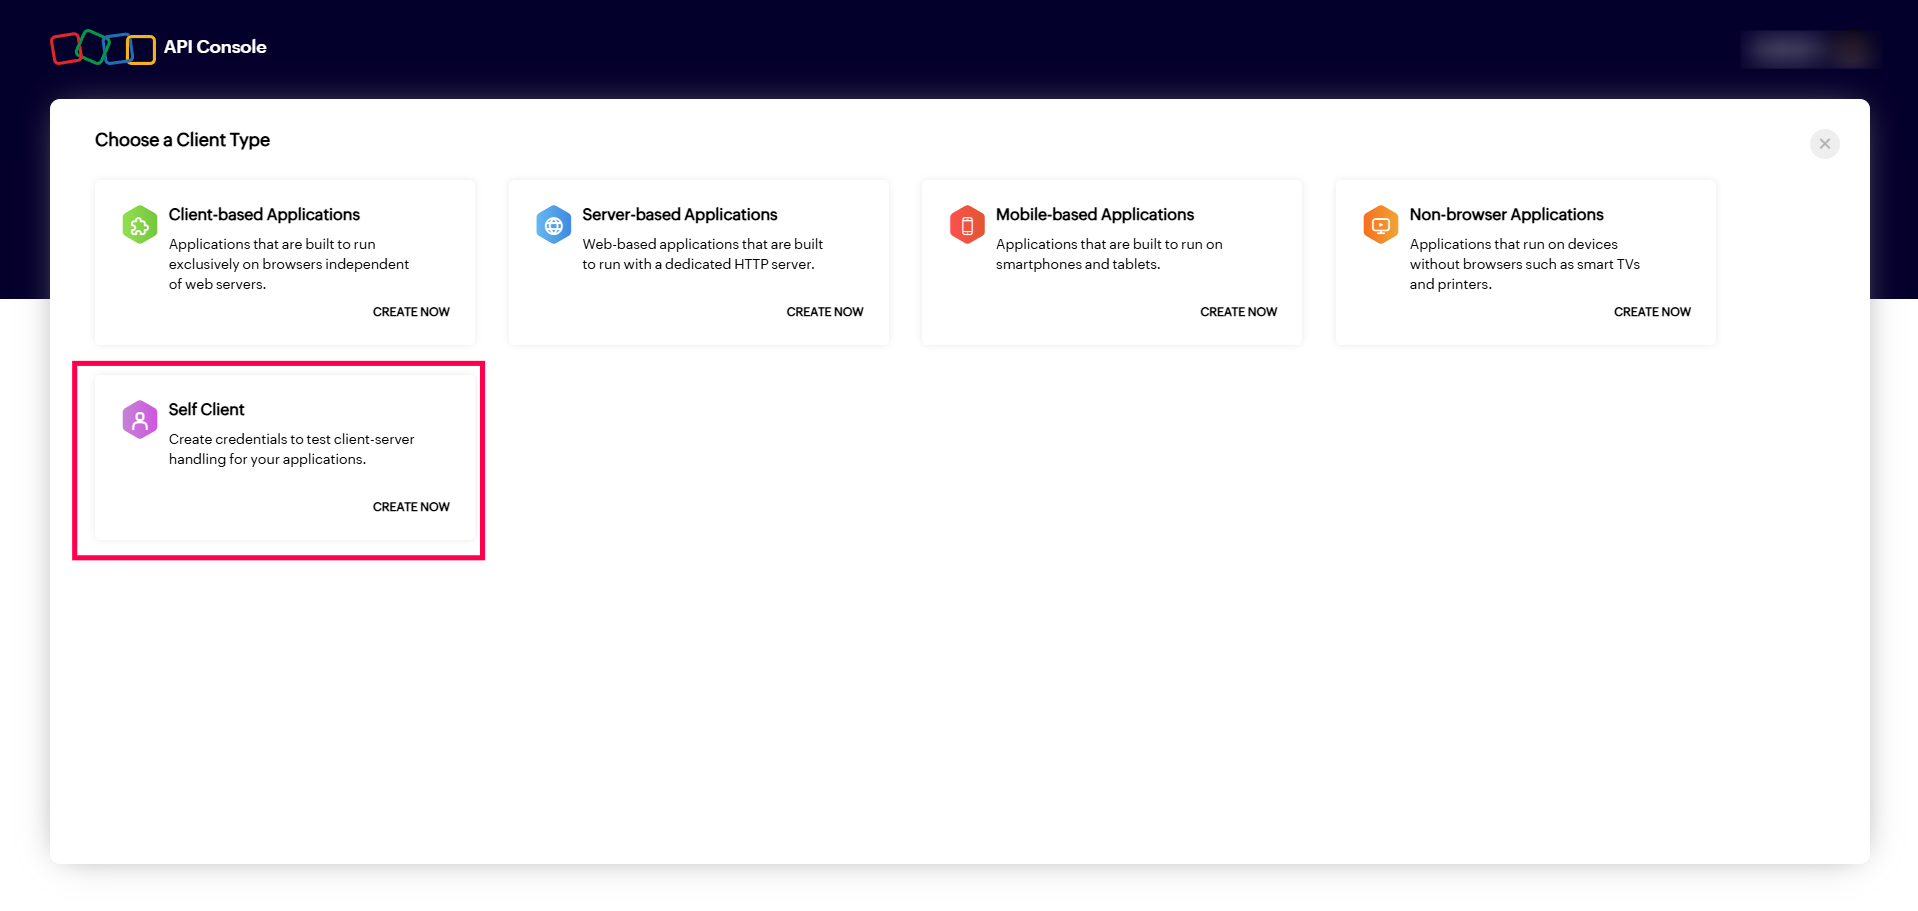
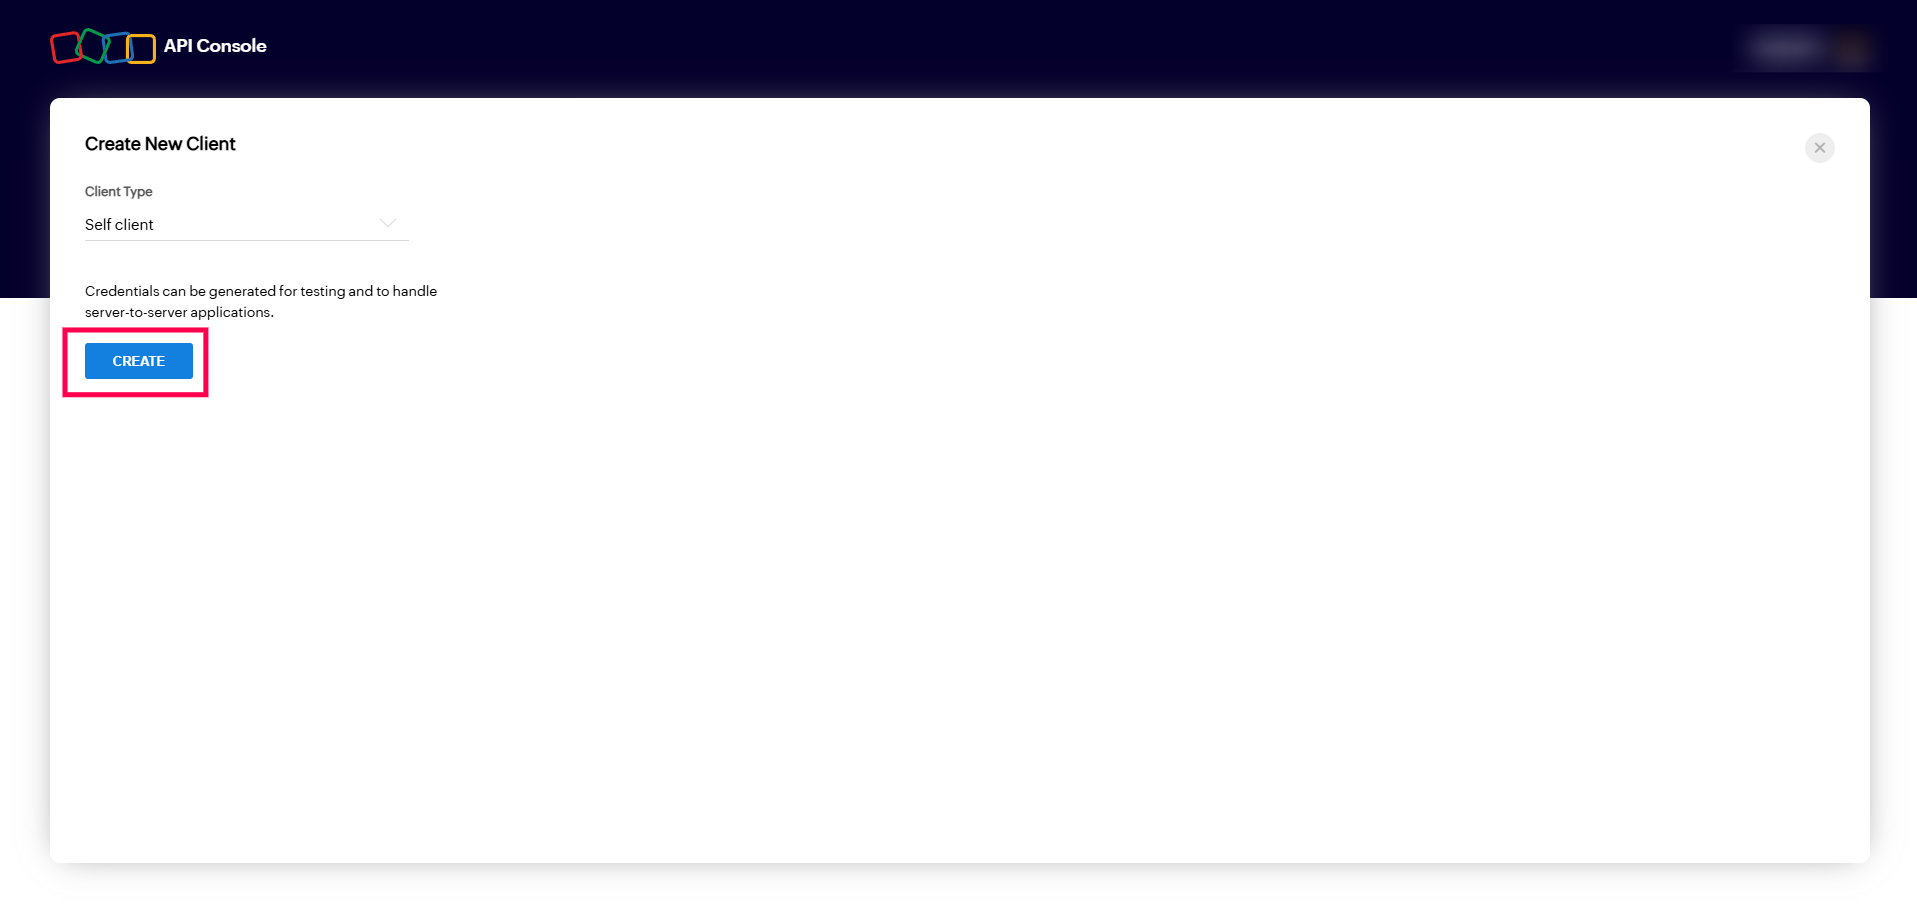
Select Self Client, click on Create Now, and then click Create to enable the self client with confirmation.
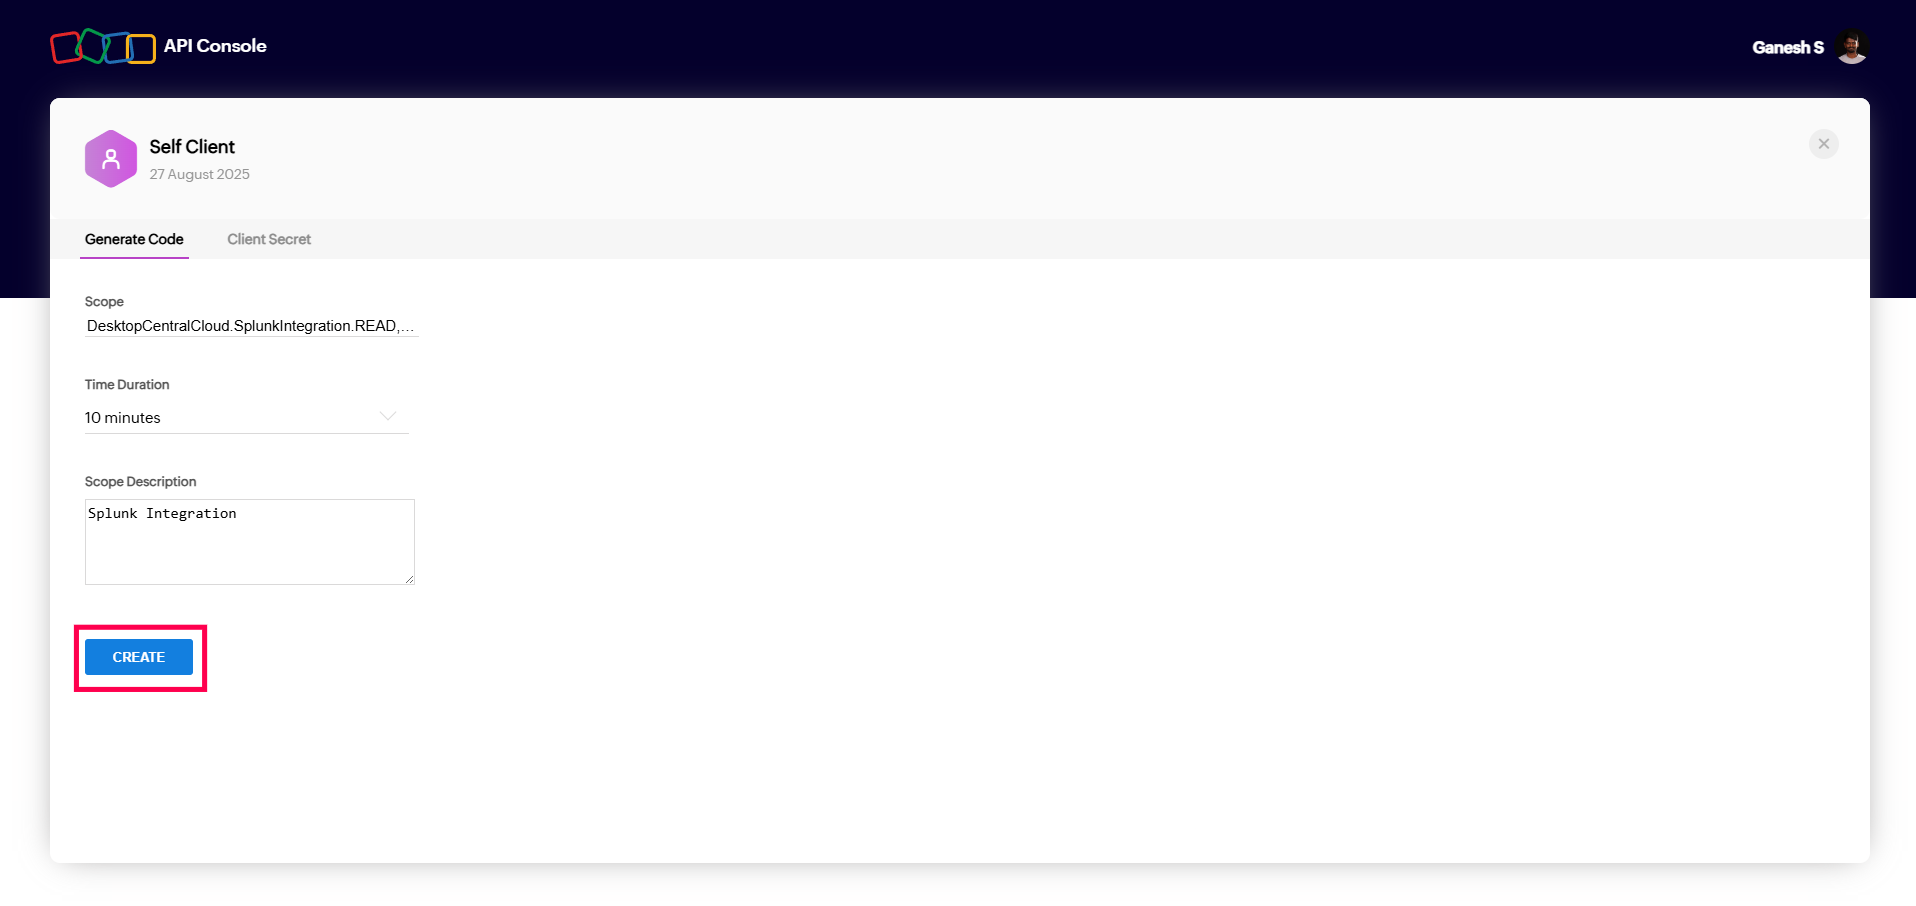
- To generate the Authentication file, click on the Generate Code tab in the API Developer Console.
Copy the below scope and paste it in the Scope section.
DesktopCentralCloud.SplunkIntegration.READ,DesktopCentralCloud.SplunkIntegration.CREATE,DesktopCentralCloud.VulnerabilityMgmt.READ,DesktopCentralCloud.Audit.READCopy
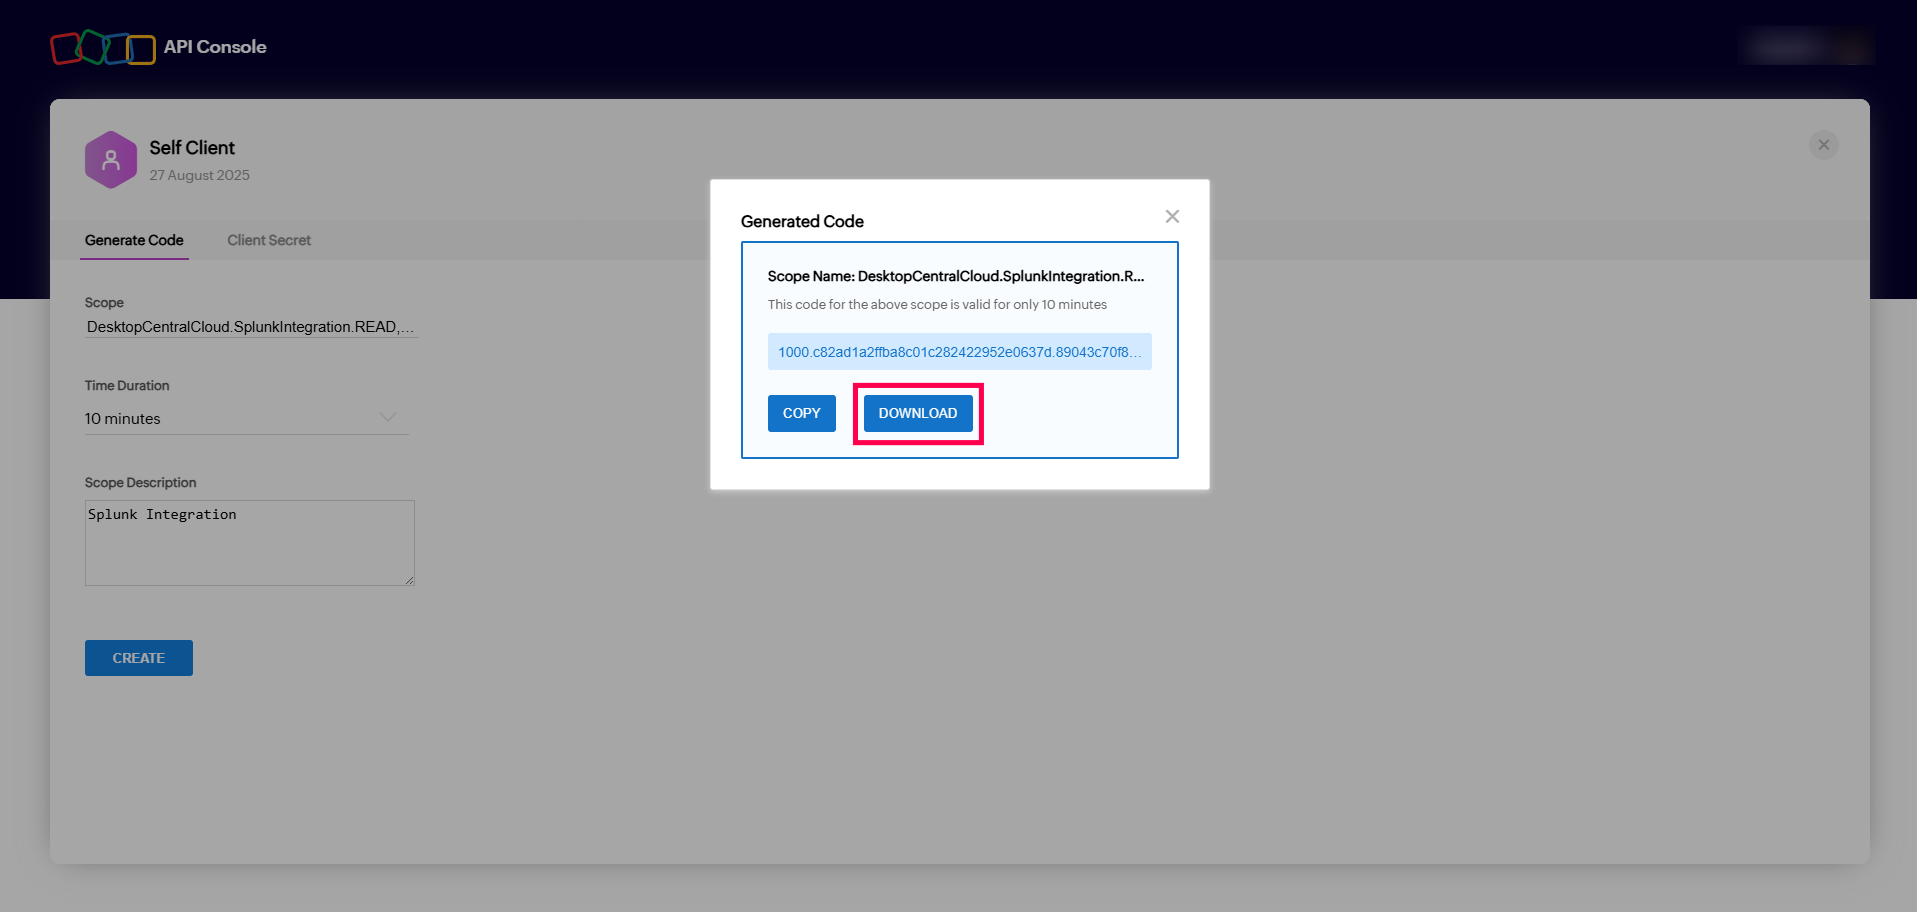
- Set the time duration to 10 minutes, provide a description, and then click the CREATE button to create the authentication file.
Download the file as JSON, upload it in Splunk, and then click Add to complete the configuration.
Creating an input with the Endpoint Central configuration
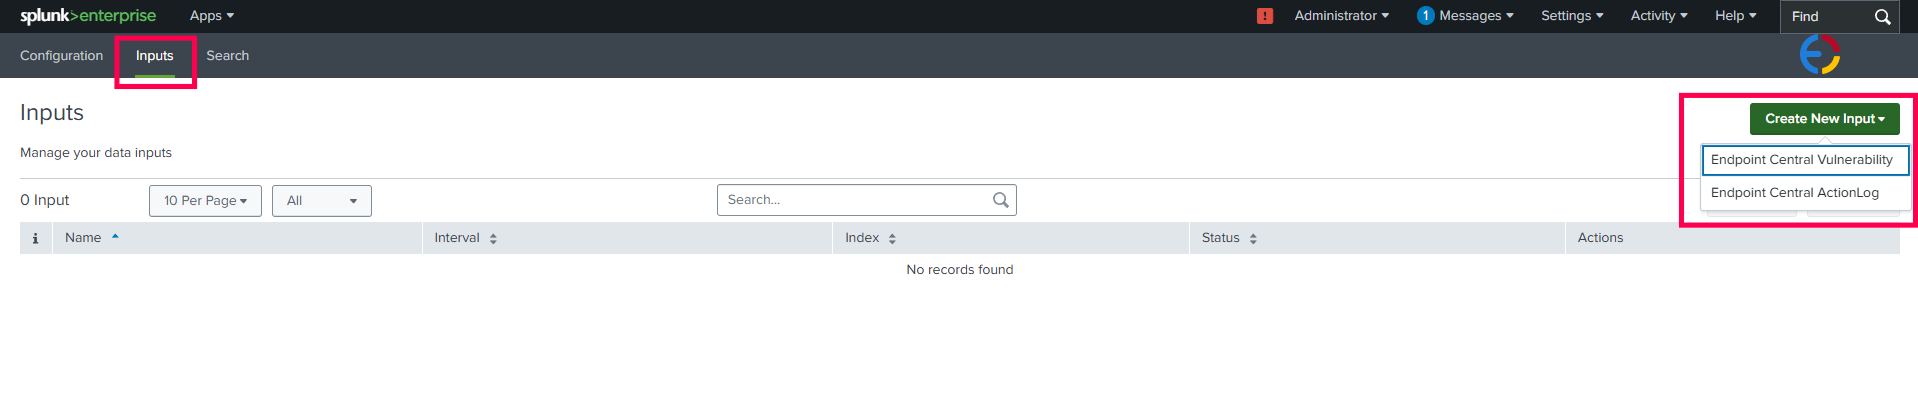
Navigate to the Inputs tab in Splunk, click on the Create New Input, and select the log data that you need from Endpoint Central.
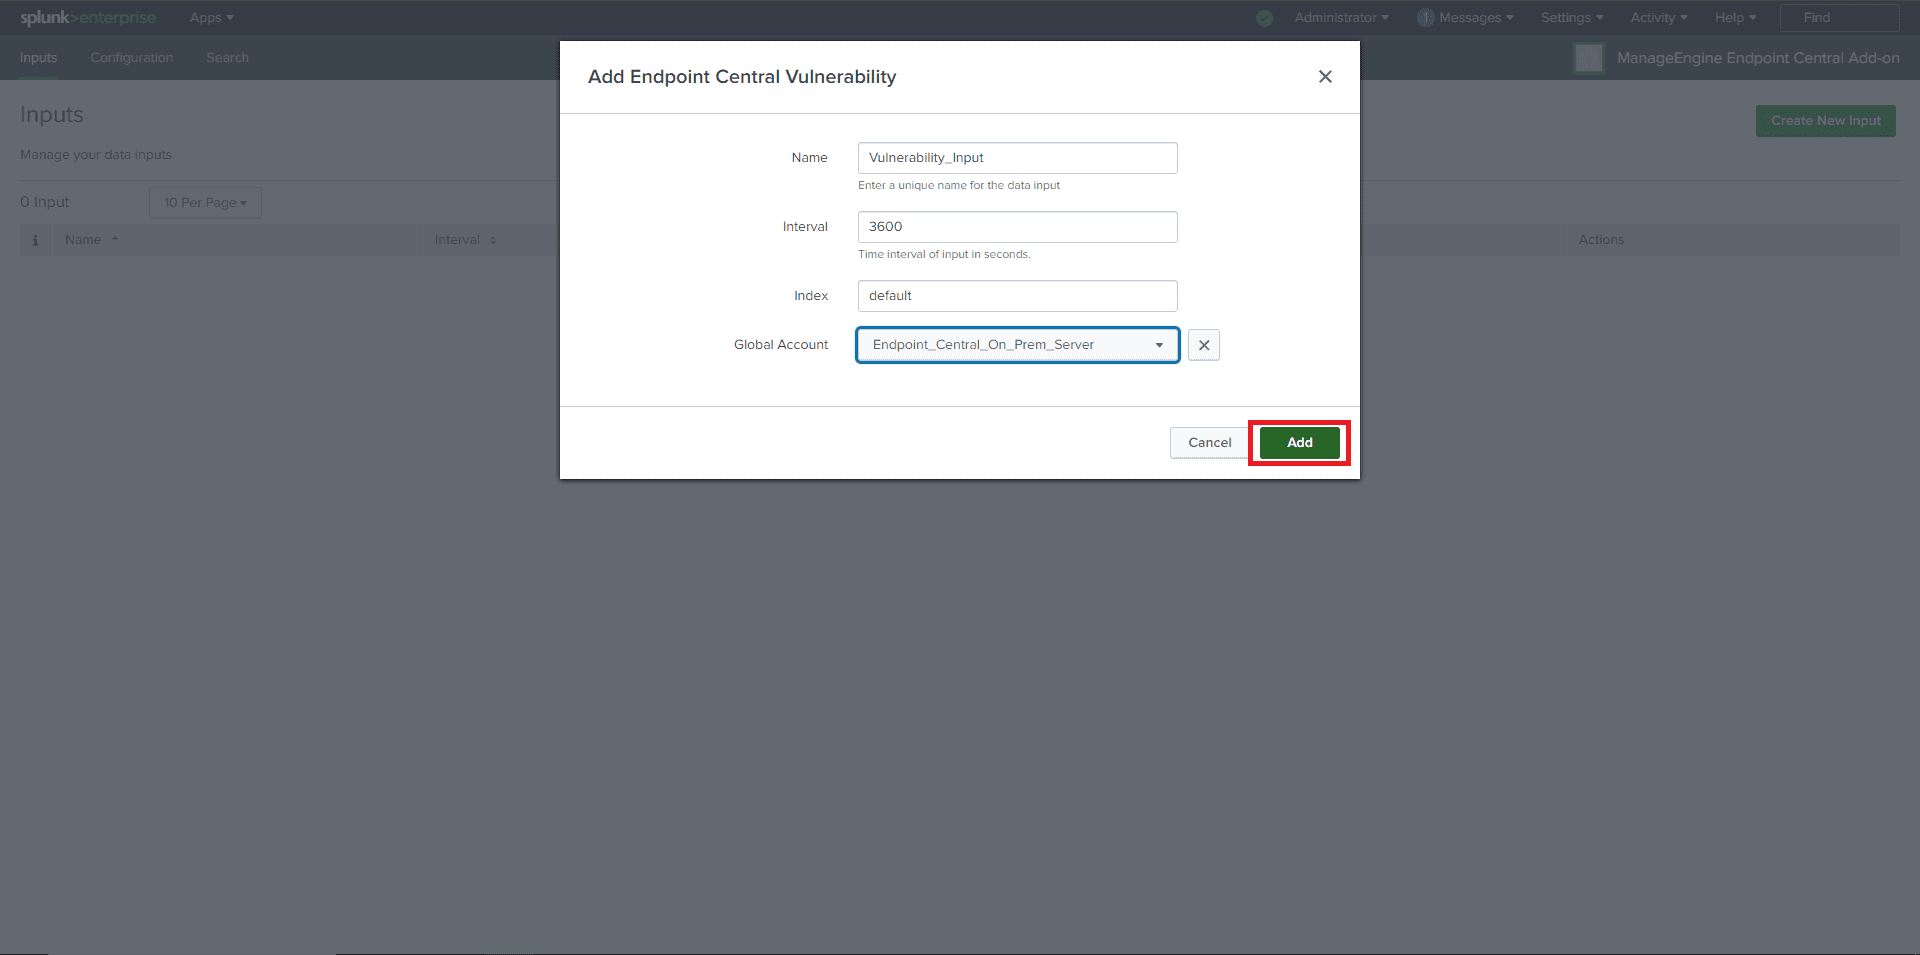
- In the pop-up window, enter all the required information. From the Global Account dropdown, select the Endpoint Central configuration.
Then, click the Add button. If all inputs are valid, the input will be added successfully.
Valid Inputs:
- Name: Unique name without any white spaces.
- Interval: Must be in seconds.
- For Vulnerability data: Between 3600 seconds (1 hour) and 86400 seconds (24 hours).
- For Action log viewer data: Between 300 seconds (5 minutes) and 86400 seconds (24 hours).
- Index: Default.
- Global Account: Endpoint Central configured in the configuration section.
Viewing data in Splunk
- Once an input is configured, synchronization with the Endpoint Central instance will begin.
Navigate to the Search tab in the app.
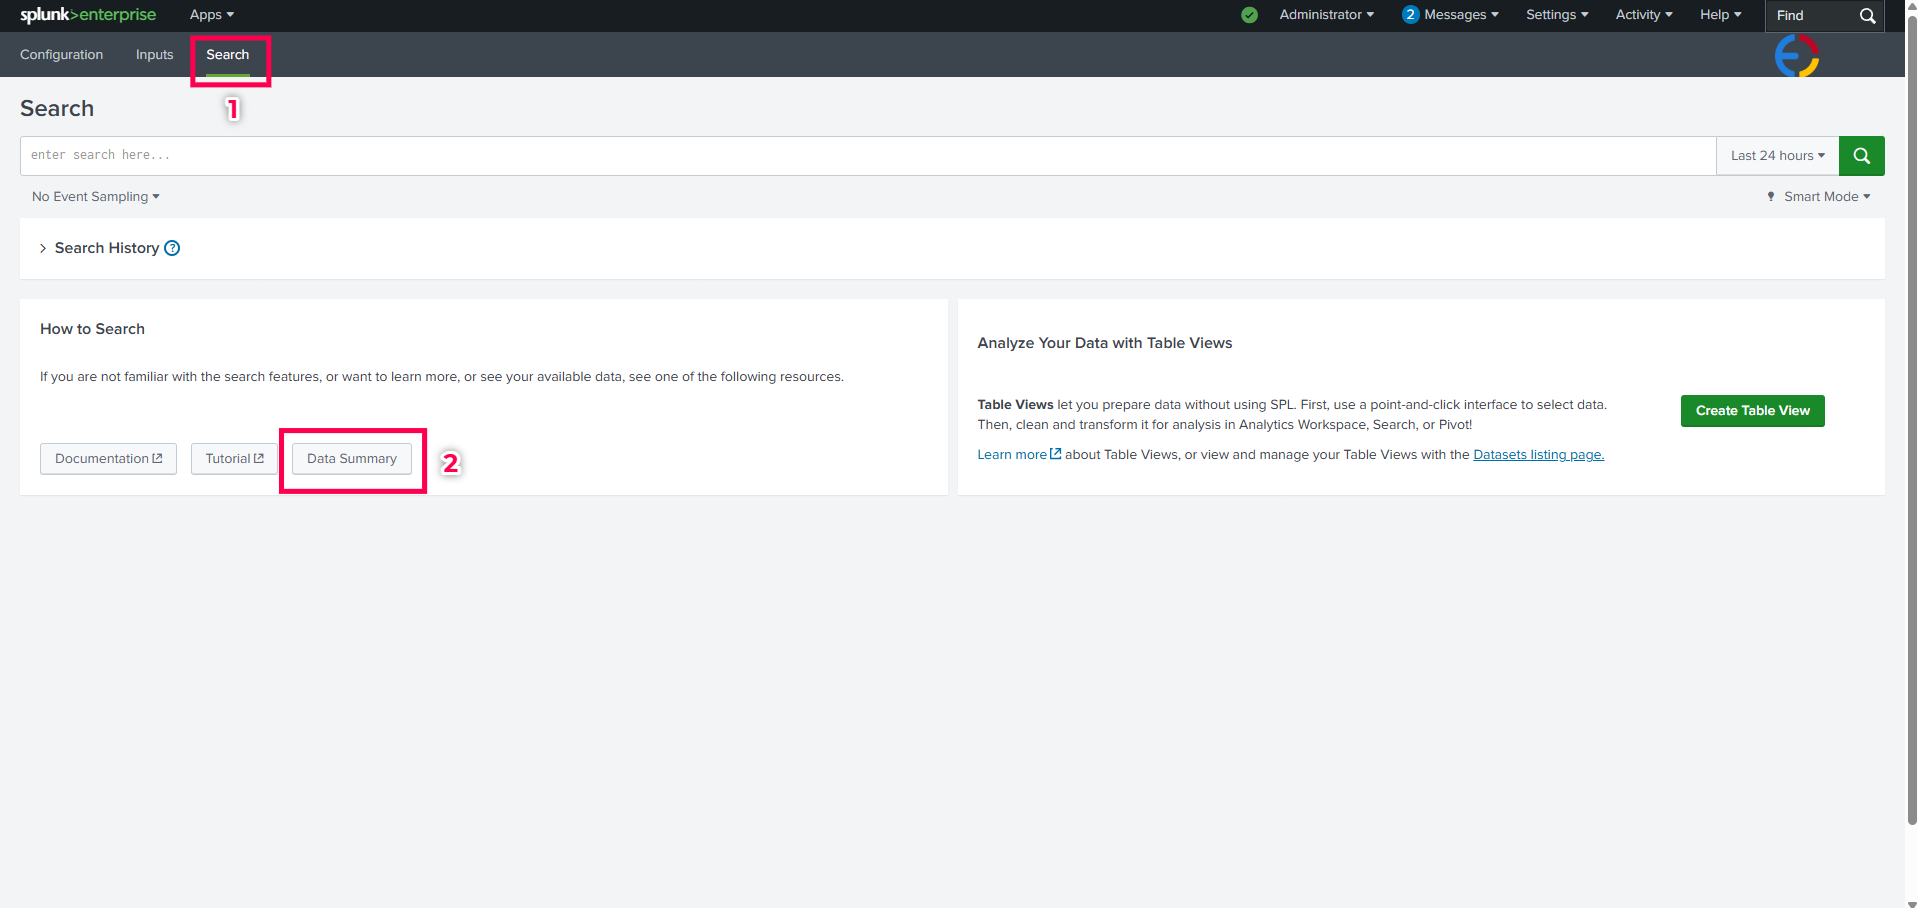
Click on Data Summary and navigate to the Sourcetypes tab.
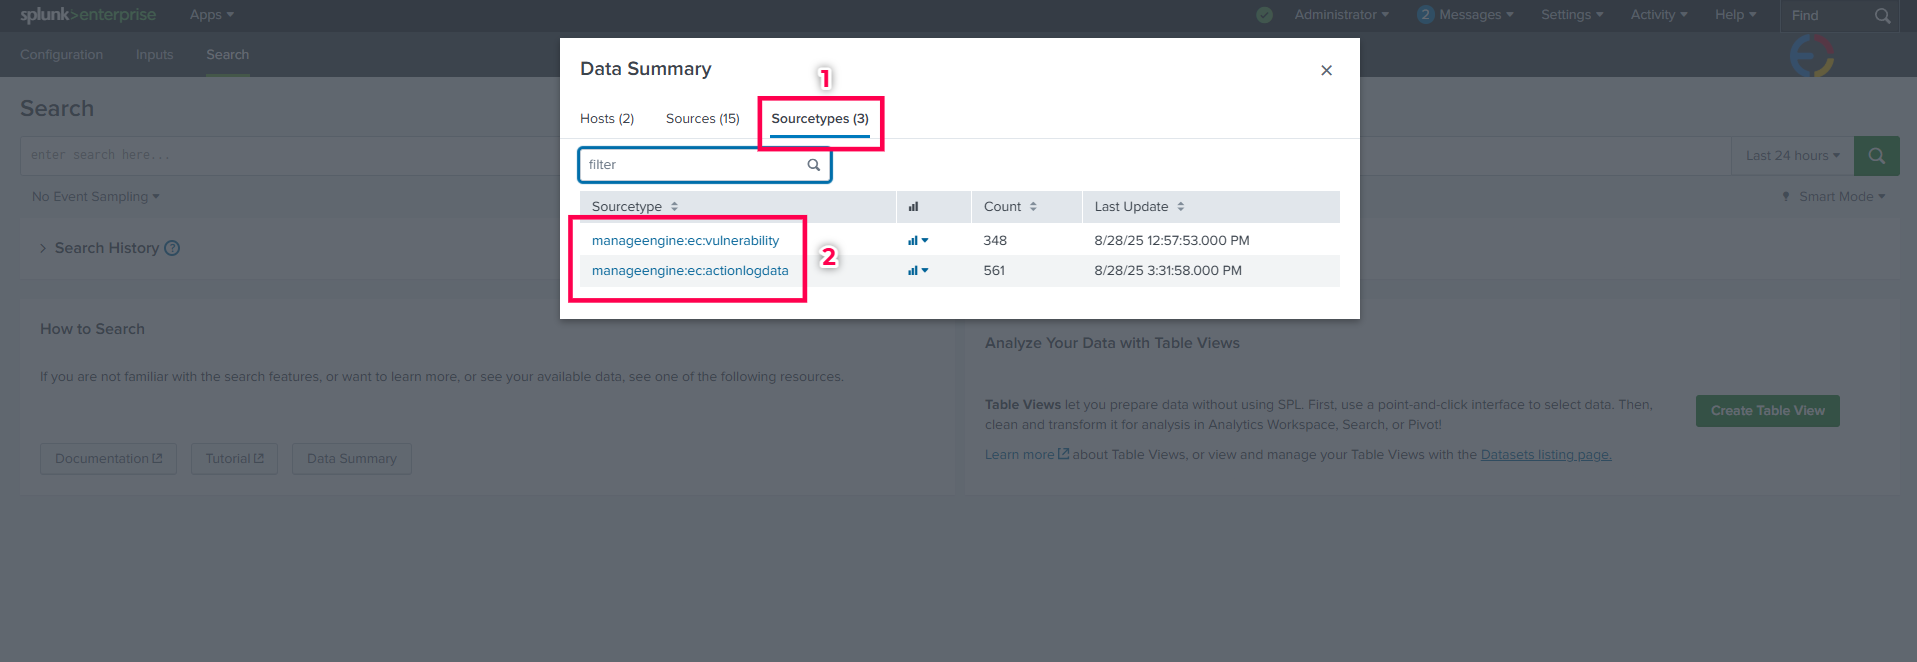
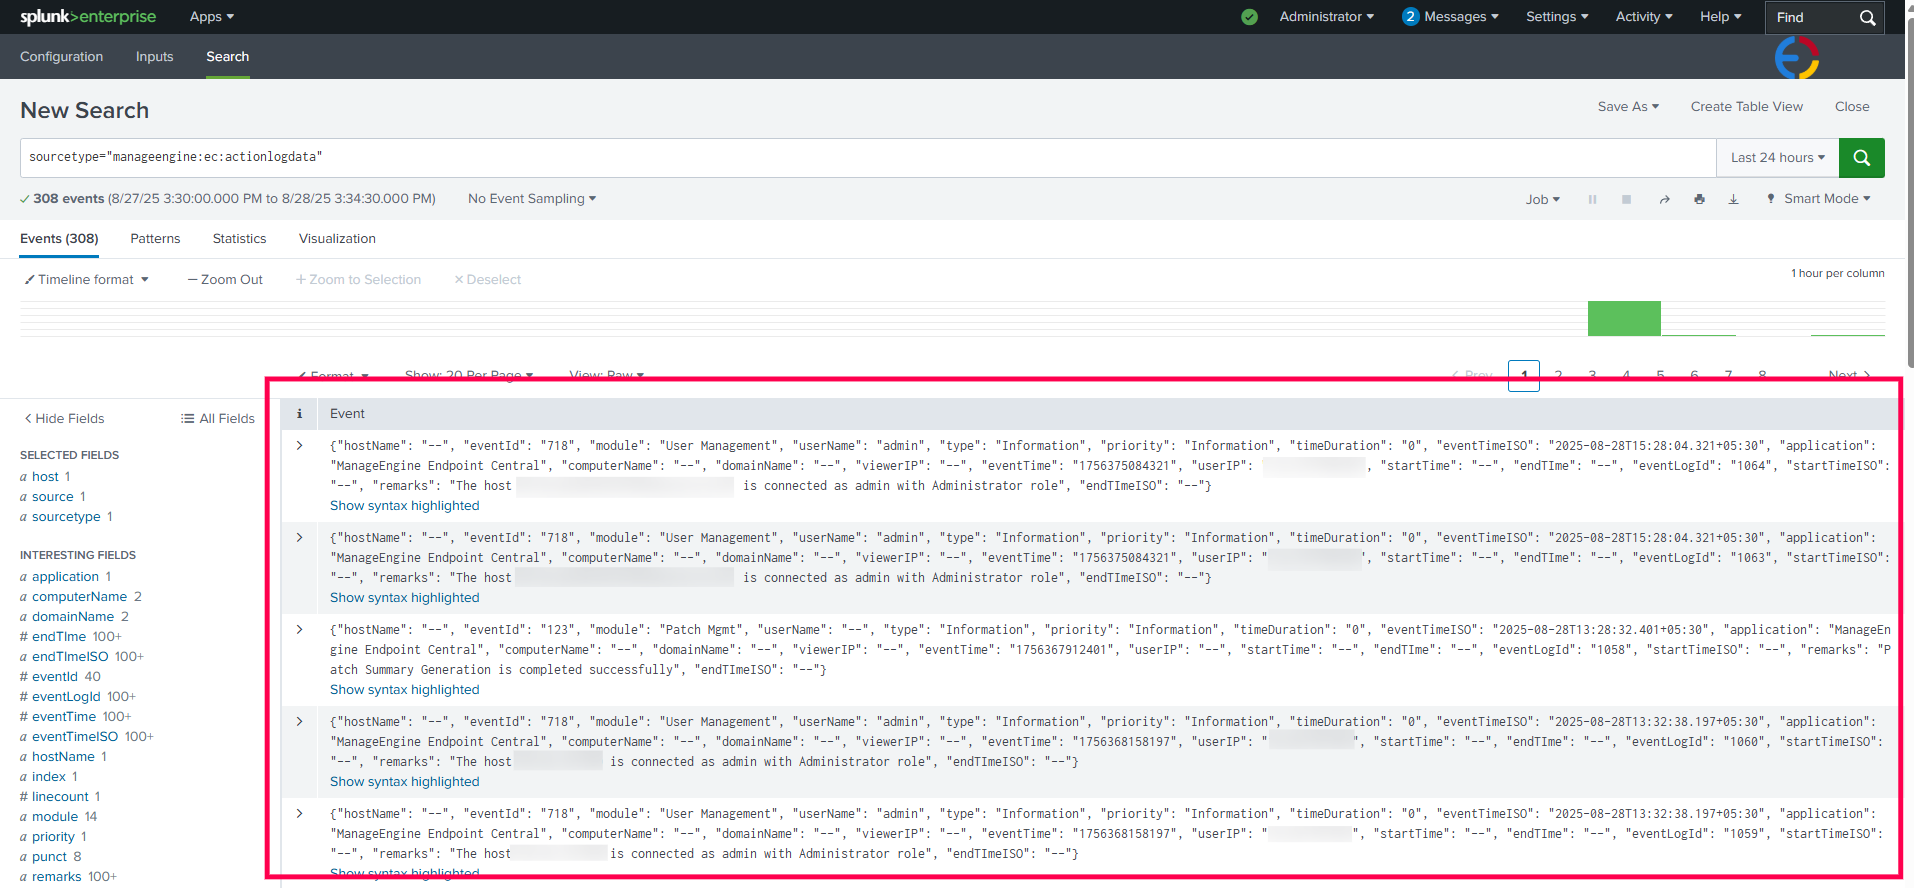
Search for the required Sourcetype from below and click on it to view the data.
- Vulnerability data sourcetype:
manageengine:ec:vulnerability - Action log viewer data sourcetype:
manageengine:ec:actionlogdata
- Vulnerability data sourcetype: