Trusted By Over 5000+ Businesses
Why monitor network hardware?
A hardware monitor tool is like a digital assistant for your devices' physical components. It oversees various parts, such as the power supply, battery, fans, and others, collecting data from tiny sensors embedded in them. These sensors detect metrics like temperature and voltage. Server hardware monitoring software processes this information and presents it in a way that helps you understand the physical health of your server. It’s like having a personal detective that monitors your network hardware health and alerts you if anything seems off.
OpManager: A potent hardware monitoring solution
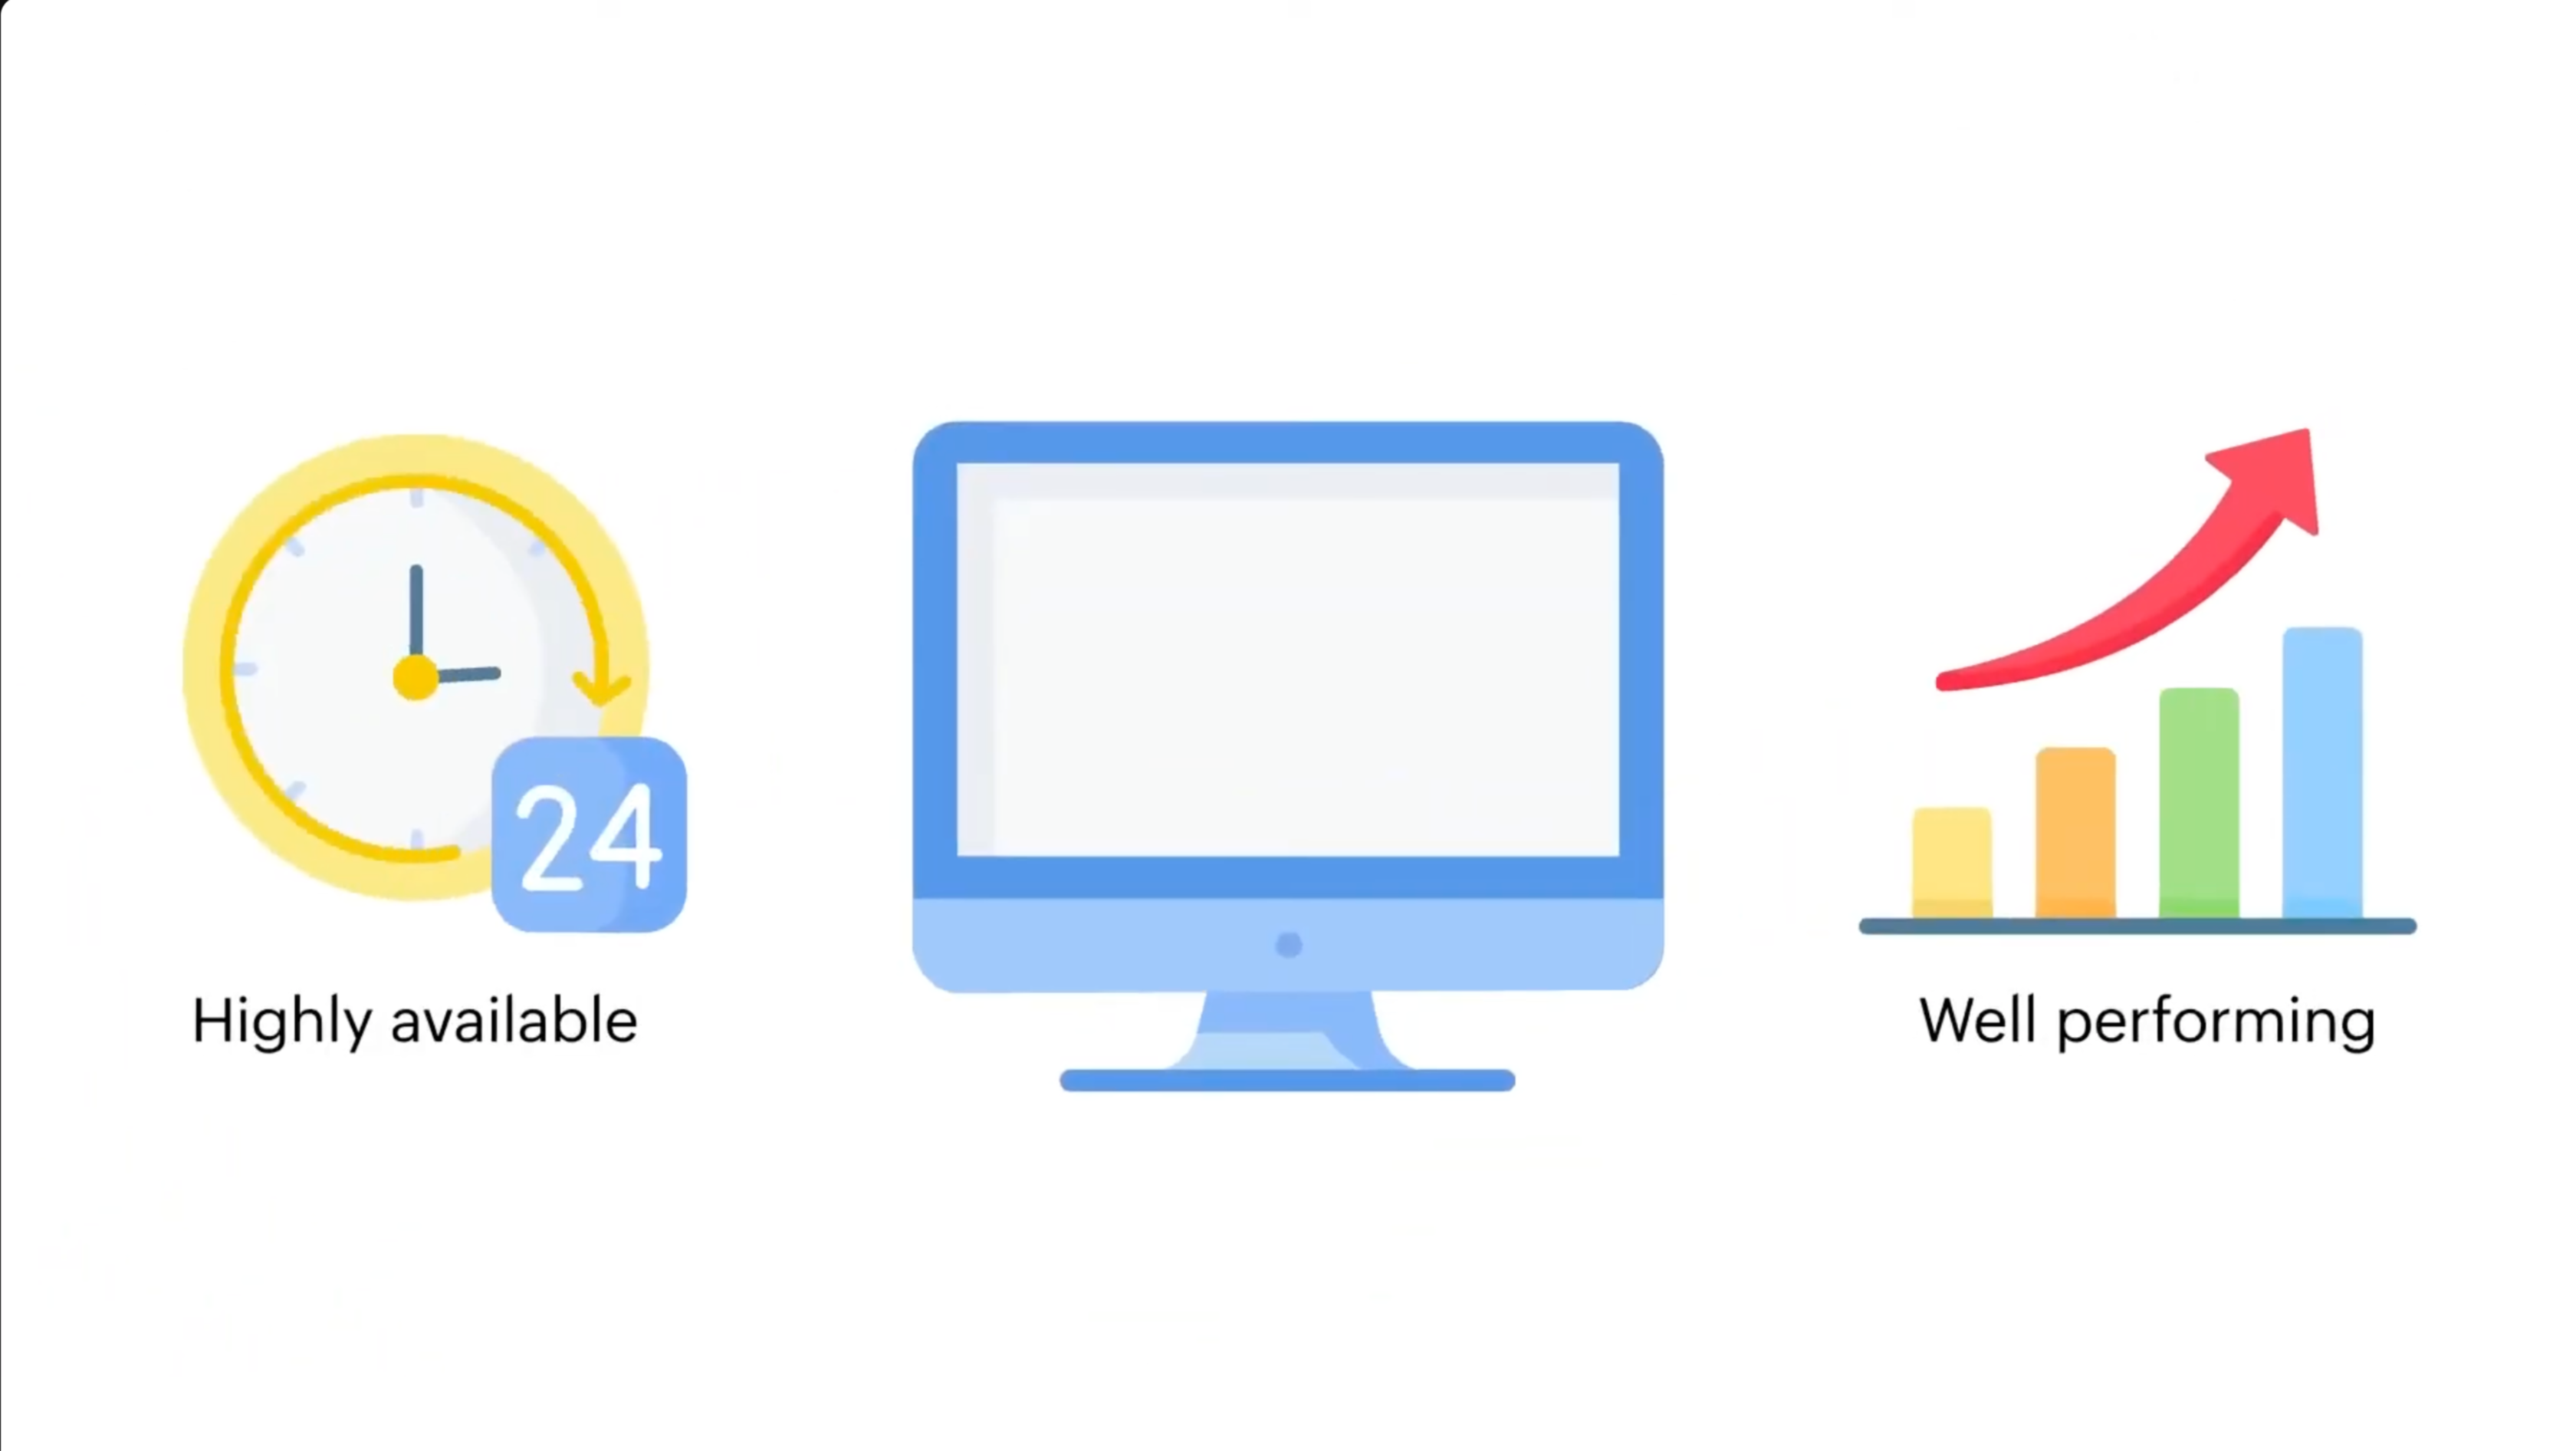
Real-time hardware monitoring
Multi-vendor hardware monitoring
Distributed hardware monitoring
Hardware resources monitoring
Hardware performance monitoring
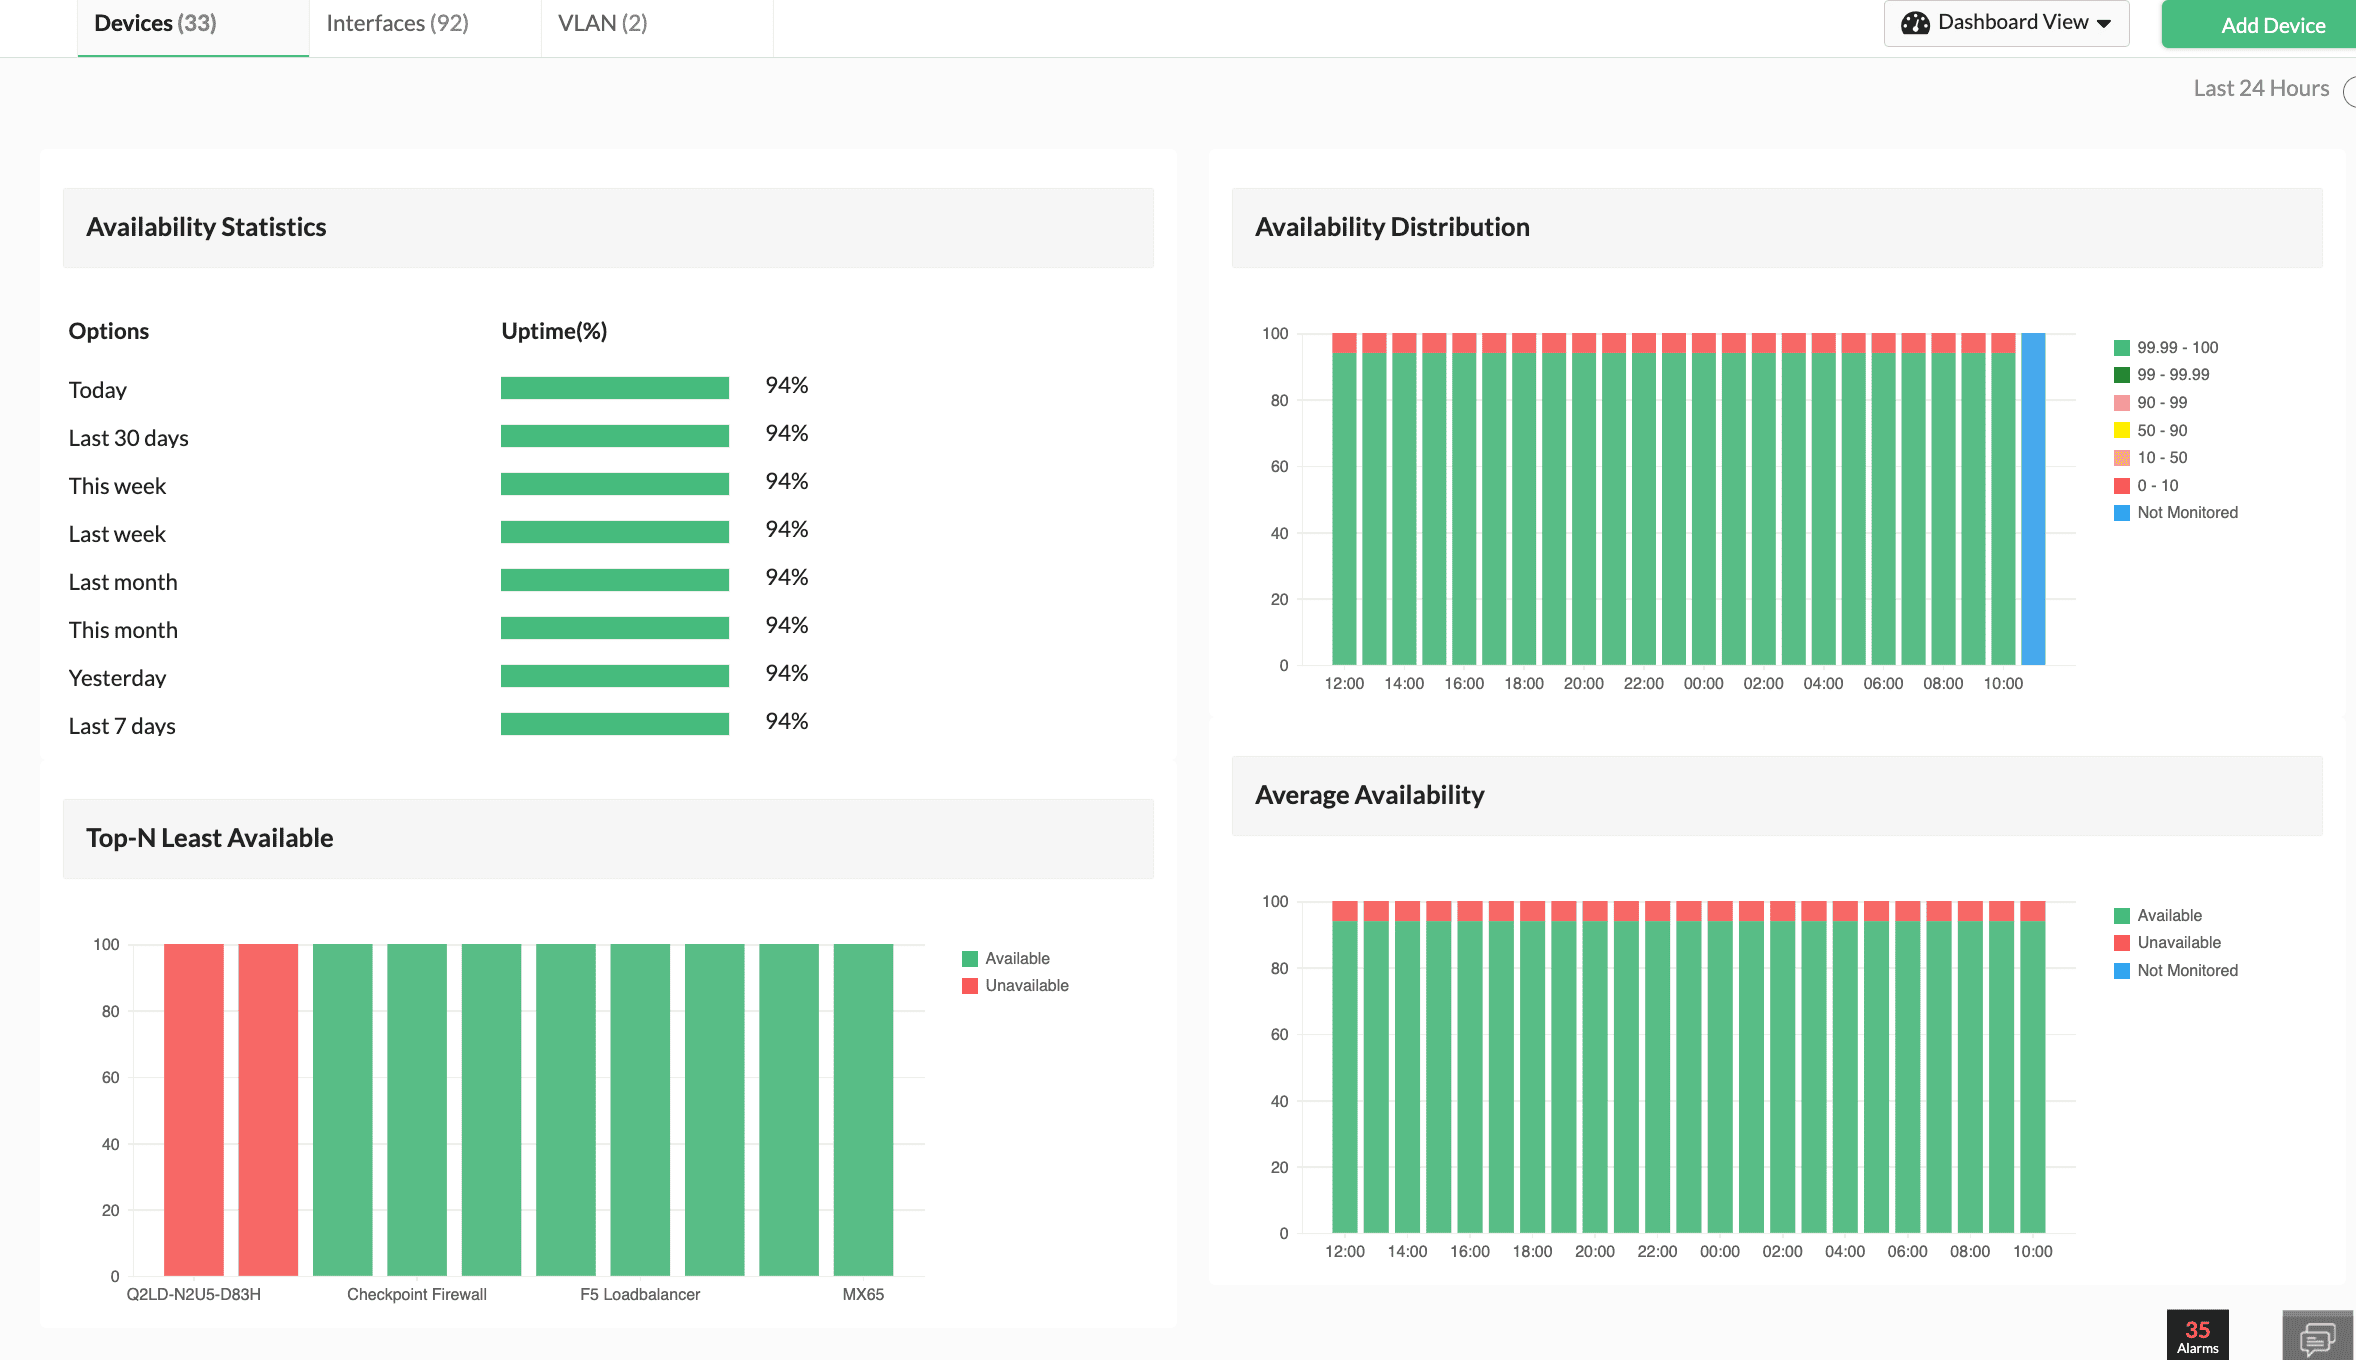
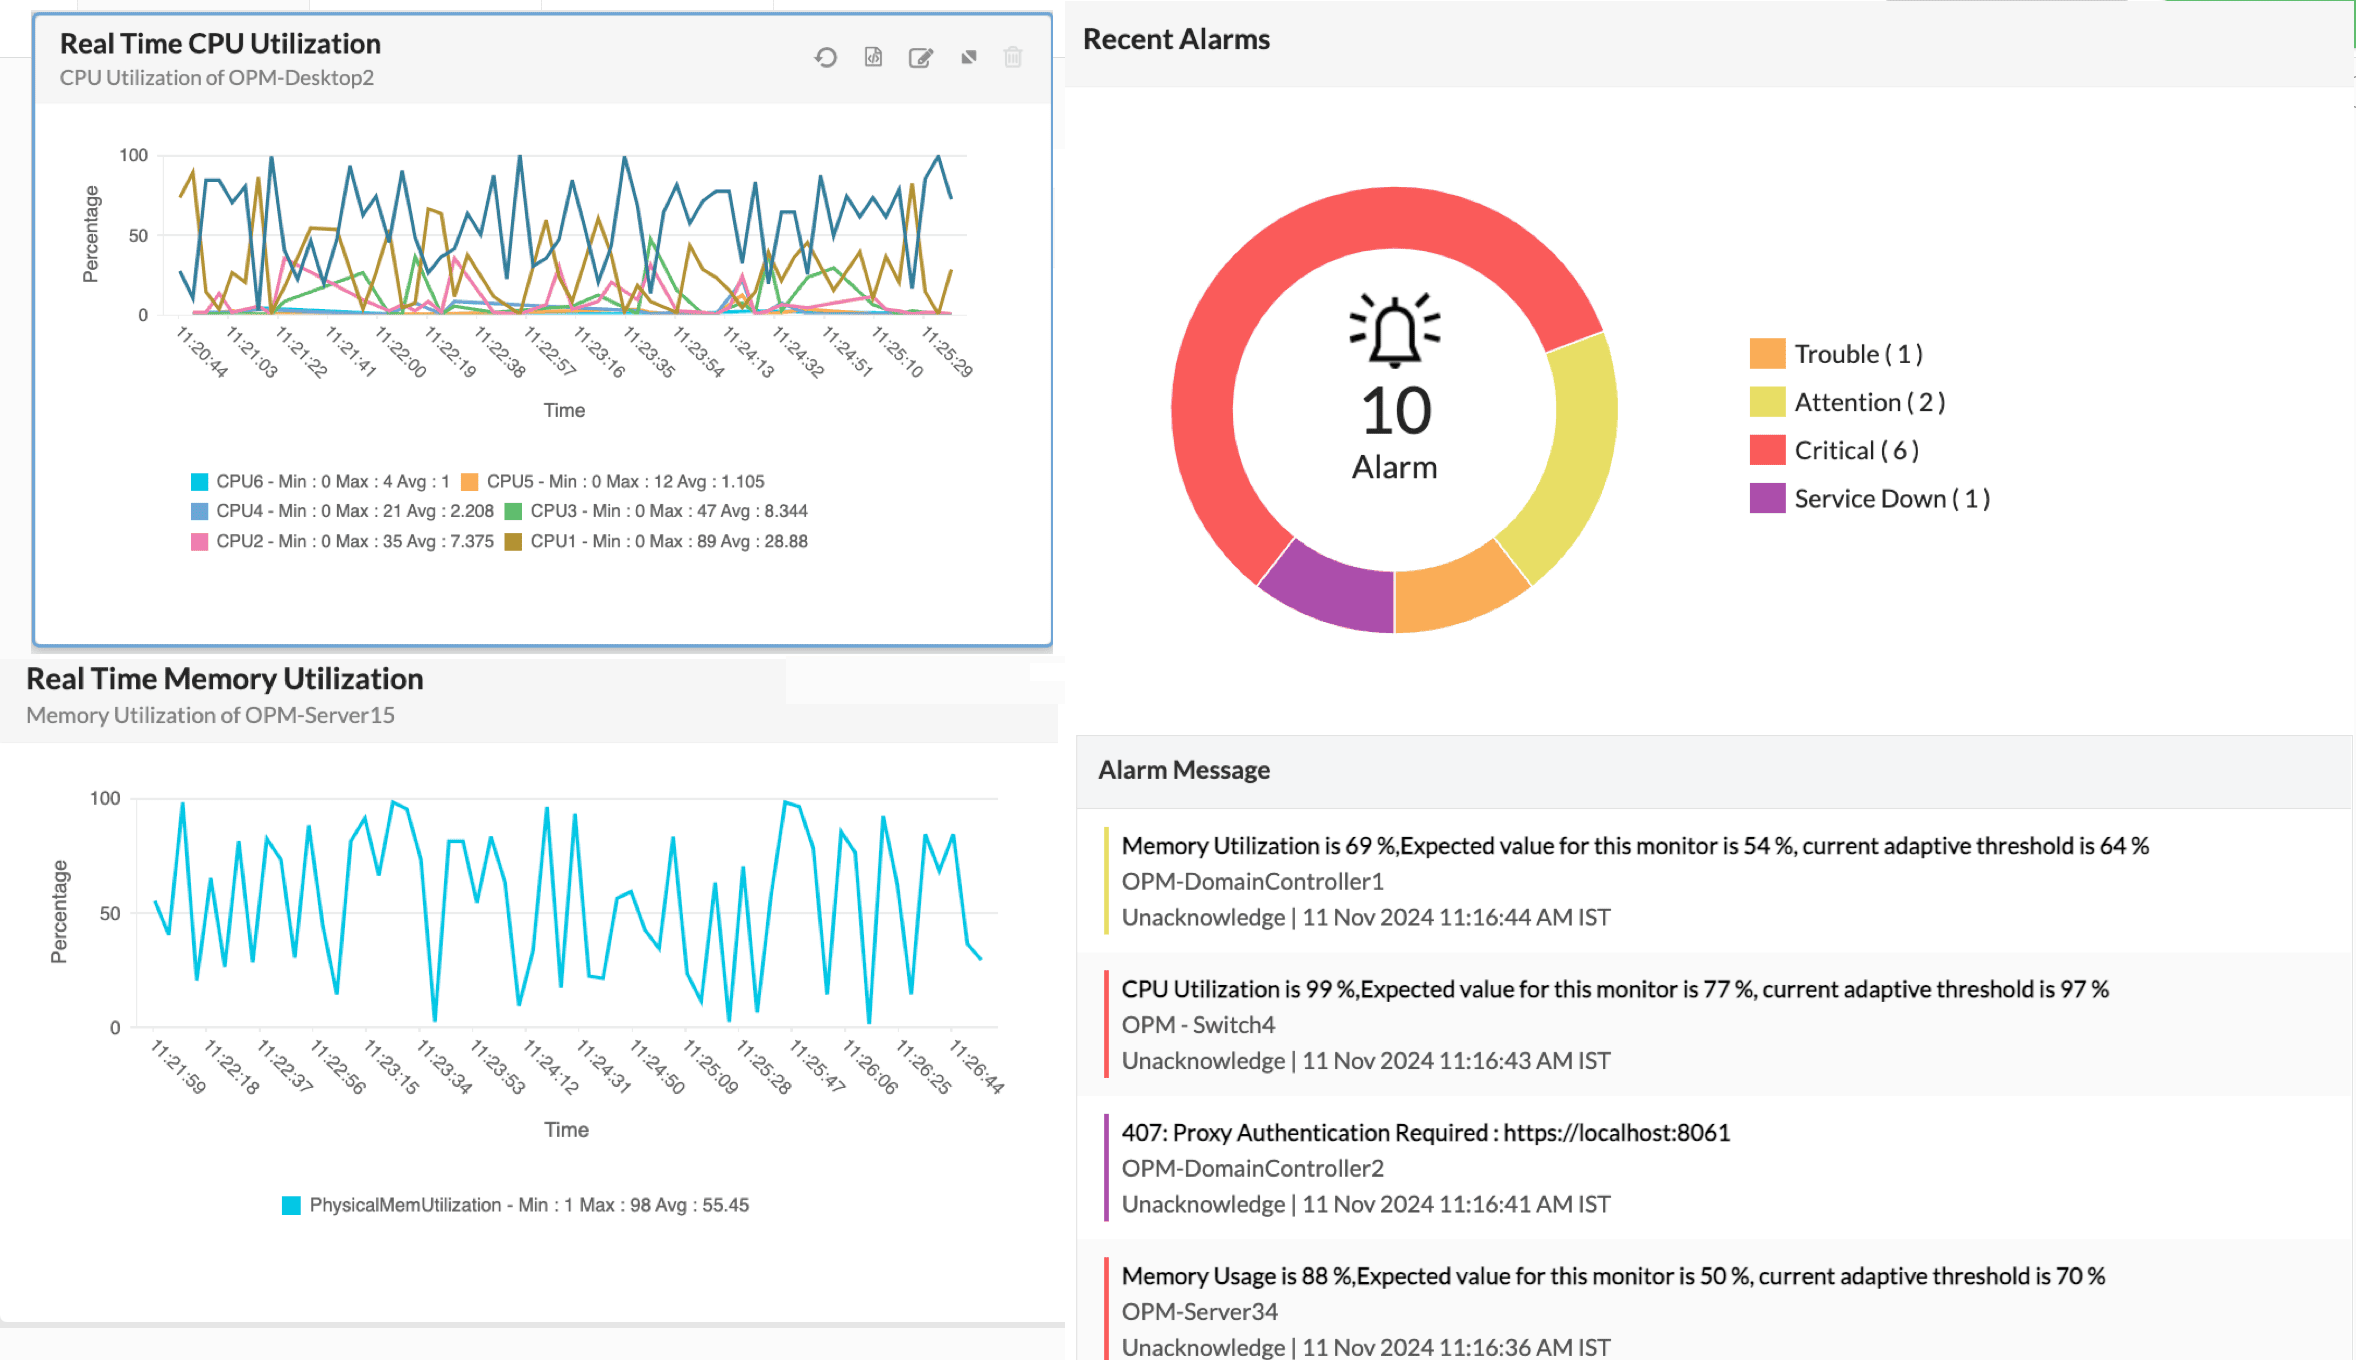
OpManager's real-time network monitor makes it simple to track important hardware like servers, routers, switches, firewalls, virtual machines (VMs), and storage devices. Its hardware monitor software provides real-time updates on their status and availability, displayed in easy-to-understand tables and graphs on the hardware monitoring dashboard.
Multi-vendor hardware support
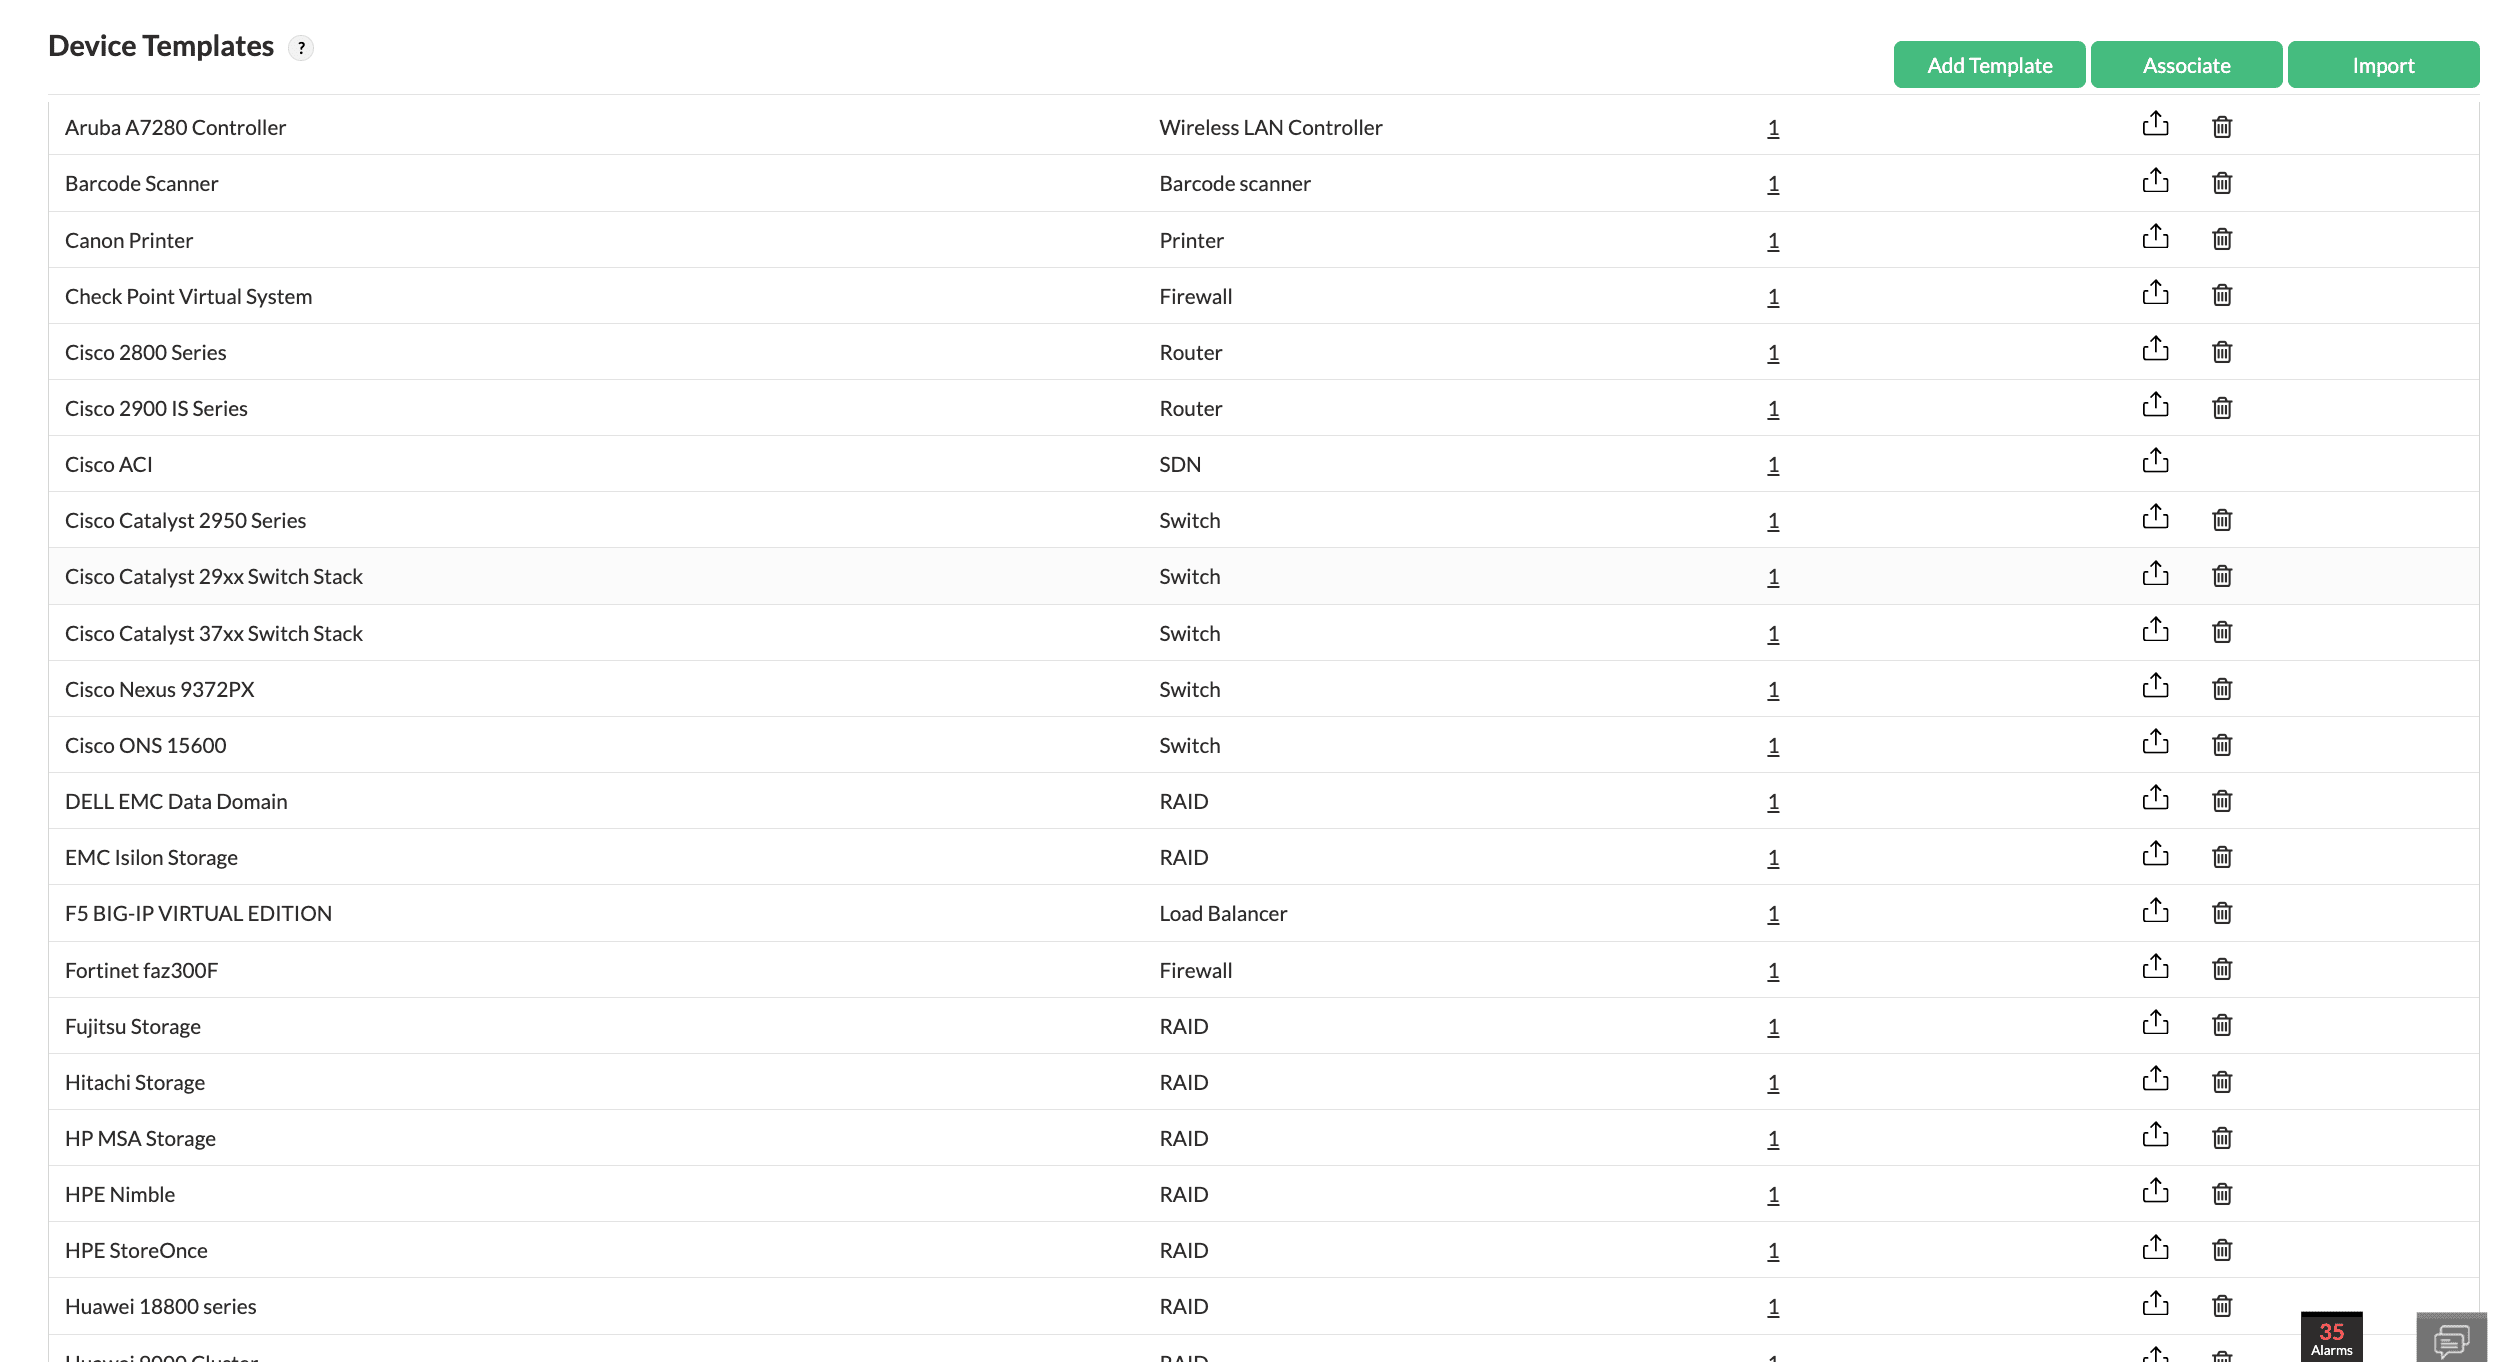
OpManager is a hardware monitor software that helps you keep track of the health and status of your Dell, HP, Juniper, Cisco, Palo Alto, Huawei, and Checkpoint hardware. It can also monitor other devices by allowing you to create custom device templates. The tool displays easy-to-understand metrics about your hardware's status directly within its user interface.
Distributed hardware monitoring
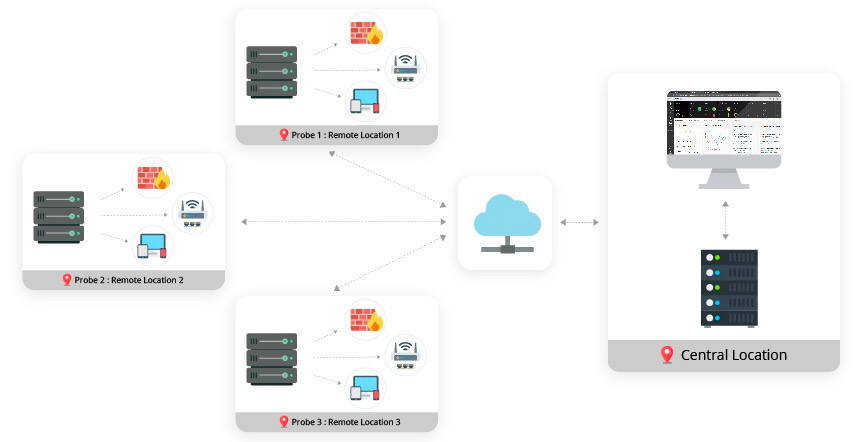
For businesses with data centers in different parts of the world, OpManager's hardware performance monitoring uses a secure and reliable probe-central architecture, allowing you to monitor hardware resources from a single console. This hardware monitoring software helps you keep an eye on your network's hardware from your headquarters' network operations center (NOC), even remotely.
Managing hardware resources
OpManager, as a hardware monitoring solution, closely tracks over 25 metrics related to performance, such as CPU, memory, disk usage, and hardware health metrics, including temperature, fan speed, power supply, and more. The monitored data shows resource utilization, performance speed, and available free space, giving you a clear view of your system's status. This ensures everything runs optimally and helps handle heavy workloads effectively.
How to monitor hardware health by components, with precision
01. Temperature
Keeping track of temperature data is extremely important for monitoring how well your computer hardware is working. Even small changes in temperature can impact your server's availability and cause potential network outages.

02. Fan Speed
OpManager's hardware monitoring software helps you keep an eye on racks, chassis, routers, and other essential components. It ensures that these devices have adequate ventilation and proper airflow distribution.
03. Power Supply
OpManager's hardware monitor software allows you to closely monitor the voltage and current going to different hardware parts and power supply backups. This helps prevent any potential device failures or short circuits.
04. Clock Speed
Keep track of how quickly your computer's processor finishes its tasks using OpManager's hardware monitoring software. This helps ensure that your computer's resources are being used efficiently.
05. Battery
Keep an eye on the batteries in your Dell servers to avoid losing important data, experiencing blue screen errors, and facing unexpected shutdowns with OpManager's hardware monitoring software.
06. Disk Array
OpManager's hardware monitoring software helps keep an eye on the condition of your disk drives to avoid any problems with storage or data transfer.
Troubleshooting capabilities of OpManager's hardware monitor that ensures reduced MTTR
Instant alerts on hardware issues
Troubleshooting hardware errors
Hardware health reports
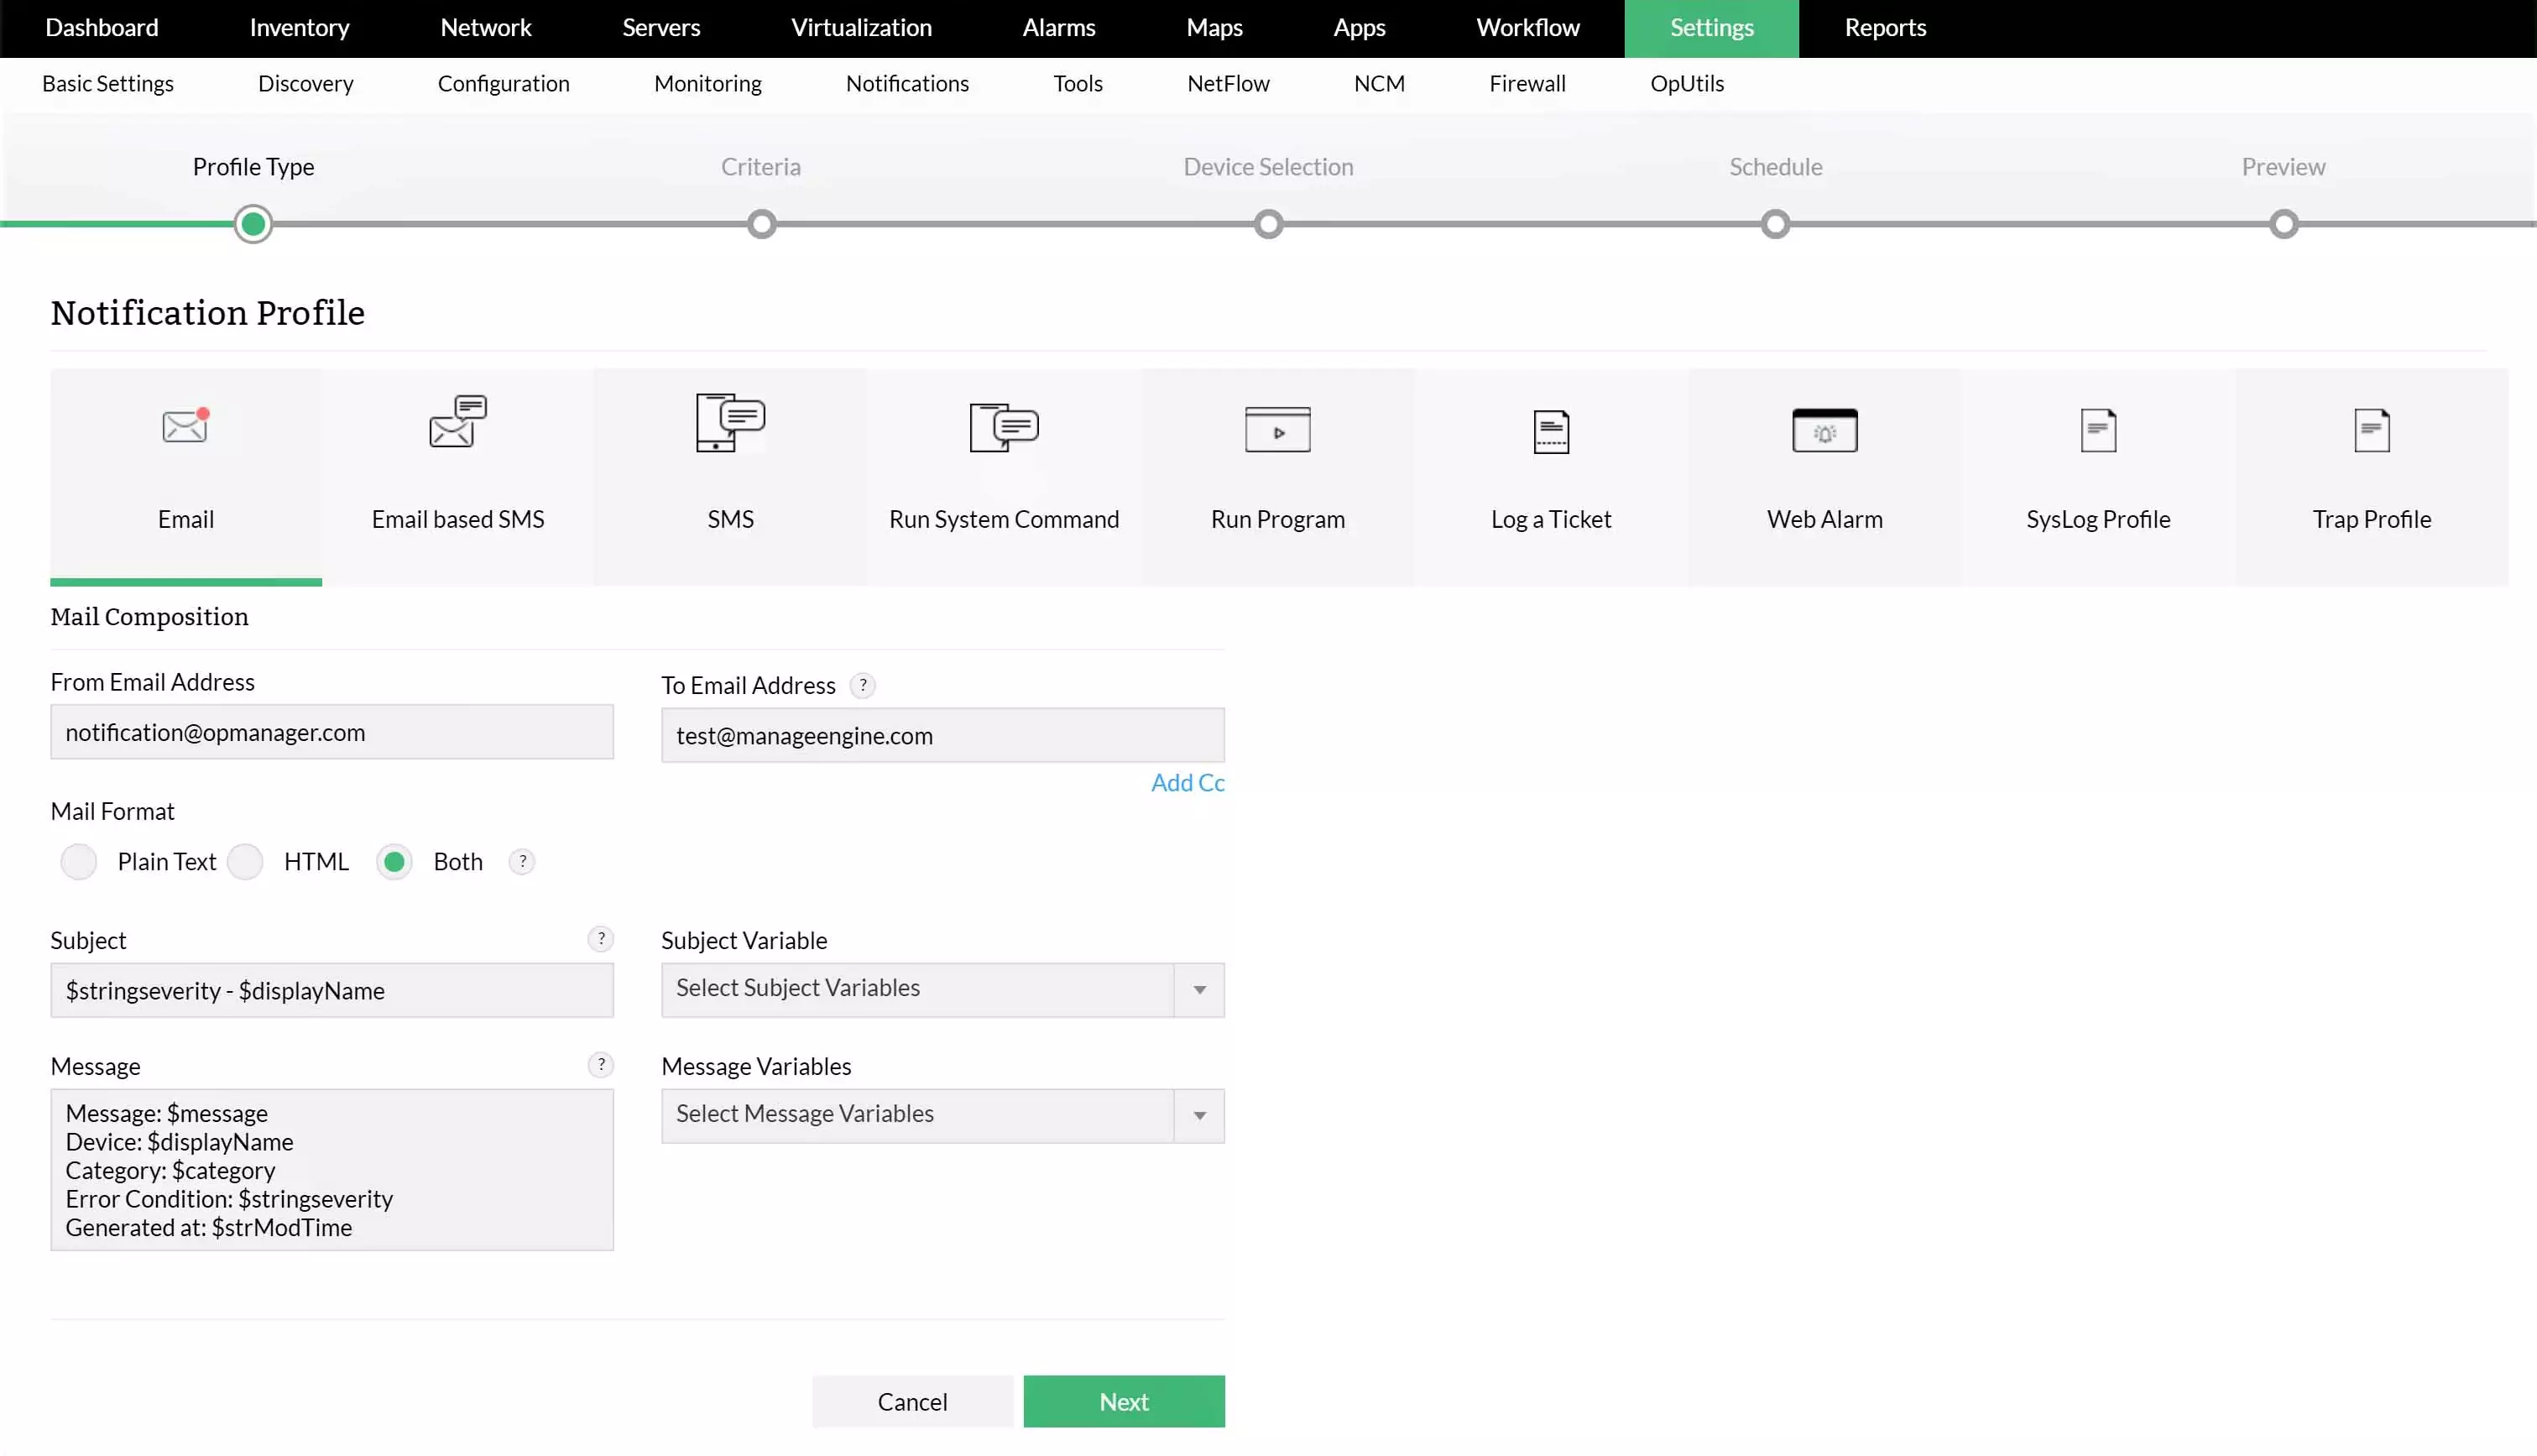
Instant alerts on hardware issues
With OpManager's notification profiles, you can receive immediate alerts through email, SMS, or sound notifications. These alerts are designed to keep you informed about any problems with your network performance caused by hardware failures. By receiving these alerts, you can quickly identify and address issues before they impact your network services.
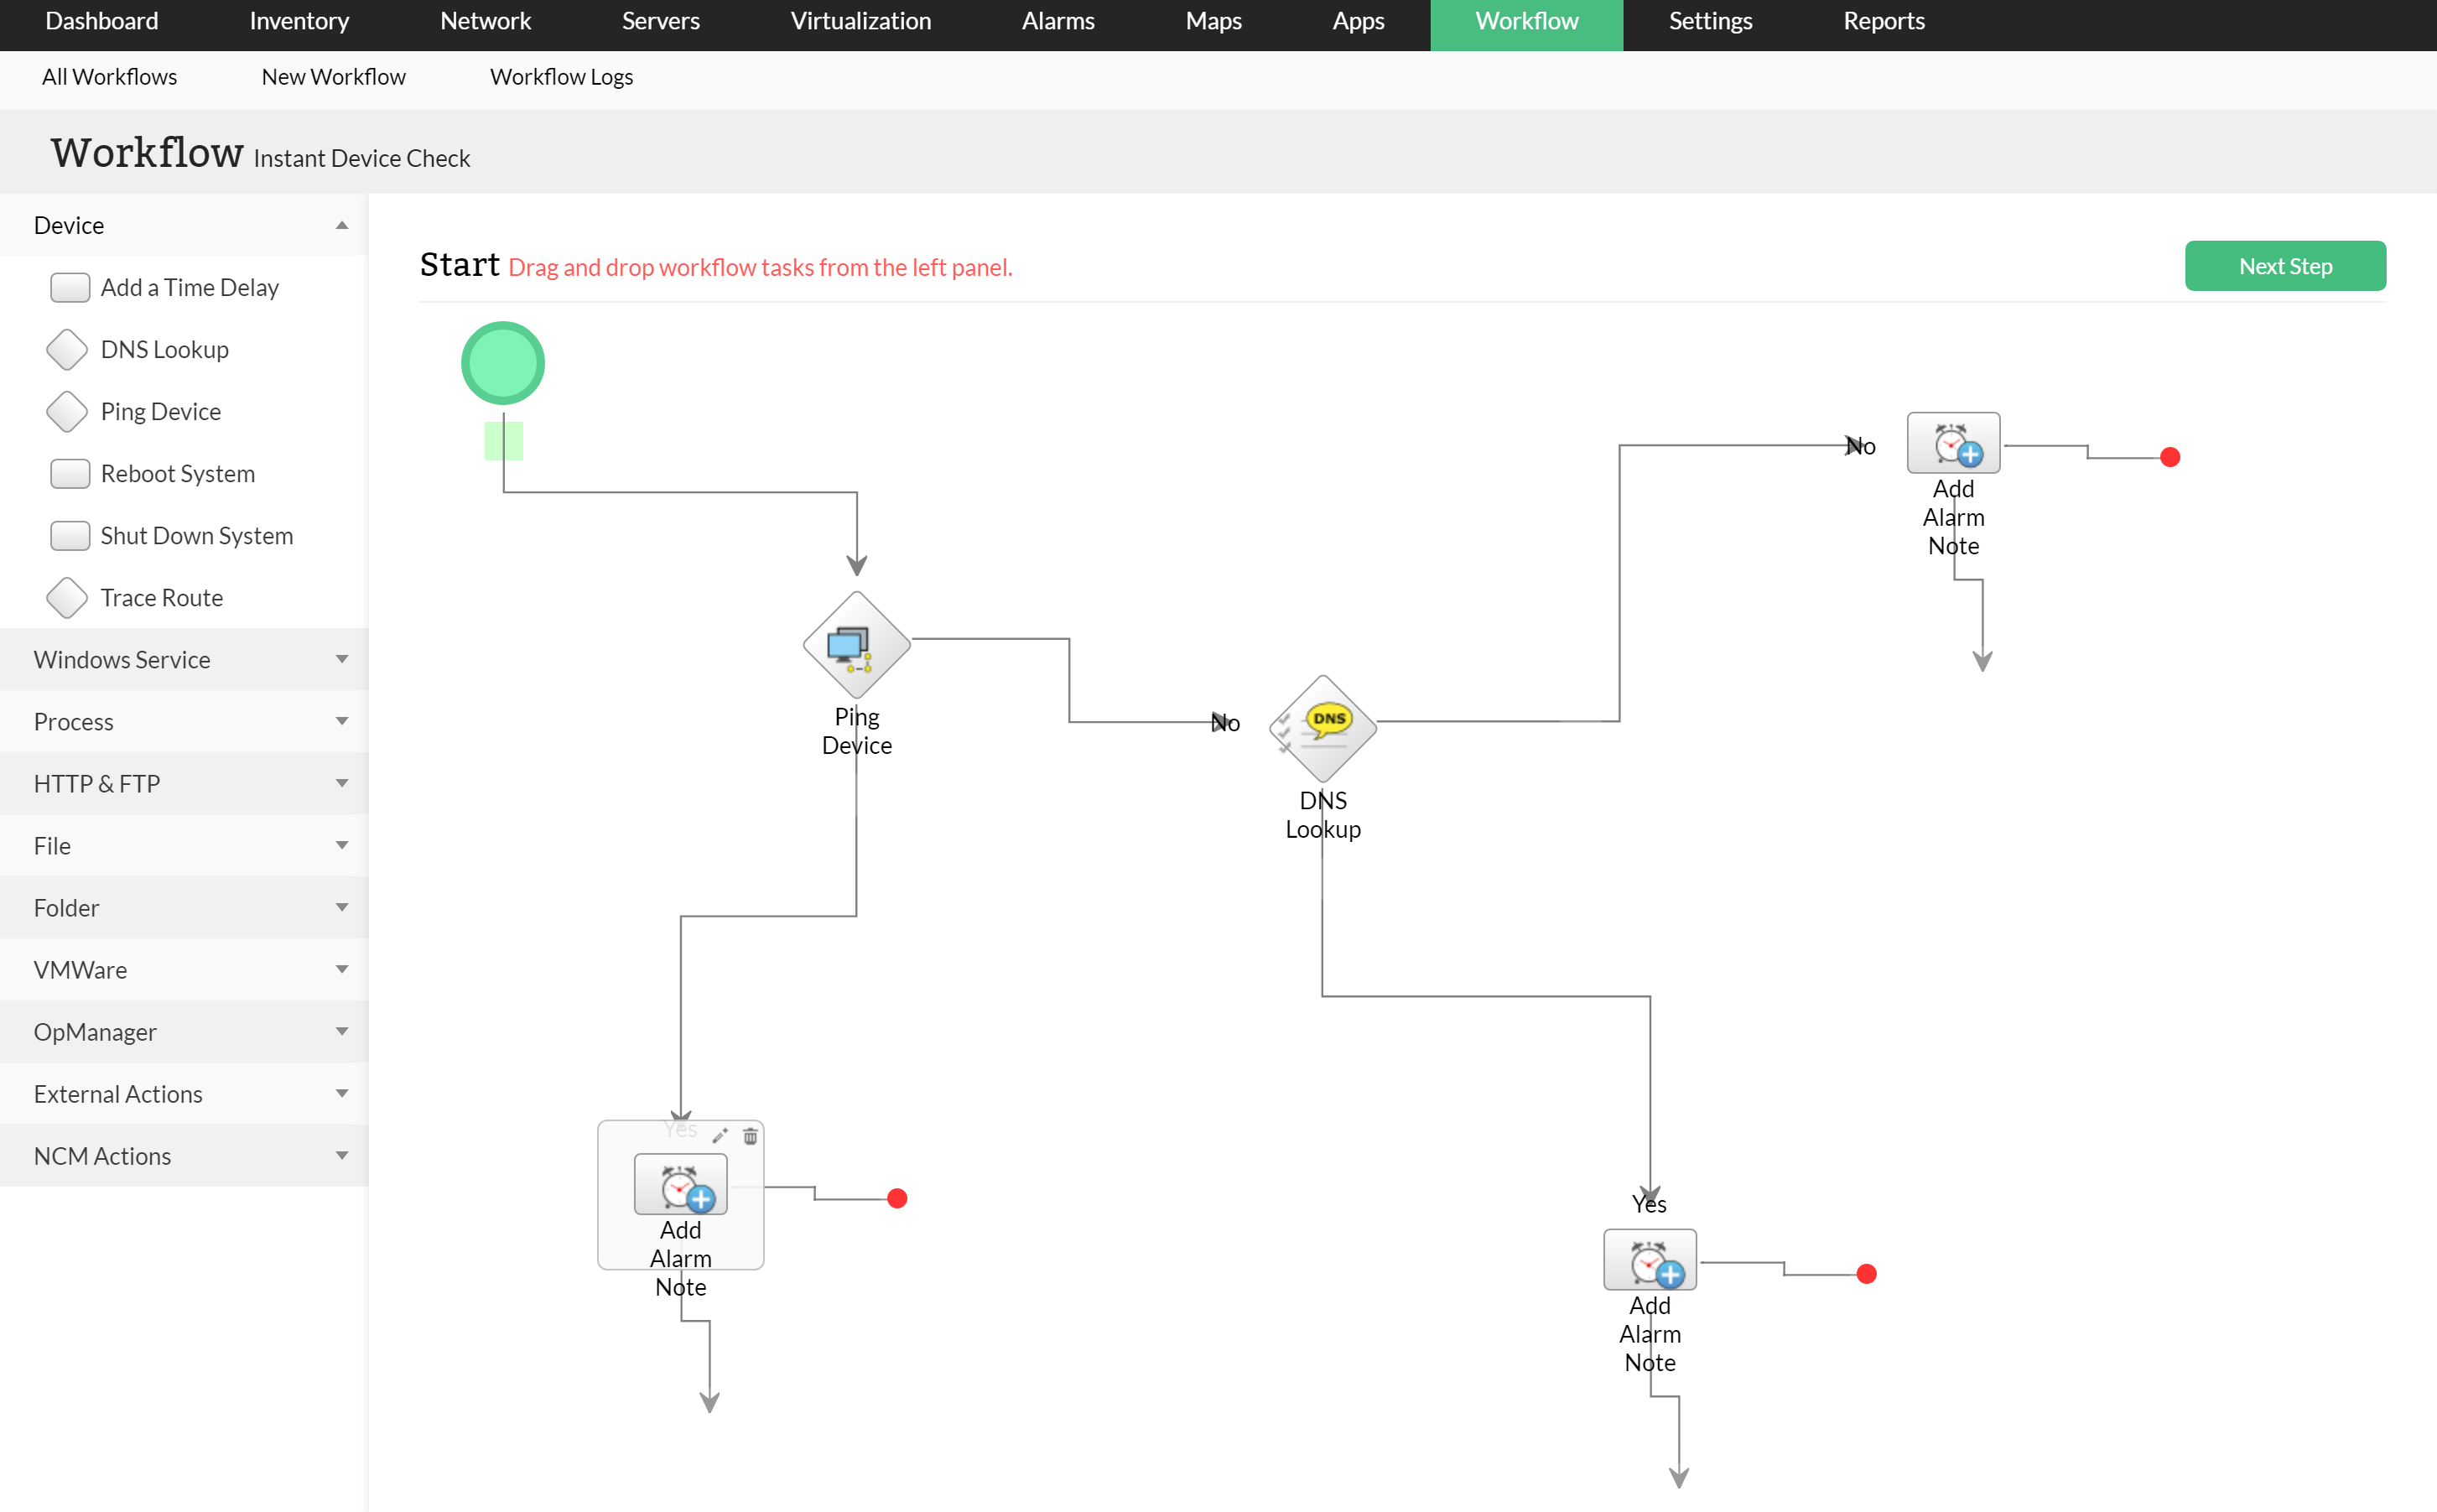
Troubleshooting hardware errors
OpManager's hardware monitor makes it easy for you to take care of your devices. It helps you automate tasks like regular maintenance and troubleshooting. With its configuration, you can set it to automatically do things like restart or turn off a device, update data, or stop processes when it detects a hardware problem.
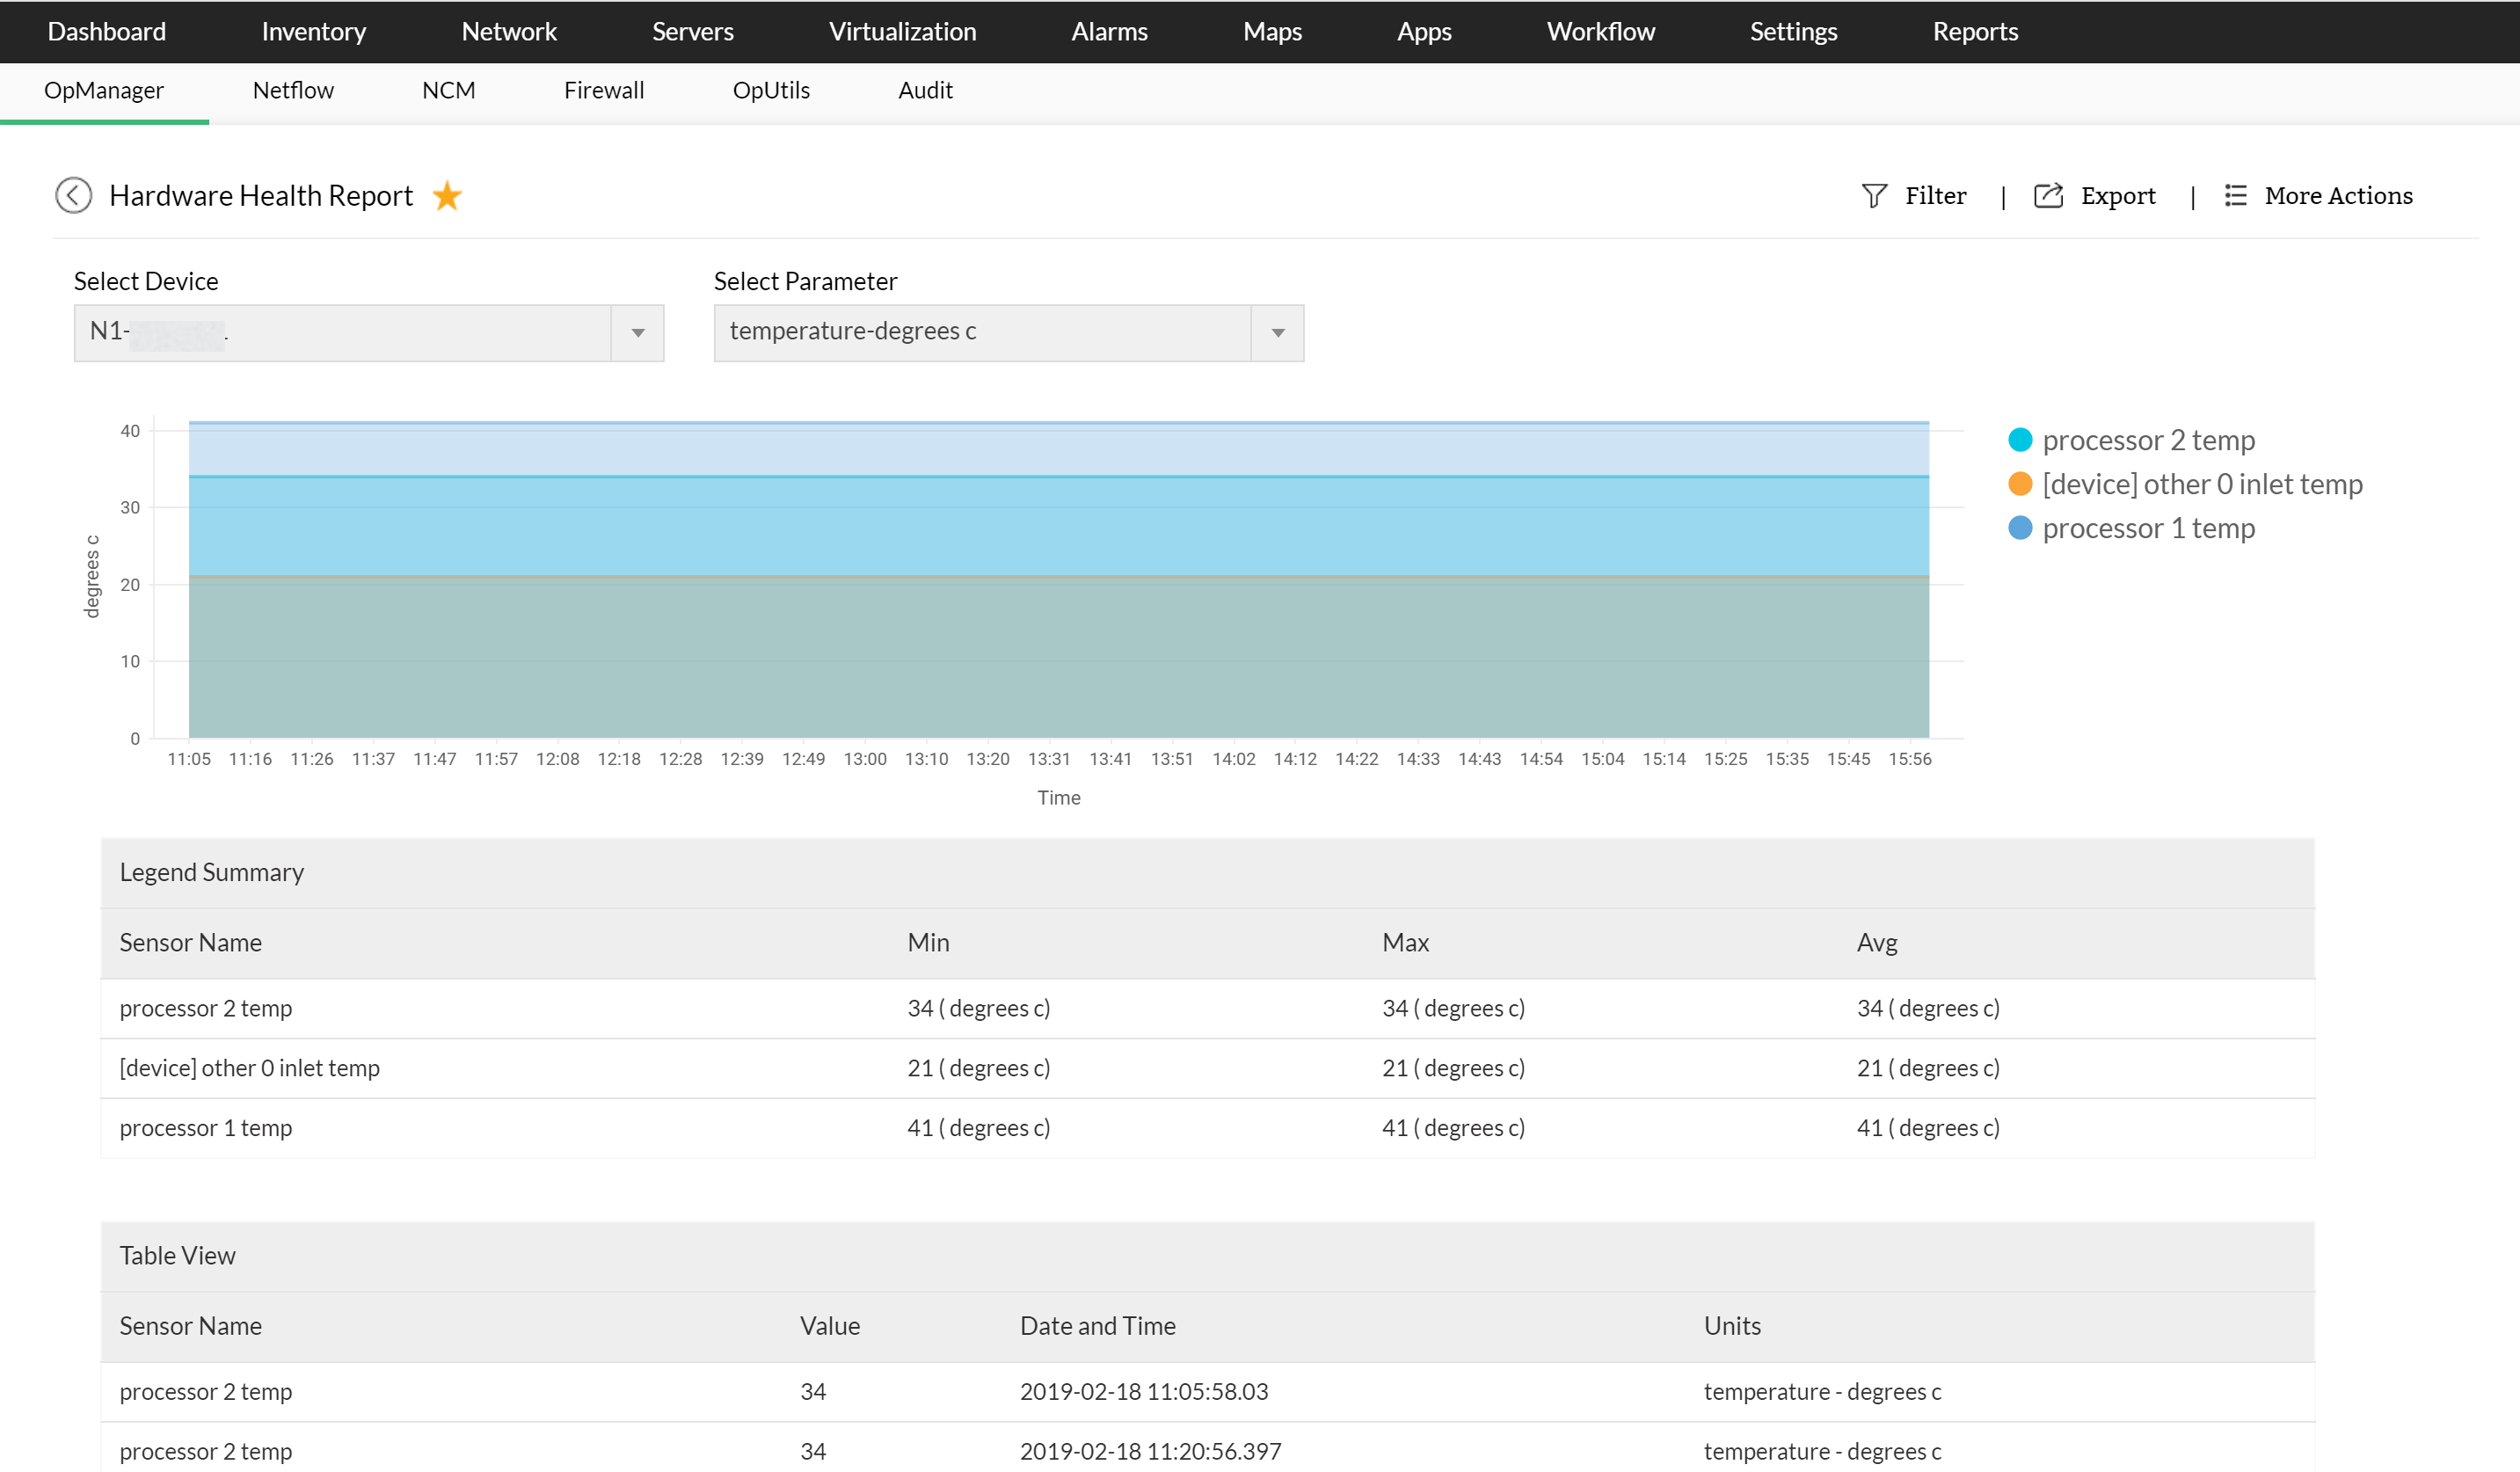
Hardware health monitoring reports
Hardware health reports give you detailed information about the various parameters of your hardware, such as temperature, fan speed, power supply, clock speed, disk array, and more. These reports show the current value of each parameter and the time it was recorded, allowing you to analyze the data to understand how well your hardware is performing.
More on Hardware Monitor Software
What is a hardware monitor? What does a hardware monitor do?
A hardware monitor is a tool that helps you keep an eye on the important aspects of your computer's hardware. It collects information from different sensors and shows you data about the health, condition, availability, and performance of your computer and the network it's connected to.
Why is hardware monitor software important?
How to monitor hardware performance?
What is the role of hardware monitoring in capacity planning?
What is the role of hardware monitoring in ensuring network security?
Do you need dedicated components to monitor hardware in your network?
Is data center temperature monitoring part of hardware monitoring?
How do I monitor hardware usage?
Uncomplicate hardware monitoring
Experience OpManager as a real-time, efficient hardware monitor for your network.
Loved by customers all over the world
“Easy Implementation, Excellent support & Lower Cost Tool - Team Lead, IT Services Industry”
Reviewer Role: Infrastructure and Operations
Company size: 500M - 1B USD
We have been using OpManager since 2011 and our overall experience has been excellent. The tool plays a vital role in providing the value to our organization and to the customers we are supporting. The support is excellent and staff takes full responsibilities in resolving the issues. Innovation is never stopping and clearly visible with newer versions.
“OpManager - 10 steps ahead of the competition, one step away from being unequaled - Network Services Manager, Government Organization”
Reviewer Role: Infrastructure and Operations
Company size: 5,000 - 50,000 Employees
I have a long standing relationship with ManageEngine. OpManager has always missed one or two features that would make it truly the best tool on the market, but over it is the most comprehensive and easy to use the product on the market.
“Easy Implementation with a feature rich catalogue, support has some room for improvement - NOC Manager, IT Services Industry”
Reviewer Role: Program and Portfolio Management
Company size: 500M - 1B USD
The vendor has been supportive during the implementation & POC phases providing trial licenses. Feature requests and feedbacks is usually acted upon swiftly. There was sufficient vendor support during the implementation phase. After deployment, the support is more than adequate, where the vendor could make some improvements.
“Great Monitoring tool - CIO in Finance Industry”
Reviewer Role: CIO
Company size: 1B - 3B USD
ManageEngine provides a suite of tools that have made improvements to the availability of our internal applications. From monitoring, management and alerting, we have been able to peak performance within our data center.
“Simple Implementation, Easy To Use. Very Intuitive. - Principle Engineer in IT Services”
Reviewer Role: Enterprise Architecture and Technology Innovation
Company size: 250M - 500M USD
ManageEngine support was responsive to all our queries.

“OpManager helps me monitor all aspects of the data-center and equipment like servers, switches and routers. It is fast, intuitive and centralized and you do not need to be an expert to deal with OpManager.”
Altaleb Alshenqiti
NGHA

“Donald Stewart, IT Manager of Crest Industries is happy with ManageEngine OpManager for its end-to-end network monitoring software. It is easy-to-use and offers fault and performance management for router.”
Donald Stewart
IT Manager, Crest Industries

“John Rosser, MIS Manager of Yale Chase talks about the proactive nature of ManageEngine OpManager & how his organisation gained value from it.”
John Rosser
MIS Manager
All-in-One Monitoring Solution
Network Performance
- Network Performance Monitoring
- Challenges of Network Performance Monitoring
- Network Device Monitoring
- Agent Based Monitoring
- Network Availability Monitoring
- Network Uptime Monitoring
- Packet Loss Monitoring
- Network Activity Monitoring
- Network Interface Monitoring
- Network Testing Tools
- Network Assessment Tools
- LAN Management
- Hardware Monitor
- Disk Space Monitor
- Hard Drive Monitor
- CPU Monitor
- Uptime Monitoring
- CPU Usage Monitor
- CPU Temperature Monitor
- CPU Memory Disk Monitor
- Memory Monitoring
- Router Monitoring
- Switch Monitoring
- Switch Management Software
- Ethernet Monitoring
- URL Monitoring
- LAN Monitoring
- IP SLA Monitor
- WAN Monitoring
- WAN RTT Monitoring
- VoIP Monitor
- Network Latency Monitoring
- System Performance Monitoring
- Load balancer Monitoring
- VPN Monitor
- WMI monitoring
- Windows Process Monitor
- Wireless Network Monitor
- Wireless Monitoring
- WiFi Monitor
- Wi-Fi Analyzer
- WLC Monitoring
- UPS monitoring
- Printer Monitoring
- Network Printer Management
- HP Network Printer Monitoring Software
- Canon Printer Monitoring Software
- Network Device Discovery
- Cisco Monitoring
- Cisco Meraki Monitoring
- Cisco ACI monitoring
- Cisco UCS Monitoring
- Cisco Port Monitor
- Cisco Switch Monitoring
- IBM monitoring
- Syslog Monitoring
- IPMI Monitoring
- SNMP Monitoring Software
- SNMP Trap Monitoring
- 3Com Switch Port Monitoring
- Fortigate Performance Monitoring
- Juniper Network Monitoring
- NOC Monitoring
- Network Performance Test
- Network Link Monitoring
View more
Data Center Management
Network Access Control
Mobile Application
Server & Virtualization
- Server Monitoring
- Server Uptime Monitoring
- Windows Server Monitoring
- Server Health Monitor
- Server Log Management
- Systems Management
- Hyper-V Management Tools
- Linux Server Monitoring Tools
- VMware Monitoring
- ESX Host Monitoring
- Virtual Machine (VM) Monitoring
- Virtual Network Management
- VMware ESXi Monitoring Tools
- vSphere performance monitoring
- Hyper-V Monitoring
- Hyper-V Performance Monitoring
- Citrix XenServer Monitoring
- Citrix Monitoring
- Nutanix monitoring
- Hyperconverged Infrastructure Monitoring
- Virtualization Monitoring Dashboard
- Operating System (OS) Monitoring
- Windows Network Monitor
- Microsoft Network Monitoring
- Linux Network Monitor
- Dell Server Monitoring
- HP Server Monitoring
- Event Log Monitoring
- Exchange Monitoring
- File/ Folder Monitoring
- FTP Monitoring
- Windows Service monitoring
- Service monitoring
- Process monitoring
- SolarWinds NPM Alternativemonitoring
View more
Reports
Multi-site & Remote Monitoring
Network Fault Management
Network Visualization
Network Monitoring Basics
- Network Monitoring
- Challenges of Network Monitoring
- Network Software
- Network Monitor
- Network Management Software
- Network Management Challenges
- Network Management System
- Network Performance Management
- Network Incident Management
- Network Administration
- Cisco Management
- Network Monitoring Tools
- Real-time Network Monitoring
- Server Management
- Server Performance Management
- SNMP
- Virtual Server Management
- Agentless Network Monitoring
- Disk Space Monitoring Challenges
- Windows Service Monitoring Challenges
- Network Map
- Virtualization
- Virtualization Best Practices
- Virtualization Challenges
- Hyper-V Performance Monitoring Challenges
- Wi-Fi Management Best Practices
- Network protocols
- Network Routing
- Layer 2 Protocols
- Troubleshooting Network Latency
- Virtualization Sprawl
- Basics of Network Diagrams
- Network Diagrams
- Network Mapping Challenges
- Network Optimization
- Switching Loops
- Route Flapping
- VXLAN
- Troubleshooting VLANs
- SD-WAN
- Best Network Monitor
- Best Free Network Monitoring Software
View more