Keep VMs under control with unified monitoring
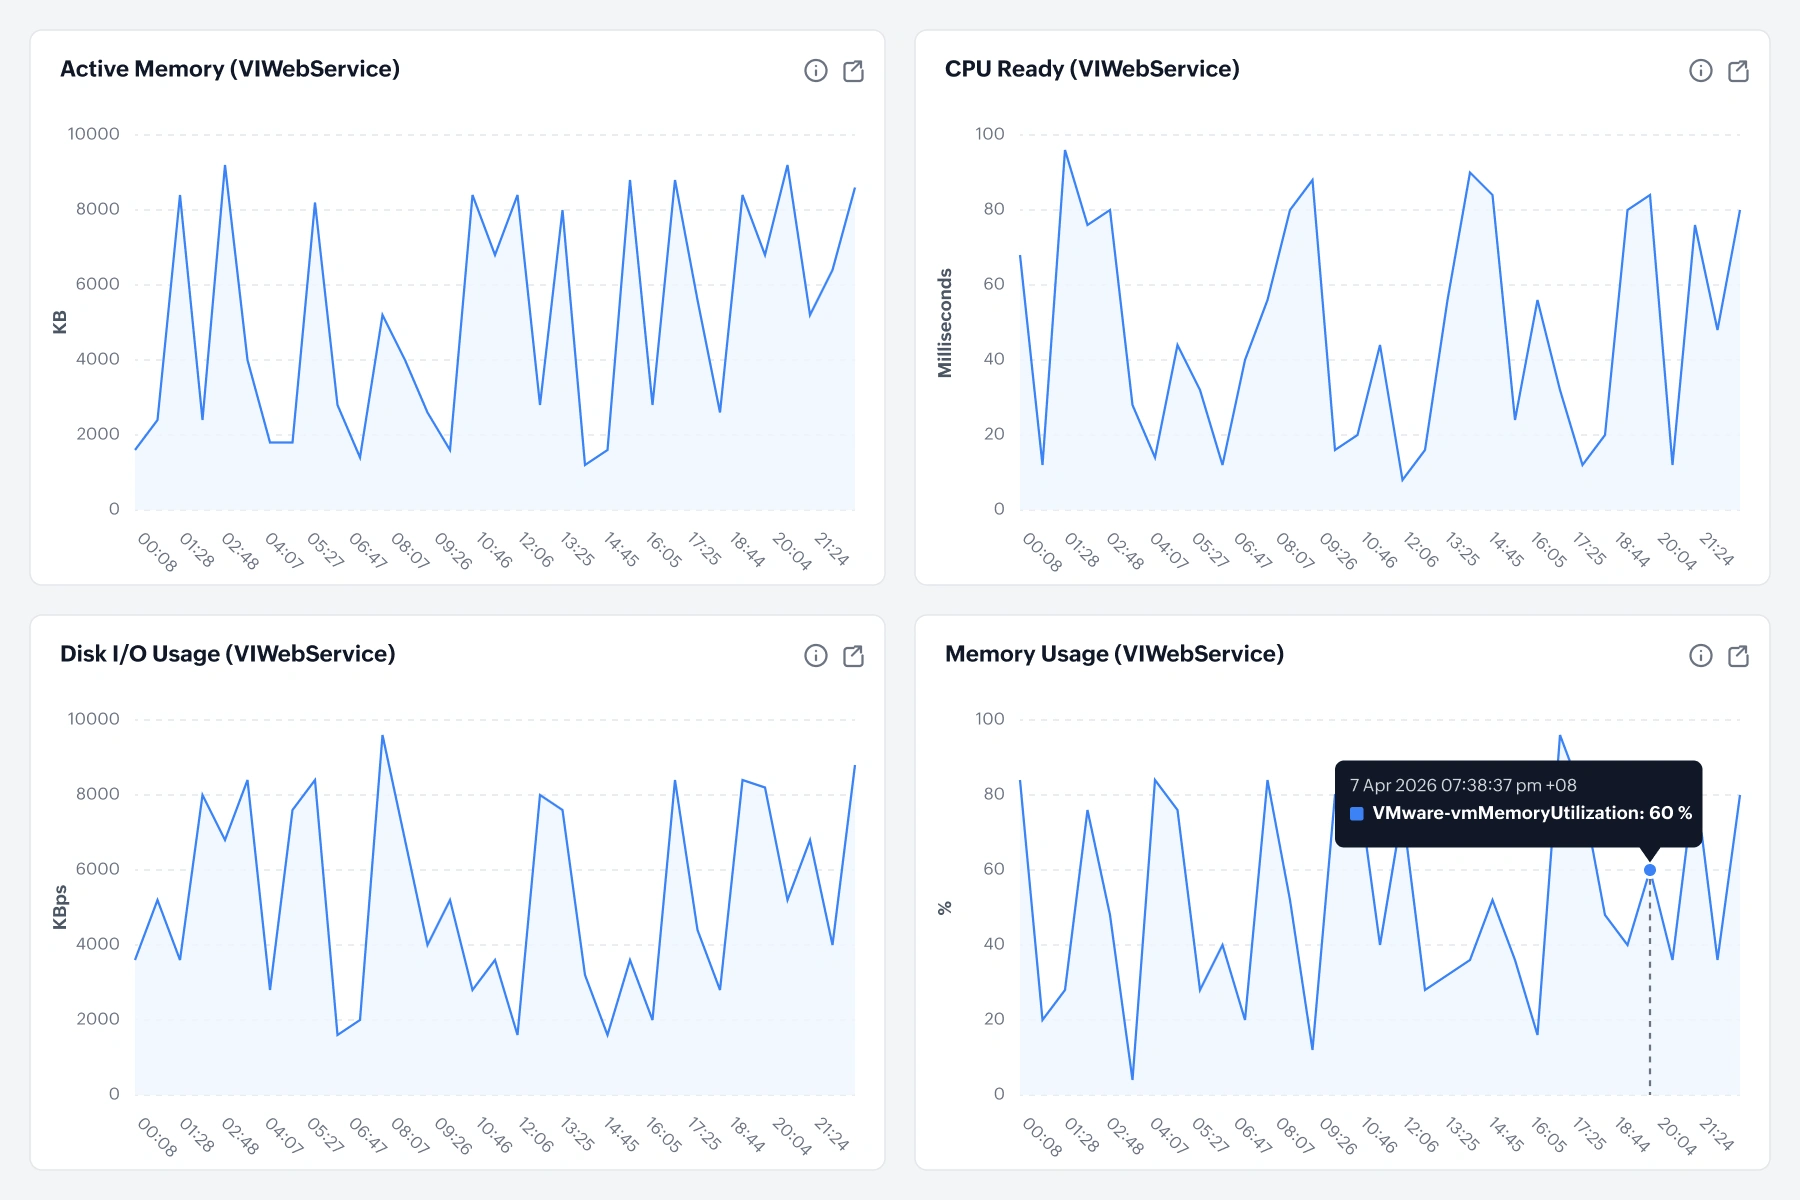
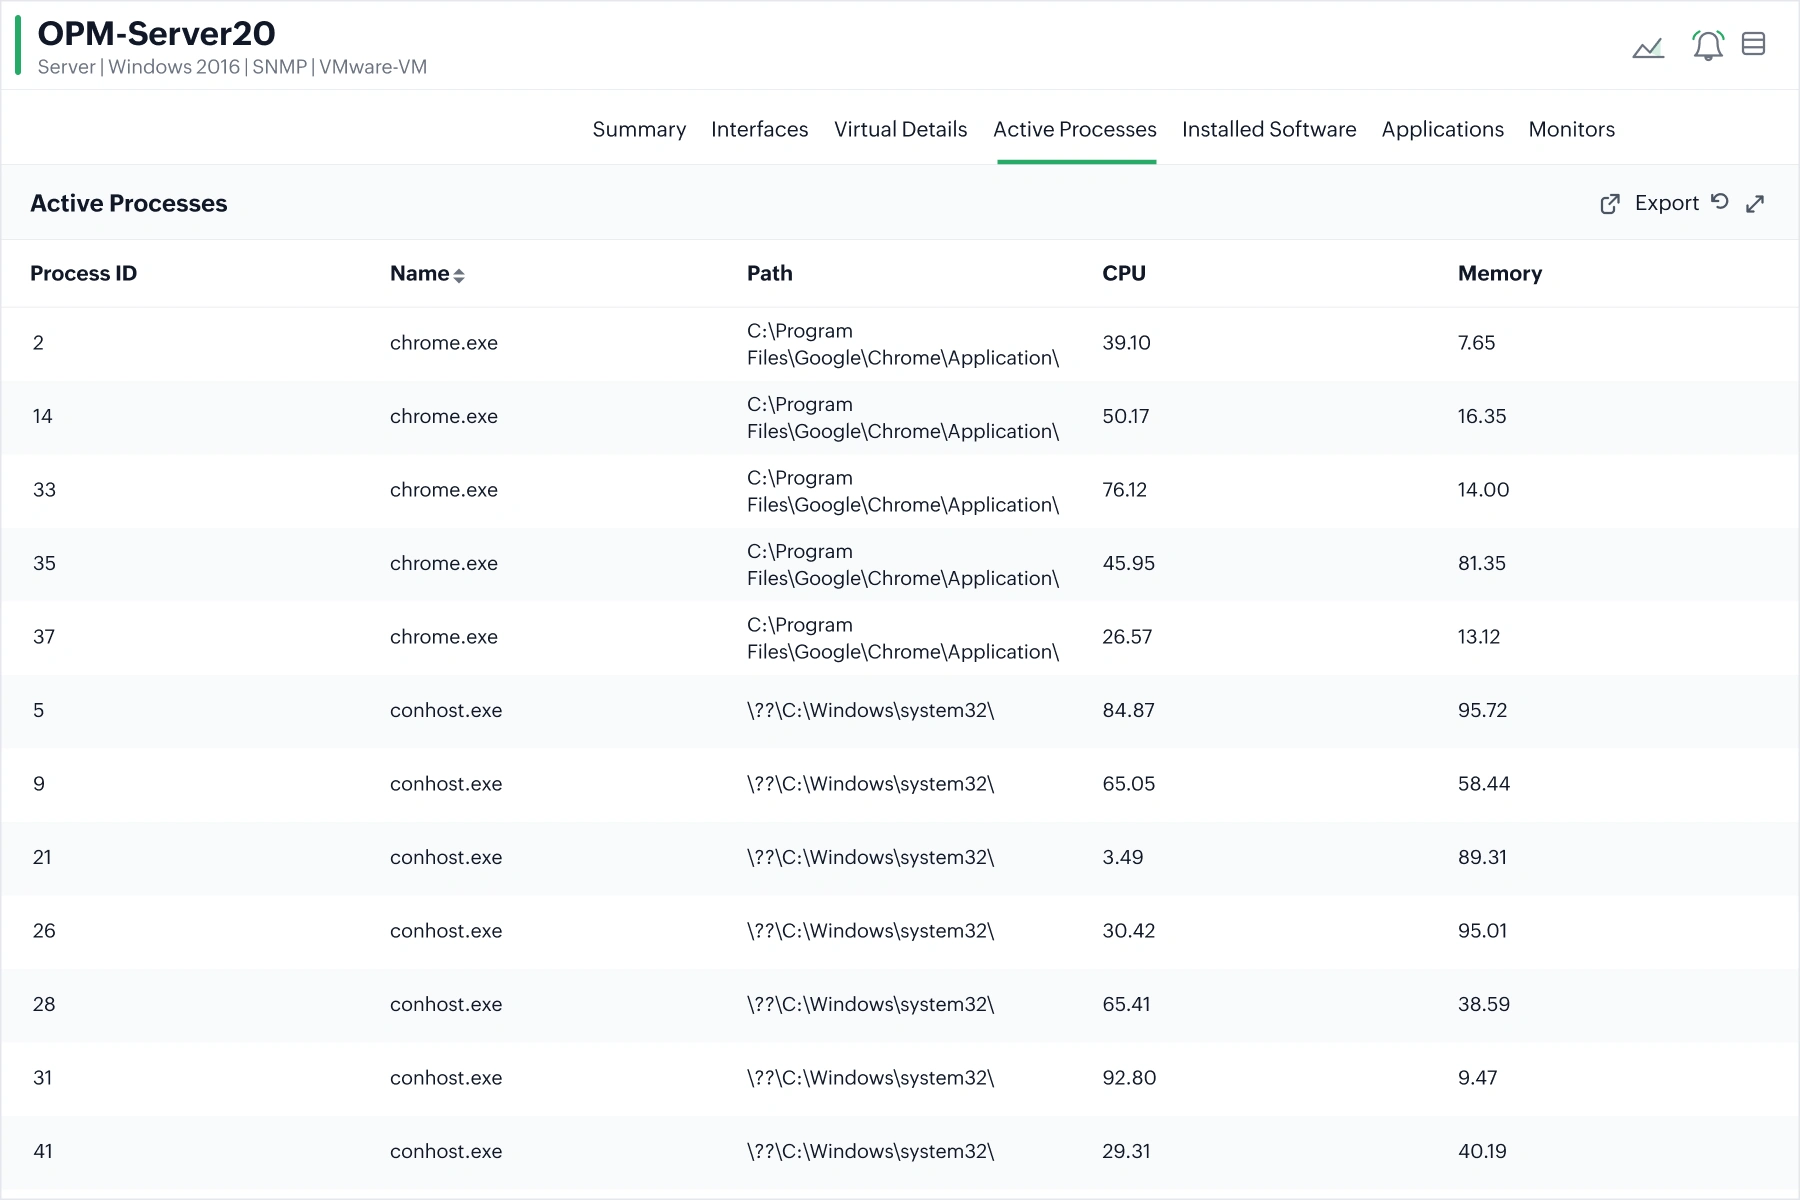
VM issues rarely show up all at once. They build slowly through rising resource usage, overloaded processes, and VMs that become less efficient over time. In environments running VMware, Hyper-V, Nutanix , or XenServer, using separate monitoring tools only makes troubleshooting harder and visibility more fragmented. OpManager brings everything into a single console, helping IT teams spot issues earlier, troubleshoot faster, and make better use of VM resources.