Network performance test is a measurement taken to check the performance, efficiency and durability of the network infrastructure. These tests are executed from time to time to keep the network functioning seamlessly without an interruption to the user experience. It should be noted that the performance and stability of networks can make or break a business. A business can be vulnerable to network outages and losses as a result, regardless of its size and scale. Therefore, it is crucial to have a tool that periodically assesses network performance.
But before that, here are a few metrics you need to keep track of.
Essential metrics to monitor while network performance testing
The performance of a network is influenced by different factors. Below are a few vital metrics you can use like a check list while testing the network performance.
- Availability: The consistency of device availability on a network is critical while checking the network performance. Availability is confirmed by sending pings to the devices at regular intervals.
- CPU and memory: Monitoring the CPU metrics like utilization, speed, idle time, and processor time, periodically is essential. The CPU usage of physical and virtual components in a network significantly influences the network performance and end-user experience.
- Traffic: This is the amount of data that moves through the network at any given time. It includes the network's bandwidth utilization, and traffic patterns that can be optimized to provide greater performance.
- Errors and discards: Packets are discarded by some network devices depending upon the memory utilization, while network errors can be diverse and range from DNS issues to no responses from the server. Monitoring errors and packet losses will reduce errors and discards.
- WAN performance: Organizations use a wide area network (WAN) to interconnect LANs from different locations around the world. Monitoring WAN helps you allocate resources according to the traffic and react to sudden issues affecting them.
We now know the parameters to look for to test network performance to confirm operations are optimum. A network performance test can be conducted by reviewing these parameters.
How to carry out network performance testing?
All we need is performance monitors that help us track each metric specifically, keep records, and generate reports and visualizations for easy analysis. In today's hybrid network architecture, many factors can impact the stability of the network. Network monitoring tools are used to monitor networks continuously, preempt outages, and resolve them proactively as needed. Every delay in resolving the issue might cost the company millions.
With this in mind, IT admin should employ a systematic approach to resolve network bottlenecks. Using a well-equipped network performance monitoring tool will help you identify and troubleshoot potential performance bottlenecks, optimize resource allocation and enhance the end user experience.
Here's a systematic approach to network performance testing, involving five steps:
- Identification: The first step should be identifying the precise location of the issue within the network before moving to the next step.
- Analysis: The root cause of the issue should be uncovered next. There might be more than one cause for the issue and each deserves a specific analysis.
- Execution: When the root cause has been ascertained, the IT admin should quickly execute the fix or resolution. Delays can be costly.
- Automation: Prioritizing and automating actions are helpful for IT admins. Prioritizing helps ensure focus is placed on the most vital and timely needs. Automation saves valuable time and significantly reduces the workload of network management professionals. Both repetitive actions and troubleshooting steps can be automated.
- Audit and Track: Every issue that takes place in the network should be tracked and reviewed. The information maintained in the form of reports helps set a precedent and can provide a clear plan of action when the issue occurs again in future.
While constant monitoring ensures a stable network, you will still want to monitor other components of the network closely. Network monitors let you monitor any IP-based device and provide visualization for different performance metrics. The information and insights at your disposal lets you optimize the network, where you can improve the performance of the network and devices to achieve the optimum level.
Here is why OpManager is the right performance monitoring tool you might be searching for your organization.
Simplified network performance testing with OpManager's NPM
ManageEngine OpManager is an efficient, comprehensive network testing software designed for networks of all sizes and complexities. OpManager's network test tools deliver accurate and fast results in real time. You can automate network tests using OpManager to save valuable time and money, reduce human errors, and cut back on resource usage. All network testing tools are readily available on OpManager's centralized console, ensuring network testing is a smooth exercise.
- OpManager monitors physical and virtual servers, interfaces, switches, routers, firewalls, and any networking device in real time for over 3000 performance metrics.
- OpManager features more than 100 prebuilt reports that provide critical insights into your network performance.
- OpManager supports over 53,000 multi-vendor devices, and offers more than 10,000 device templates for effortless monitoring.
Network availability monitor:
ManageEngine OpManager comes with comprehensive network availability and uptime monitoring that keep your network and network devices running 24/7. OpManager also serves as an uptime monitor, and comes with an interface that provides availability statistics in real time. The OpManager dashboard simplifies detailed monitoring and data analysis of switches, routers, servers and other network devices, enhancing efficiency by displaying all key metrics on one screen.

CPU monitoring:
Reviewing the CPU and memory performance is key in a network performance test. OpManager's CPU monitoring, combined with CPU temperature monitoring, enables you to analyze fluctuations in the CPU load, and identify when CPU usage is critical. CPU performance reports help you review your existing hardware so you can determine whether to improve or cut CPU capability and avoid unforeseen network bottlenecks, saving unnecessary upgrade costs. The CPU monitoring feature also enables you to identify redundant background processes, as well as the resource and memory utilization of a process, and uncover how it is impacting the network.

Traffic monitoring:
Serving as a network monitoring tool, OpManager displays incoming and outgoing traffic patterns. With the NetFlow Analyzer, a powerful OpManager add-on, traffic flow monitoring is taken to the next level. Using NetFlow Analyzer, you can drill-down to specific applications, users, ports, conversations, and identify top traffic destinations. As a result, decision-making is improved for capacity planning. OpManager, combined with NetFlow Analyzer, enables quick troubleshooting and helps resolve bandwidth issues faster.

Packet Loss Monitoring:
A network with less errors, discards, or instances of packet losses is more healthy. Packet loss should be identified promptly in the network, and the cause of the latency should be pinpointed. OpManager fulfills these tasks seamlessly, by using ICMP pings to measure packet loss. A ping is sent every second between hosts, and every request that is lost is counted. OpManager then produces accurate real-time and historical packet loss reports, helping end users ensure their networks are performing optimally.

WAN Monitoring:
OpManager's WAN monitoring feature monitors availability of all your WAN links, round trip time, and traffic details. All pertinent metrics are displayed on the dashboard as part of a detailed WAN performance report, enabling you to single out the root cause of poor WAN availability.

To know more about how it works in your organization, download our free, fully functional, 30-day trial today. Or sign up for a personalized demo and talk with one of our product experts.
Make your network monitoring simple and efficient!
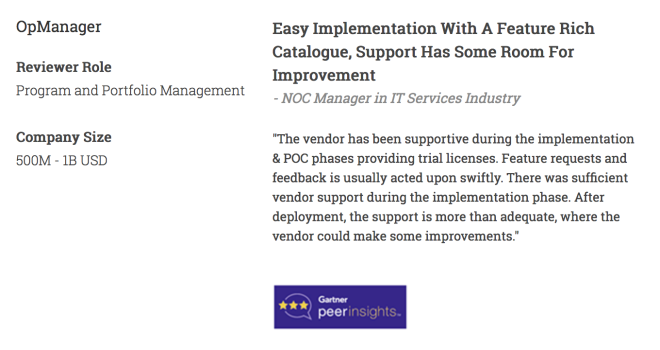
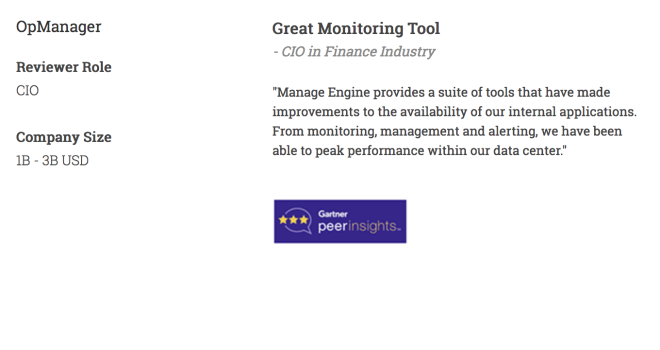
Download OpManager nowCustomer reviews
More than 1,000,000 IT admins trust ManageEngine ITOM solutions to monitor their IT infrastructure securely


Case Studies - OpManager
Awards & Honors
- Recognized as a May 2019 Gartner Peer Insights Customers' Choice for Network Performance Monitoring and Diagnostics Software
- Recognised as an April 2019 Gartner Peer Insights Customers' Choice for IT Infrastructure Monitoring Tools.
- Network Management and Monitor Vendor of the Year 2018, 2019
- Entered the 2019 Gartner NPMD Magic Quadrant.
- Ranked #2 in the Infotech Research Software Reviews Data Quadrant 2018.