Node.js Monitoring
Get real-time visibility into Node.js application performance across all tiers of your architecture. Monitor database transactions, background processes, and API calls from a single dashboard with distributed tracing for microservices.
Real-Time Performance Monitoring
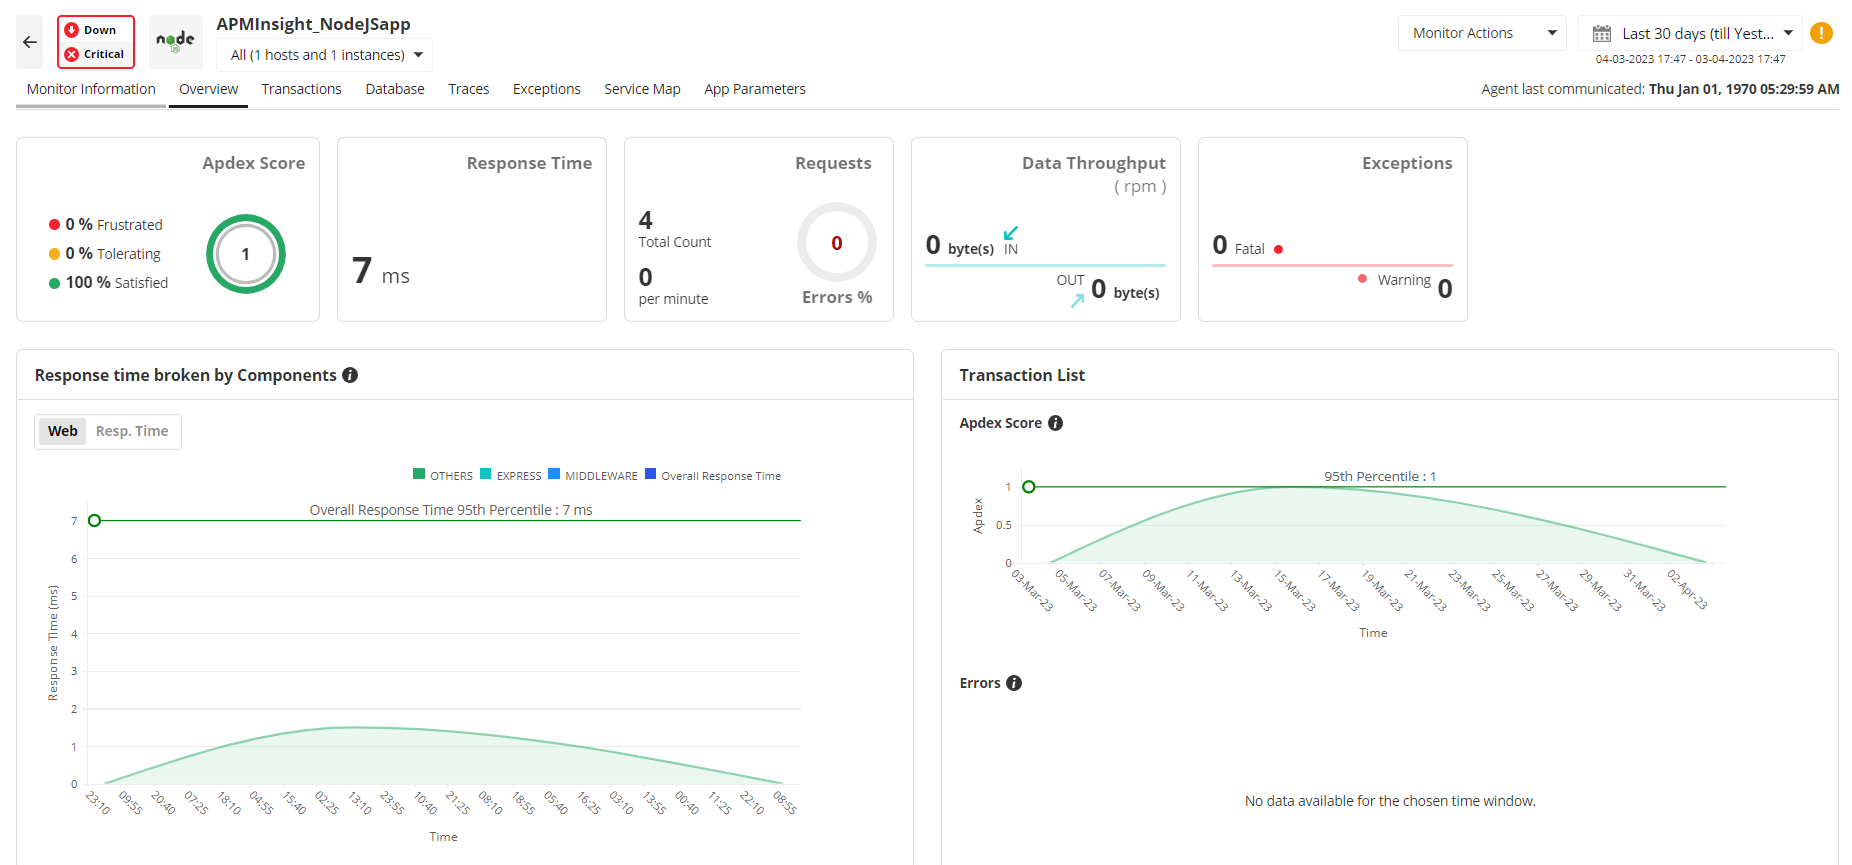
Track the health and performance of your Node.js services with comprehensive visibility into response times, throughput, error rates, and resource utilization. Detect bottlenecks instantly and respond before users are affected.
- Monitor response times, throughput, and error rates across all services
- Track APDEX scores and user satisfaction metrics
- Visualize performance fluctuations with real-time dashboards
- Measure CPU, memory, and garbage collection metrics
Distributed Tracing for Microservices
Track inter-service calls across your microservices architecture. Trace requests through multiple services, identify bottlenecks at each layer, and correlate service dependencies to understand end-to-end transaction flows.
- Trace requests across multiple Node.js services
- Identify which service is causing slow responses
- Analyze service dependencies and API call chains
- Monitor async operations and event-driven flows

Find out how Applications Manager can help you manage your Node.js applications. Schedule a personalized demo today!
Request DemoMonitor database performance
Identify database issues and slow queries in your Node.js applications. Analyze database calls, connection efficiency, and optimize query performance. Understand the impact of database operations on overall application performance.
- Monitor slow database queries
- Analyze query execution patterns
- Track database connection efficiency
- Optimize database performance
Error Tracking & Service Dependencies
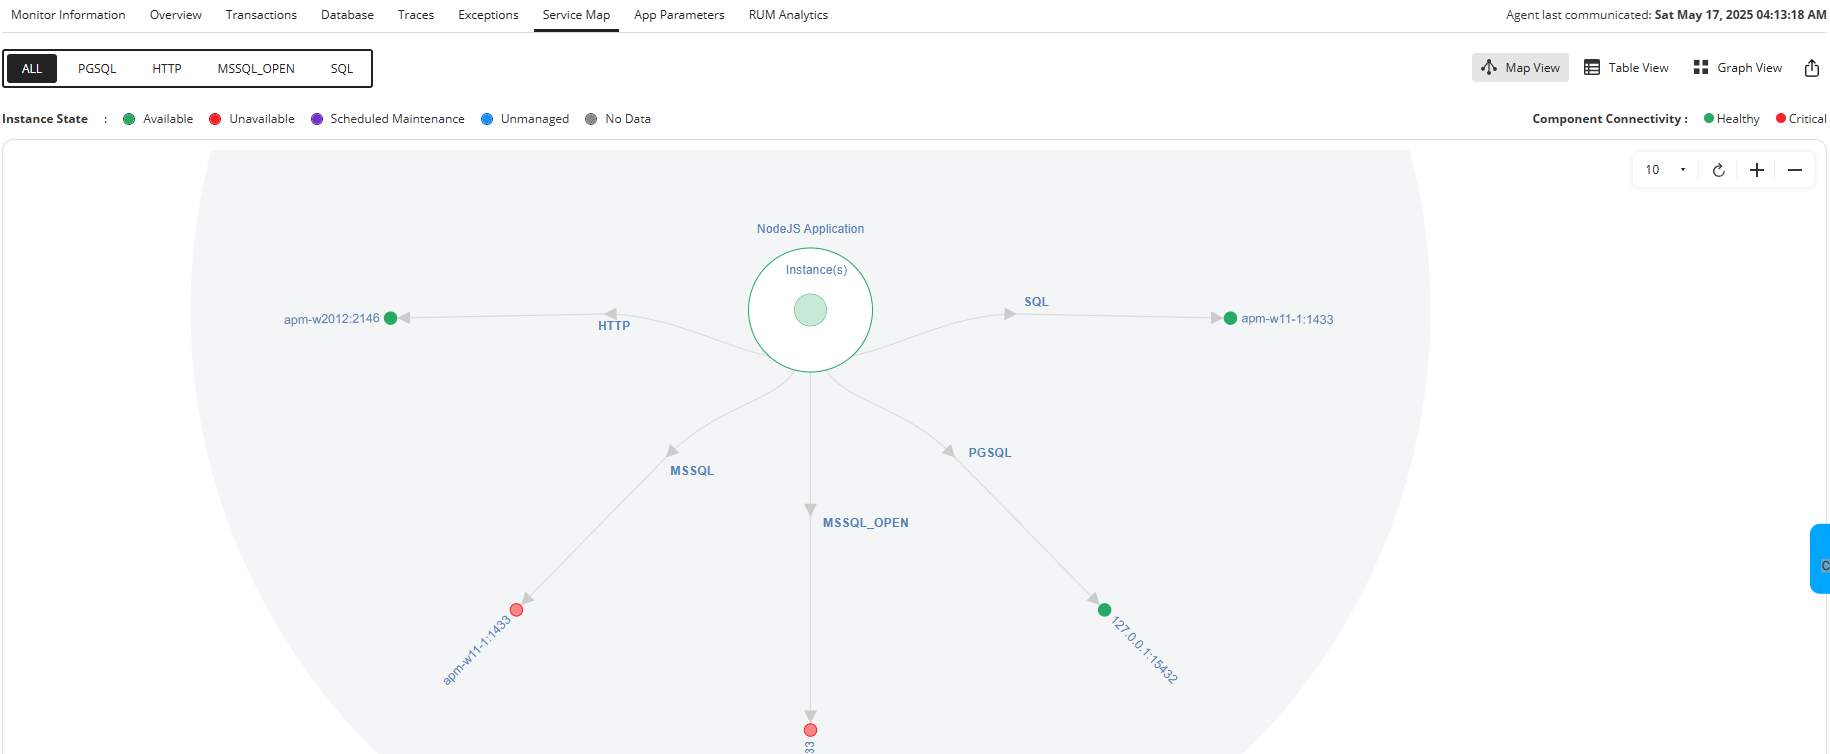
Quickly detect and resolve errors with detailed exception reports including stack traces. Visualize service maps to understand application dependencies and assess the impact of failures on downstream services.
- Capture unhandled exceptions and error stack traces
- Map application dependencies and component relationships
- Identify services affected by failures
- Configure custom error thresholds and alerts
FAQs
We support Express.js, Fastify, Koa, Nest.js, Hapi, and other popular Node.js frameworks with built-in instrumentation.
2. Can I monitor async functions and promises?
Yes, APM Insight tracks async operations, promises, and callback patterns with full context propagation.
3. How do I monitor background jobs?
Background job queues are automatically monitored with task execution times, failure rates, and queue depth metrics.
4. Does it support distributed tracing?
Yes, trace propagation works across microservices with automatic context correlation.
5. What is the performance overhead?
Typical overhead is 2-5% depending on application complexity, with configurable sampling for high-volume apps.
6. Can I monitor WebSocket connections?
Yes, WebSocket transactions are monitored with connection duration and message throughput metrics.
Get started with Node.js Performance Monitoring in just a few minutes!
Experience the benefits of Node.js performance monitoring on your own by downloading Applications Manager's full-fledged, 30-day free trial!