Organization Map
Effective network visualization is key to smooth operations. Instead of piecing together isolated views, OpManager’s Organization Maps give you a complete, real-time picture of your entire network. Unlike generic tools that show fragmented segments, Organization Maps display your full architecture—including topology layouts, device relationships, and app dependencies.
Whether it's servers, routers, or critical business applications, everything is mapped based on how your network is actually structured. This makes it easier to pinpoint issues, understand performance bottlenecks, and manage your network more efficiently—all from a single, intuitive view.
Components that power OpManager's Organization Maps
Building a complete, accurate view of your IT infrastructure requires more than just surface-level data. OpManager’s Organization Maps bring all the pieces together by unifying information from multiple monitoring modules—helping you visualize how devices and applications interact across your network.
Here’s how each component contributes to your network’s bigger picture:
Layer 2 Maps: OpManager starts by mapping devices connected at the data link layer (Layer 2 maps) using seed routers. This foundational layer helps build the base topology of your organization map.
Switch Port Mapper: With the Switch Port Mapper add-on, OpManager identifies devices connected to specific switch ports—complete with MAC addresses and port details. This allows you to visualize what’s connected to your core and distribution switches in real time.
Note: SPM must be enabled and the switches monitored to include this data in your map
Virtualization: OpManager pulls data from its Virtualization module to map hosts, VMs, and datastores. This ensures your virtual infrastructure is clearly represented alongside physical devices on the same map.
Application Monitoring:
Application Discovery and Dependency Mapping: OpManager uses Application Discovery and Dependency Mapping tool to auto-discover apps running on servers and VMs. These insights help admins visualize app-to-infrastructure relationships seamlessly.
Server—Application Relationships: OpManager syncs the relationship between servers and applications running on them. This enables OpManager to have a clear view of the dependencies between servers and their applications.
Manual Dependency Mapping: In Opmanager, users can define and manage the relationships of applications and their dependencies manually, these relationships are synced to OpManager.
Cloud Services Relationships in Applications: The relationships between cloud services and their parent accounts are mapped and synced with OpManager to visualize the hierarchical structure and components of cloud services across API platforms.
Note: The data from the ADDM module will only be retrieved if the Applications Manager plug-in is version 172600 or above.
Uplink Dependency: Admins can define uplink dependencies between devices to reflect real-world hierarchies. OpManager then uses this data to draw clear dependency chains, helping identify upstream impact during outages.
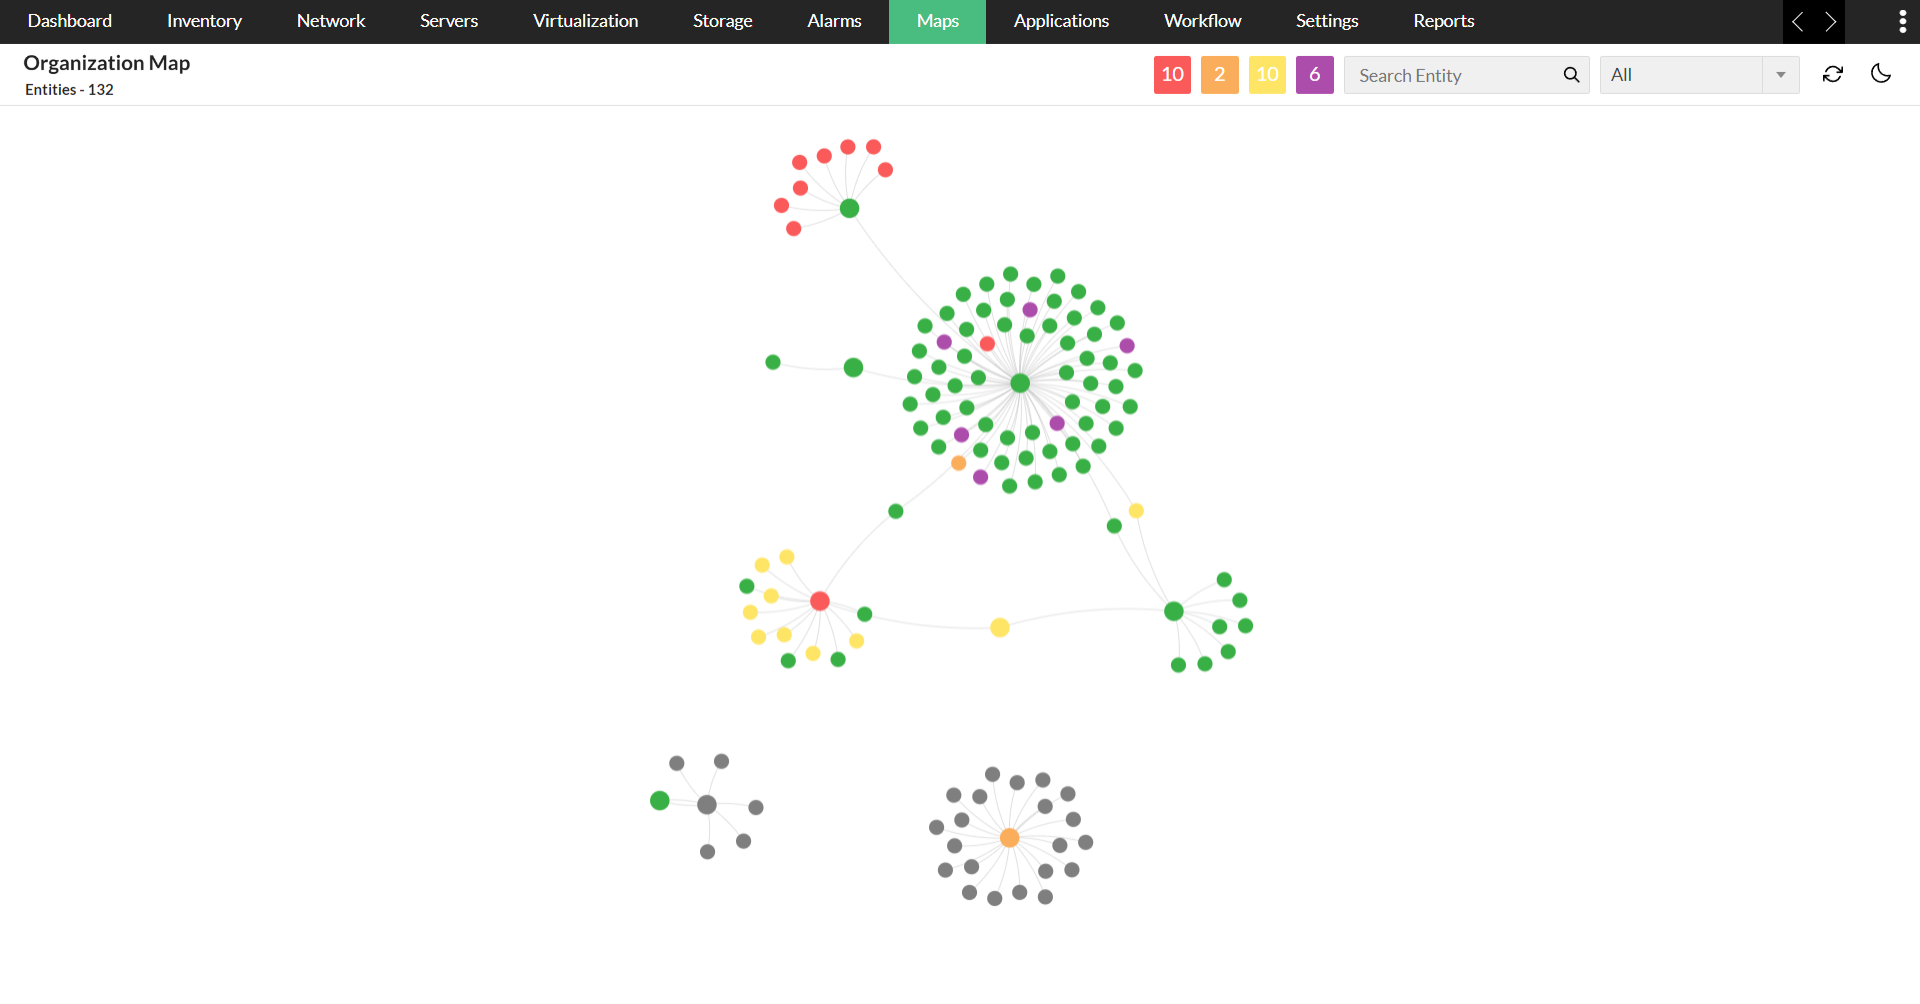
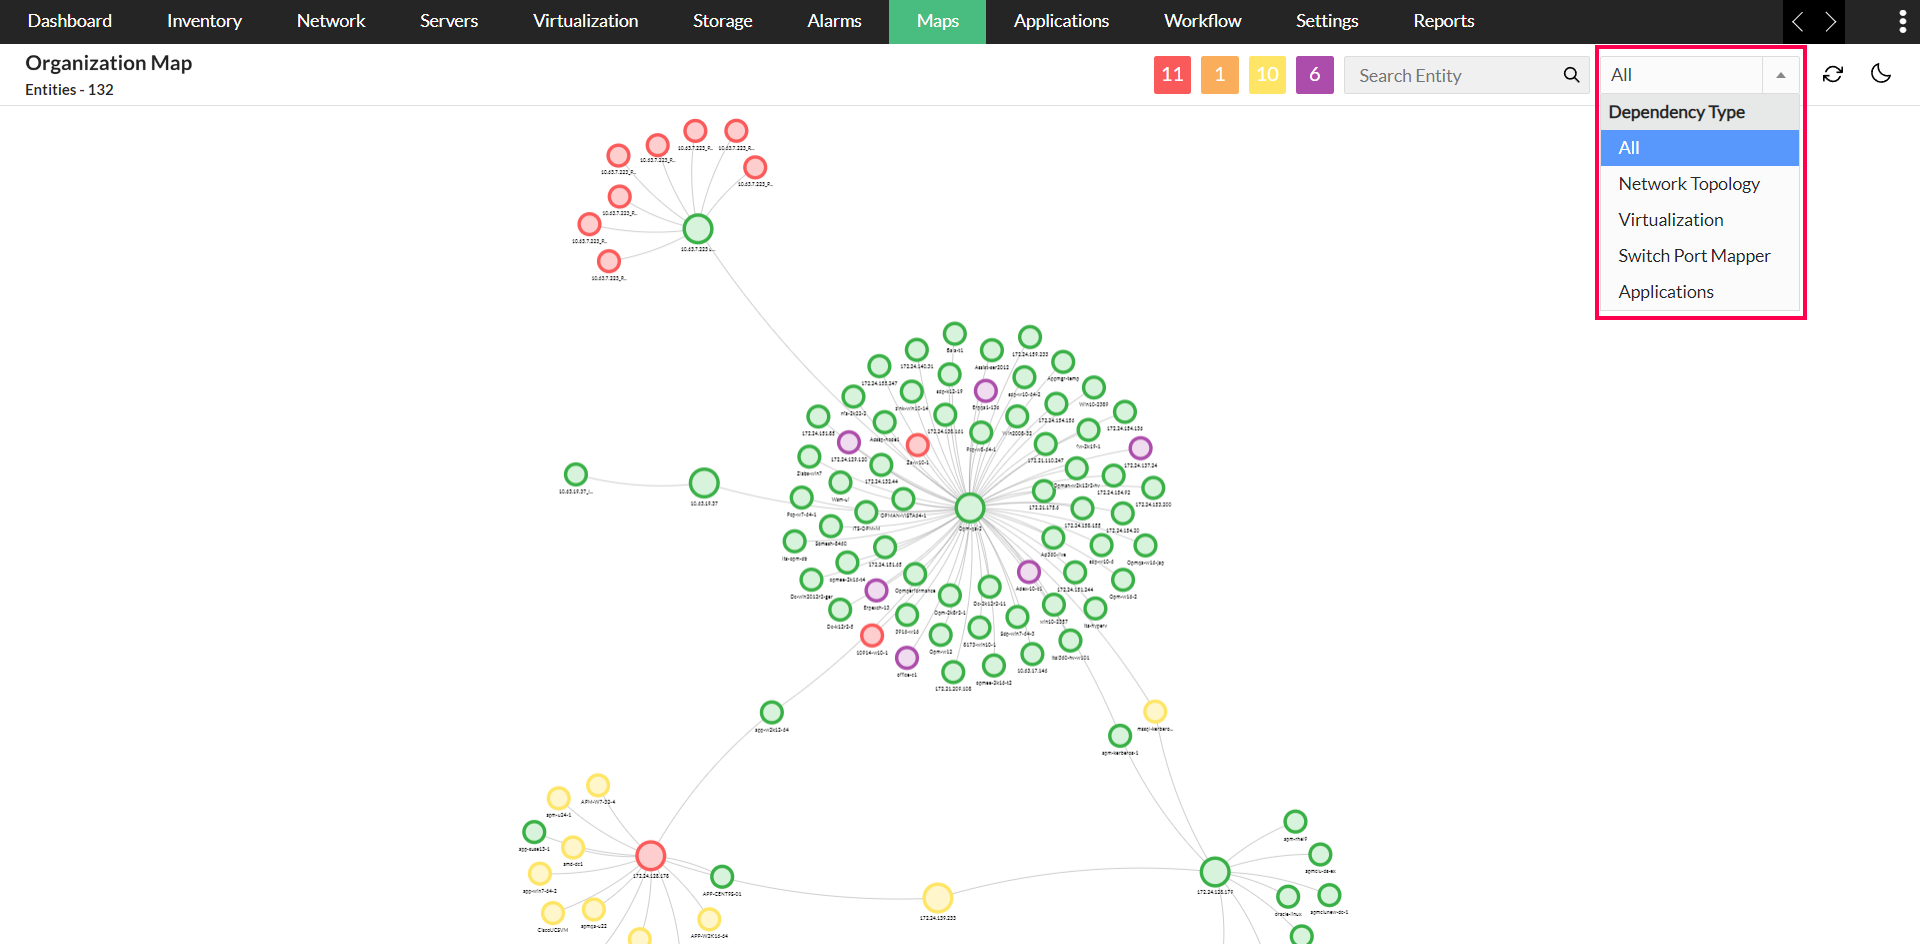
OpManager consolidates all of this data—Layer 2, switch ports, virtualization, applications, and dependencies—into a single, interactive organization map. Whether you want the full view or prefer to analyze data module-by-module, the built-in filter option lets you switch views in seconds.
How Organization maps enhance network observability
OpManager’s Organization Maps take observability to the next level by offering a comprehensive, visual layout of your entire network. You get an at-a-glance view of:
- What’s running in your environment
- Where each component is located
- How devices and applications are interconnected
- Which areas are experiencing issues or lag
Need more detail? Just click on any device in the map to access its live status, including:
- Serial number
- IP address
- Device type & category
- Availability
- Packet loss
- Response time
- CPU & memory usage
By combining real-time device insights with a high-level network overview, Organization Maps in OpManager make it easier to detect issues, track dependencies, and maintain peak performance across your infrastructure.
Use Case: Visualizing critical application paths in a data center
Scenario:
An enterprise runs several mission-critical applications (e.g., ERP, CRM, internal tools) hosted within a central data center. Each application depends on a stack of components — servers, switches, firewalls, and storage — all interconnected.
Challenge:
When application performance degrades, the IT team struggles to quickly trace dependencies across the network stack. Manually identifying affected components takes time and increases the risk of prolonged outages.
How OpManager Nexus helps with Organization Maps:
- Create logical application views: With Organization Maps, the admin can quickly identify the critical app — visually grouping its backend servers, network devices, and storage systems in the exact order they interact.
- Instant Fault Identification: If a server or switch in the path fails, its icon on the map changes color (e.g., red for down). This lets the admin instantly spot the exact layer in the app flow where the problem exists.
- Faster Troubleshooting & Better Clarity: Instead of hopping through multiple dashboards, the team gets a clear, end-to-end path visualization, helping them resolve issues faster and prevent escalation.
Bottom line:
With Organization Maps, IT teams gain clear observability into application-specific infrastructure paths, reducing downtime and improving the reliability of business-critical services.
How to fast-track fault resolution with Organization Maps
Spot issues instantly with visual alerts:
When a network fault occurs, Organization Maps highlight problem areas using severity-based color codes like Attention, Trouble, and Critical—configured via Severity Settings. This visual cue helps you quickly pinpoint the affected devices. You can even filter the view to show only critical devices, so you can focus on what matters most.
Drill down into device-level insights:
Click on any faulty device to access a quick summary, recent alarms, and the observability stack, which displays the device's dependencies across the organization. This helps you assess the impact, investigate root causes, and take timely action to prevent cascading failures.
Go deeper with detailed fault analysis:
Need more details? Simply click the device name to access its full snapshot page. Here, you can dive into performance data, logs, and metrics to troubleshoot, manage faults, and ensure network stability—all from one place.


Syncing OpManager's Organization map with ServiceDesk plus (On-premise & Cloud)
Through its integration with ServiceDesk Plus On-premise and Cloud, OpManager syncs critical infrastructure data such as devices, IP addresses, categories, and their relationships like uplink, Layer 2, virtual, and ADDM, into the ITSM platform. OpManager transfers organization map's data to the ServiceDesk Plus editions, allowing IT teams to visualize devices and their relationships, and streamline fault isolation through this relationship mapping. Learn more about syncing relationships to SDP (On-premise & Cloud).
Organization Map for Enterprise Edition
With OpManager's Enterprise Edition, you gain a centralized organization map that brings together device data from multiple geographically distributed locations. Each remote site (or probe) has its own unique network layout, and OpManager smartly merges all these individual Layer 2 maps into one comprehensive view on the central server.
This gives IT admins full visibility into the entire infrastructure, making it easier to manage distributed networks, spot issues faster, and maintain consistent uptime across locations.
FAQs
1. How frequently is the organization map updated?
The map is first updated one hour after OpManager's initial installation. Subsequent refreshes occur once every six hours automatically.
2. Can I refresh the Organization Map manually?
Yes, the organization map can be refreshed manually. Click the Re-Build Map option in the top-right corner of the map and wait while OpManager rebuilds the map.