
Trusted by leading enterprises across the globe


Connect infrastructure insights to service performance
Integrating performance insights with ServiceDesk Plus means instant context for incidents and changes. Reduce manual investigation and accelerate time to resolution with correlated, relevant data.
End-to-end visibility
Centralize incident and monitoring data across your entire IT stack into a unified dashboard. Empower IT operations teams with real-time insights into service health and infrastructure performance, significantly improving decision-making capabilities. Achieve superior operational control by consolidating critical information into a single platform for efficient incident management and resolution.
Automated incident resolution
Configure adaptive alarms to automatically generate incidents. Cut down alarm floods and false positives from flooding your service management solution with ML-powered adaptive thresholds. Trigger predefined workflows or automated remediation actions directly from monitoring events to swiftly resolve common issues—sometimes before users are even aware.
Enhanced collaboration
Tear down barriers between monitoring and IT service teams. Share real-time context and collaborate directly within ServiceDesk Plus to accelerate incident resolution and improve service quality. Shared context around incidents allows for faster handoffs, clearer communication, and joint troubleshooting, resulting in quicker resolution and reduced service disruption.
Drive faster resolutions with real-time incident contexts
With the seamless integration, Applications Manager and ServiceDesk Plus work together to synchronize resources and CIs. Whenever a monitor in Applications Manager triggers an alarm, a corresponding ticket is automatically created in ServiceDesk Plus. These tickets are comprehensive, containing all relevant monitored data, meta information, and the cause of the alarm. This guarantees that when users report an issue, technicians have all the necessary information to effectively diagnose and resolve it.
Manage alarms and tickets in one place
Instantly push ticket requests for every incidents or alarm events generated from Applications Manager into ServiceDesk Plus. Automatically sync alarms with the corresponding tickets logged into ServiceDesk Plus and track their progression from a single console. Detect and capture alarms from the affected monitors in the tickets along with technician notes and other crucial information for swift incident analysis and resolution.

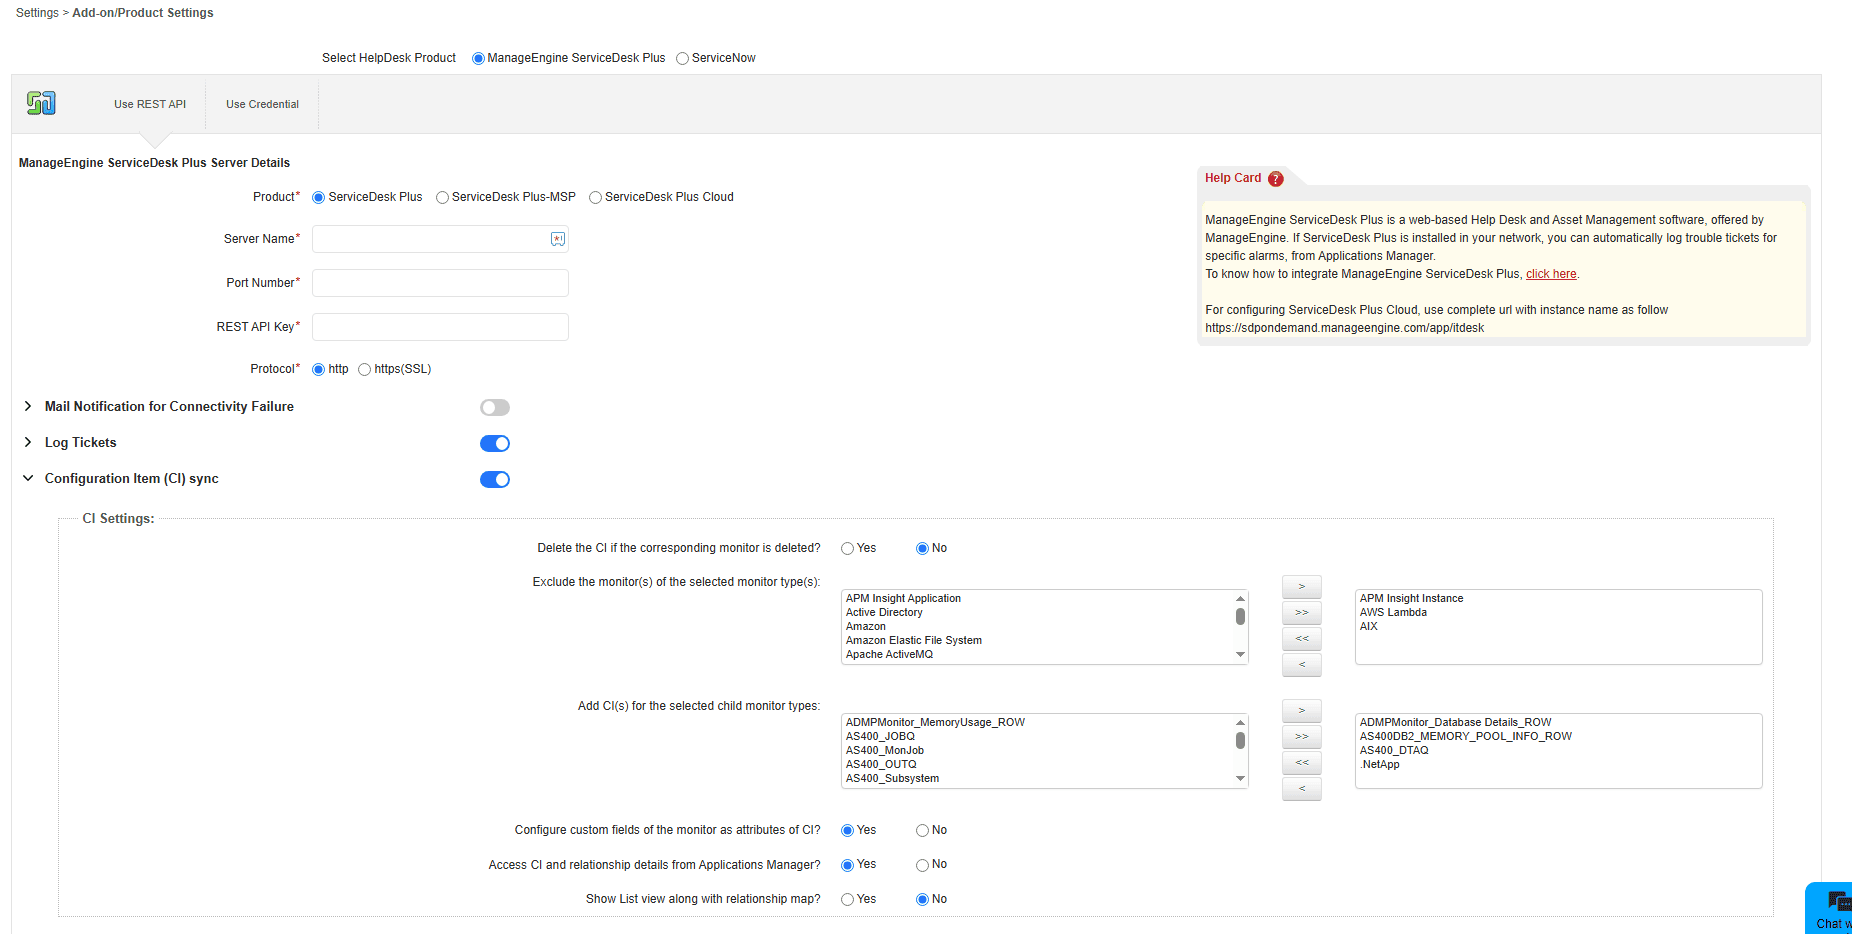
Simplify asset and configuration management
Identify resource components monitored by Applications Manager and categorize them in ServiceDesk Plus with contextual insights. Map the relationships between monitored resources and track all the pending requests, problems, and changes raised for those resources with real-time sync. Newly added resource monitors, their dependencies, and metadata are updated in ServiceDesk Plus while unmanaged monitors are removed.
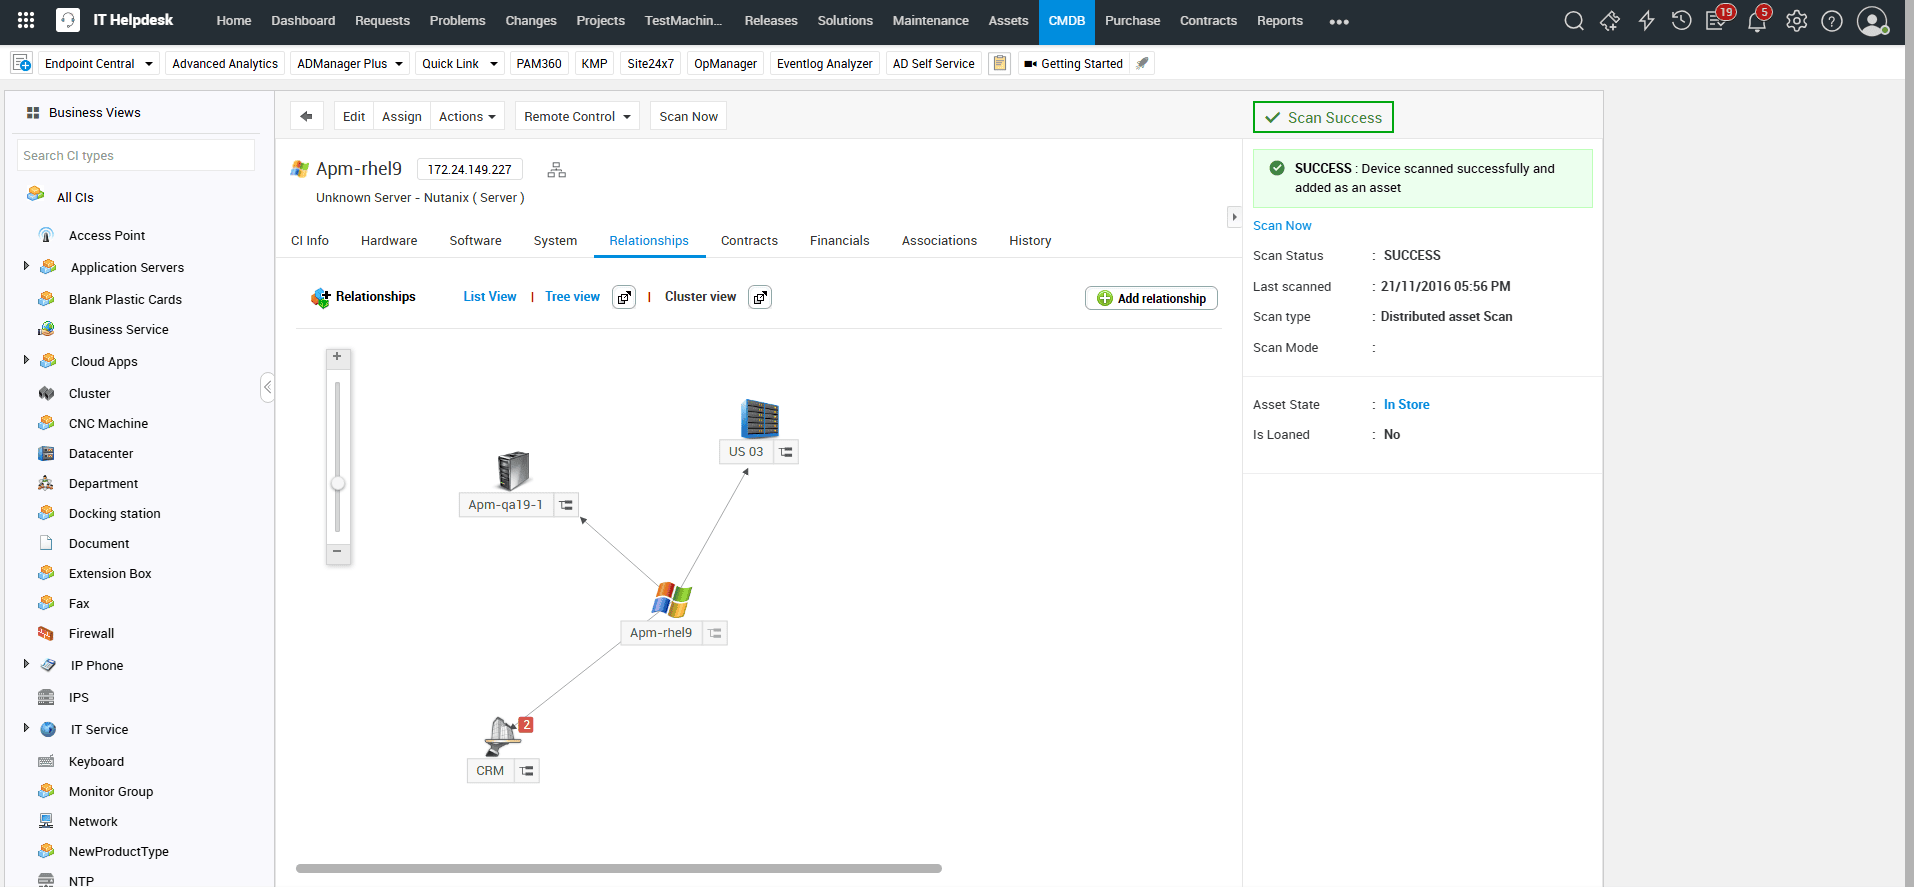
Visualize dependencies between resources
Map relationships between servers, VMs, applications, and databases present in your infrastructure and sync them with ServiceDesk Plus's relationship maps for technicians to perform quick performance impact analysis. Isolate affected resources, troubleshoot issues, and perform deep root cause analysis with ease, be it planned maintenance or unplanned outages.

Plan maintenance without downtime surprises
When users submit planned maintenance or asset change requests, Applications Manager offers a solution to prevent excessive alarm notifications through its downtime scheduling feature. Users can specify the specific timeframe within which the monitored resources will be offline or impacted in ServiceDesk Plus. During this designated period, Applications Manager will temporarily pause monitoring of these devices to prevent any unnecessary alarms from being triggered.
Complete full-stack monitoring and observability under a single roof
Applications Manager provides full-stack application performance monitoring alongside infrastructure performance, all from a single, unified console. With deep visibility through logs, metrics, and distributed traces, you can quickly detect, isolate, and resolve performance issues across your entire IT stack. IT teams can eliminate fragmented IT monitoring tools and consolidate monitoring efforts into one platform—enhancing correlation, reducing complexity, and lowering overall monitoring costs.
