AWS ELB Monitoring
AWS Elastic Load Balancing (ELB) is a managed service that efficiently distributes incoming application traffic across multiple targets, such as Amazon EC2 instances. It dynamically scales resources up or down based on real-time traffic demands, ensuring optimal application performance and cost-effectiveness. Applications Manager's AWS ELB monitoring tool gives you the power to ensure optimal performance and availability of your AWS Elastic Load Balancers. It provides in-depth visibility into key metrics, actionable insights, and proactive troubleshooting capabilities. AWS ELB supports three types of load balancers, namely: Application Load Balancers, Network Load Balancers, and Gateway Load Balancers.
- The Application Load Balancer handles advanced traffic routing from other services or containers at the application level.
- The Network Load Balancer is ideal for load balancing TCP traffic and is capable of handling millions of requests per second while maintaining low latencies.
- The Gateway Load Balancer simplifies the deployment and management of virtual appliances like firewalls and intrusion detection systems by distributing and scaling traffic.
Real-time monitoring of key metrics allows you to maintain a healthy load balancing environment, ensuring optimal performance and user experience. Here's how:
Gather real-time ELB performance data with Applications Manager's AWS ELB monitoring tool.
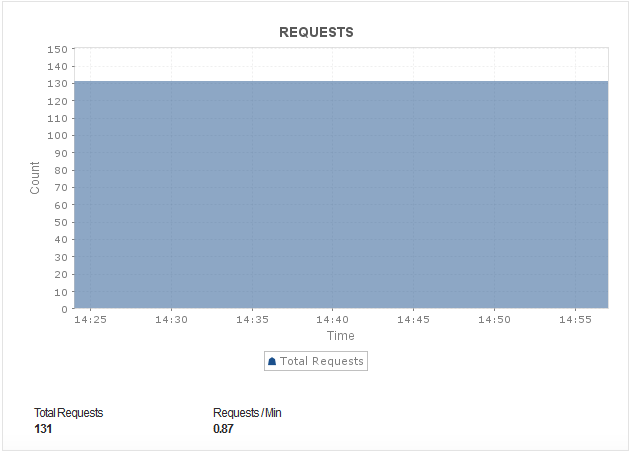
Get basic data about the number of healthy hosts, latency, requests, error rates and more. These metrics can be plotted on dashboards, and you can create basic threshold-type alerts. Ensure traffic is evenly distributed across healthy targets, maximizing resource utilization and preventing overloading individual instances. Applications Manager's AWS ELB monitoring service empowers you to handle traffic routing for specific situations and IP addresses when multiple connections are opened in order to handle increased requests as needed. Monitor the connections count of each availability zone to maintain high availability and resilience. Get instant notifications of performance issues and bottlenecks so you can take quick remedial action before your end-users experience issues.

Analyze connection count statistics
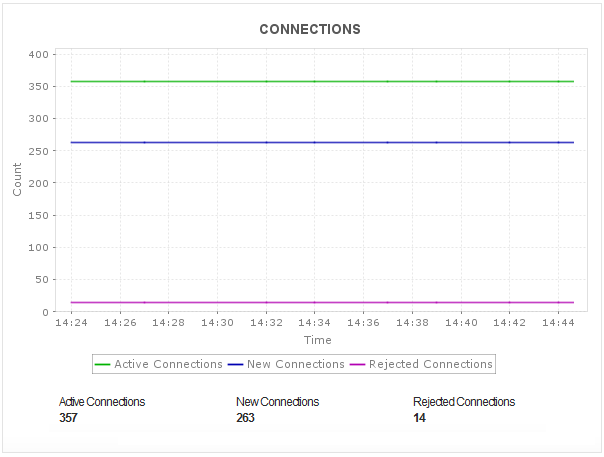
Monitor AWS Elastic Load Balancer performance by keeping an eye on the number of rejected connections to follow your ELB's ability to properly connect to a target and route a request. Measure the number of rules and bytes processed by the Application ELB. Applications Manager's ELB monitoring tool enables you to gain insight into several performance stats like the number of concurrent (active and new) connections between clients and load balancer and, between the load balancer and targets.

Track healthy and unhealthy host count
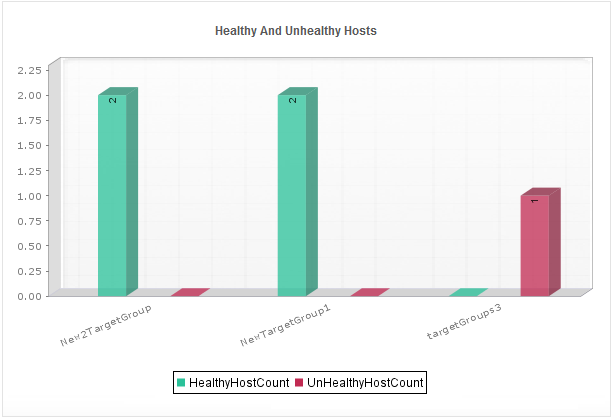
Use Applications Manager's ELB monitoring tool to monitor the number of healthy targets registered with the Application Elastic Load Balancer. Maintain a Healthy Host Count by tracking healthy instances. A reduced number of registered healthy hosts can increase latency, so set up alerts to make sure you have enough healthy instances to service incoming requests.

Troubleshoot and monitor target HTTP error response codes
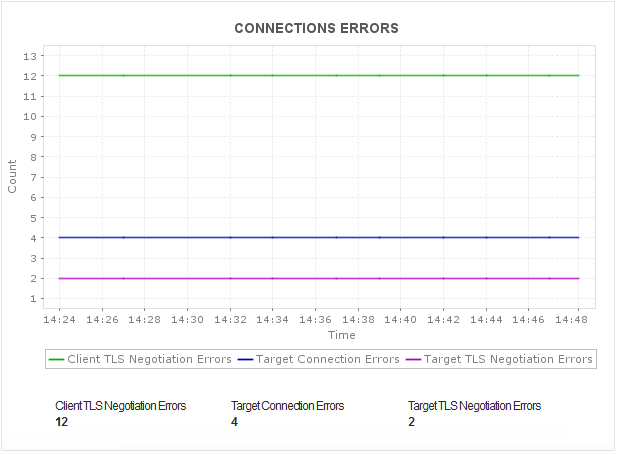
Applications Manager's ELB monitoring tool gathers statistics on the number of Client and Server errors generated by the load balancer. With it, you can measure the number of TLS connections that could not successfully establish a session between your load balancer and its registered instances. Identify potential causes for the error and set up alerts to let you know when your back-end servers are generating these errors. Review your application logs for the corresponding time to troubleshoot the problem.
Get an aggregate of HTTP 4XX and 5XX error codes generated by the targets in your group. Fix back-end connection errors and drill down to identify whether if an instance or an availability zone is the source of the issue.

Detect real-time performance issues and fix them faster
Visualize your entire ELB environment, including Application and Network Load Balancers, with a clear and concise overview of their configurations and health status in our Elastic Load Balancer monitoring dashboard. Understand the scalability of your ELB system and get a jumpstart on monitoring ELB in AWS like the Application, Network, and Gateway Load Balancers in your environment. Adapt to traffic fluctuations in AWS ELB by automatically adding or removing instances based on demand, preventing performance degradation. Applications Manager's AWS Elastic Load Balancing monitoring system provides the ability to monitor your ELB configuration with detailed metrics about the requests made to your load balancers.
Monitor a wide range of Amazon Web Services
With Applications Manager's AWS monitoring tool, you gain system-wide visibility into resource utilization, application performance, and operational health of your AWS infrastructure and application performance. In addition, it also features the capability to keep a close watch on your ECS instances with AWS ECS monitoring and your Lambda service with AWS Lambda monitoring.
Want to get started with your own AWS ELB monitor?
Start monitoring your AWS environment along with all the cloud instances with a 30-day free trial of Applications Manager. Download now!

