AWS Application Performance Monitoring
Ensure peak performance for your AWS applications
Amazon Web Services (AWS) provides a scalable and flexible environment for hosting mission-critical applications. However, this flexibility also introduces significant complexity. Applications in AWS often utilize a wide array of services, such as EC2, RDS, Lambda, S3, ELB, and CloudFront. As a result, performance bottlenecks can emerge at any point within this complex ecosystem.
ManageEngine Applications Manager simplifies the monitoring of AWS workloads through its AWS application performance monitoring feature, which offers comprehensive, end-to-end visibility.
Why monitor AWS applications?
Monitoring applications hosted on Amazon Web Services (AWS) is essential for several reasons, driven by the unique characteristics of cloud environments.
Dynamic environments
AWS provides services like auto-scaling and serverless functions (e.g., Lambda) that allow your infrastructure to grow and shrink on demand. While this is highly efficient, it makes traditional, static monitoring insufficient. You need a monitoring solution that can automatically discover and track these dynamic resources as they are created and terminated.
Distributed architectures
Modern cloud-native applications are rarely monolithic. They are often built as distributed systems that rely on a mix of services, such as EC2 instances, managed databases like RDS, APIs, and storage services like S3, which can be spread across multiple regions. This distributed nature makes it challenging to pinpoint the source of a performance issue without a tool that provides a unified, end-to-end view.
User expectations
In today's digital economy, users expect applications to be fast and always available. Downtime or slow performance can directly impact your business, leading to lost revenue, decreased customer satisfaction, and damage to your brand reputation. Proactive monitoring helps you detect and fix performance issues before they cause a negative user experience.
Shared responsibility
AWS operates on a "shared responsibility model." While AWS is responsible for the security of the cloud (the underlying infrastructure), you, as the customer, are responsible for security in the cloud. This principle also applies to performance. AWS provides tools to monitor the health of its services, but you are responsible for monitoring the performance of your applications that run on top of that infrastructure. An effective APM tool is critical for fulfilling this responsibility.
AWS application performance monitoring with Applications Manager
ManageEngine Applications Manager is a robust and multifaceted solution designed to go far beyond the capabilities of a simple AWS monitoring tool. It is a holistic application performance monitoring (APM) platform that provides deep, actionable insights across your entire IT landscape, encompassing on-premises, hybrid, and cloud-native environments.
Applications Manager supports AWS applications built on the following platforms:
Here is a breakdown of the key capabilities that make Applications Manager a comprehensive and versatile monitoring solution:
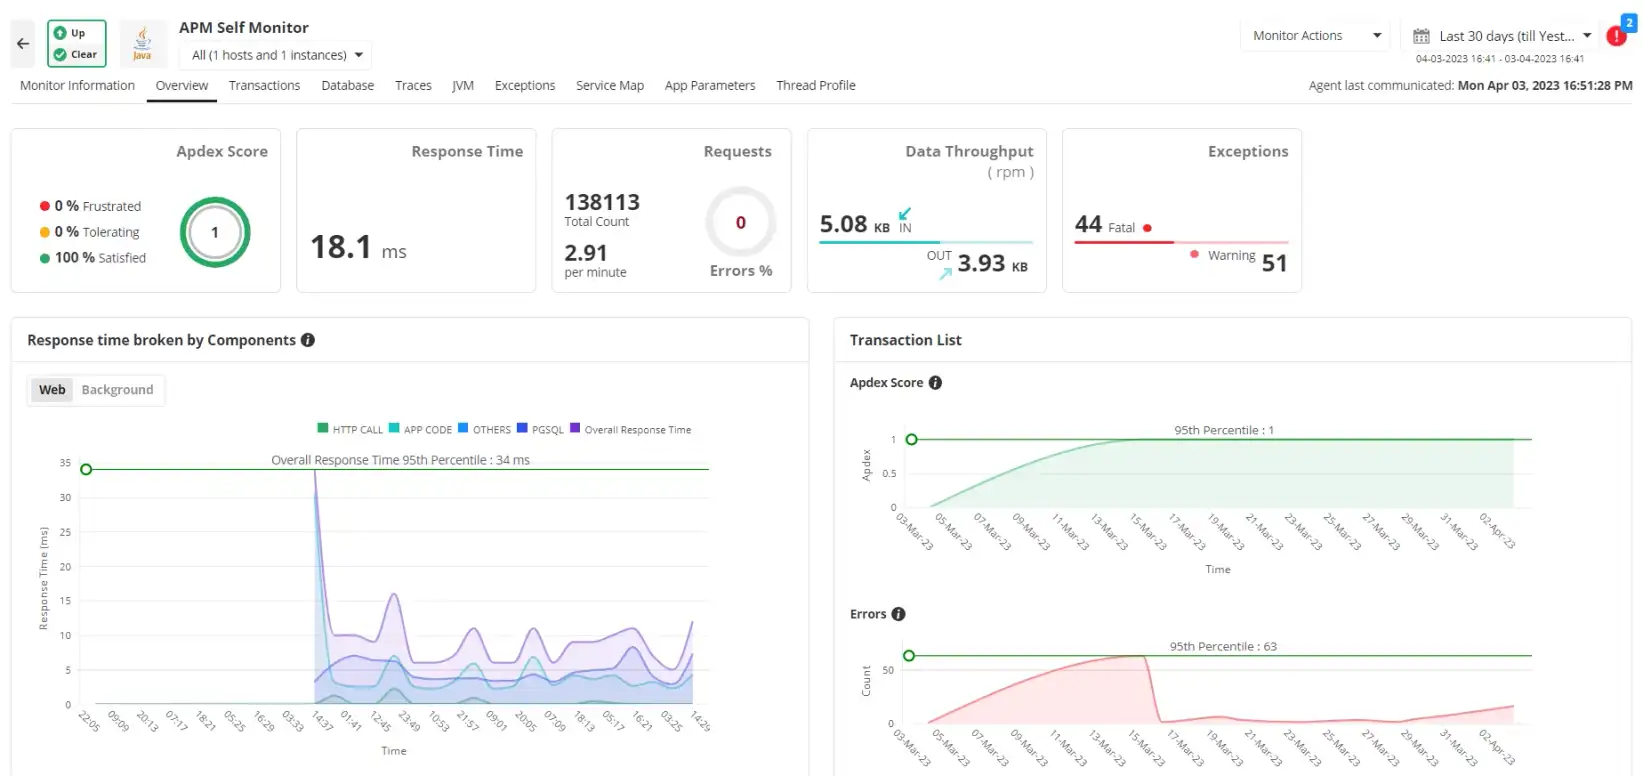
- In-depth application performance tracking: It provides full visibility into your applications, from low-level code details to the overall health of the entire system. An APM tool with real-time error detection works by instrumenting your application with agents or code snippets. These agents are designed to instantly capture any application errors, such as uncaught exceptions, HTTP 500 errors, or database connection failures. When an error occurs, the agent immediately sends a detailed report to the monitoring platform, which includes:
- A full stack trace: Pinpointing the exact line of code where the error occurred.
- Request details: Information about the user's request, including the URL, parameters, and headers.
- System context: Data about the server, memory, and CPU at the time of the error.
- Session data: Insights into the user's journey leading up to the error.
- Distributed transaction tracing: Applications are often built using a microservices architecture, where a single user request might trigger calls to a dozen different services, each running on a different server or within a different container. Distributed tracing provides a visual map of its entire journey enabling you to trace requests as they move across various AWS services and other distributed systems. This helps pinpoint the exact source of delays.
- Real-time error detection: The tool proactively detects and helps you resolve application errors as they occur, preventing them from impacting your users.
- End-user experience monitoring: It measures key metrics like page load times, transaction speeds, and error rates from different geographic locations to give you a true sense of user experience.
- Real User Monitoring (RUM): Gain real-world insights into how users are interacting with the front end of your applications. Understand performance variations based on a user's geographical location, device type (e.g., mobile vs. desktop), operating system, or browser to identify and fix performance bottlenecks that may only be affecting a specific segment of your audience.
- Synthetic monitoring: Find and fix performance issues, downtime, or broken features before they impact your actual users by running simulated transactions at regular intervals. Unlike Real User Monitoring (RUM), which requires real traffic, synthetic monitoring can be used to test new features or applications in pre-production or staging environments before they are released to the public.
- Hybrid cloud monitoring: The platform can monitor your AWS workloads seamlessly alongside your on-premises and other cloud environments, such as Microsoft Azure Cloud, Google Cloud Platform(GCP) and Oracle Cloud Interface(OCI) for a unified view.
- Application dependency mapping: Automatically visualize the relationships between your services, APIs, and databases, which significantly speeds up troubleshooting.
- Database performance monitoring: Trace slow database queries and optimize your database operations to boost overall application performance.
- Thread profiling: Identify and diagnose bottlenecks at the thread level within your application code. In multi-threaded applications, thread profiling is essential for detecting problems like deadlocks or excessive thread contention, where multiple threads are competing for the same resource, causing them to get stuck or significantly slowing down execution.
- Customizable dashboards: Create personalized dashboards tailored for different roles, such as IT, DevOps, or business stakeholders.
- AI-powered anomaly detection: Instead of relying on manually set rules, leverage machine learning to spot unusual performance patterns and potential issues that static thresholds might miss.
- Broad technology support: Monitor a wide range of technologies, from modern workloads like Kubernetes and AWS Lambda to legacy systems like IBM AS/400, all within a single platform.
Benefits of using Applications Manager for AWS APM
Using ManageEngine Applications Manager for AWS APM offers a host of benefits that go beyond basic monitoring. Its comprehensive approach to performance management helps businesses optimize their AWS workloads for peak performance, reliability, and cost-efficiency.
Single pane of glass
Modern IT environments are often a complex mix of on-premises, hybrid, and multi-cloud systems. Applications Manager addresses this complexity by providing a unified, "single pane of glass" view. It centralizes monitoring data from your AWS services (like EC2, RDS, and Lambda) alongside all your other IT infrastructure, including servers, databases, and containers. This eliminates the need to switch between multiple monitoring tools, providing a holistic and comprehensive view of your entire application ecosystem from a single console. This unified visibility is critical for understanding the interdependencies between services and for fostering better collaboration between different teams.
Faster troubleshooting
When a performance issue arises, every second counts. Applications Manager drastically reduces troubleshooting time by providing deep, actionable insights. Its distributed transaction tracing allows you to follow a single request across various AWS services and microservices to pinpoint the exact source of a delay. Additionally, application dependency mapping automatically visualizes the relationships between different services, databases, and APIs. This visual context helps your team quickly understand the architecture and identify the root cause of a problem, leading to a significantly faster mean time to resolution (MTTR).
Improved uptime & reliability
Proactive monitoring is key to maintaining a seamless user experience. Applications Manager's AI-powered capabilities help you stay ahead of potential issues. It uses AI-powered anomaly detection to learn the normal behavior of your applications and infrastructure. This allows it to automatically spot unusual performance patterns and flag potential problems before they lead to service degradation or full-blown downtime. By receiving instant alerts for these anomalies, you can take corrective action before they impact your end-users, ensuring higher uptime and overall system reliability.
Optimized cloud costs
Cloud cost management is a significant challenge for many businesses. Applications Manager helps you optimize your AWS spending by providing detailed insights into resource utilization. The platform tracks key metrics for all your deployed services, allowing you to identify over-provisioned or underutilized resources. This data enables you to "right-size" your AWS instances and services, ensuring you're only paying for the resources you truly need. By aligning resource usage with actual demand, you can significantly reduce unnecessary cloud expenditures.
Enterprise-grade reporting
To effectively communicate performance data to all stakeholders, robust reporting is essential. Applications Manager provides flexible, advanced reporting features that can be customized to meet the needs of different teams. You can easily generate and schedule reports on SLA compliance, performance trends, and availability. These reports provide a clear, data-driven basis for making informed business decisions, ensuring that both technical and business leaders have the information they need to measure success, justify resource allocation, and plan for the future.
AWS performance monitoring with Applications Manager
ManageEngine Applications Manager provides native, out-of-the-box monitoring for all your critical AWS services. It gives you deep visibility into EC2 instance health, RDS query performance, and the efficiency of your Elastic Load Balancers. The tool also tracks metrics for S3 bucket utilization, CloudFront cache performance, and the execution details of your Lambda Functions. By consolidating all this information into a single platform, it simplifies AWS application performance management and helps you ensure your cloud workloads are always running at their best.
Why choose ManageEngine Applications Manager over native AWS monitoring?
While AWS CloudWatch is a powerful native tool that provides essential infrastructure metrics, ManageEngine Applications Manager offers a more complete and proactive solution for AWS application performance monitoring. It goes beyond basic infrastructure monitoring by providing deeper, more actionable insights that are critical for modern, dynamic cloud environments.
- Code-level performance visibility: CloudWatch excels at monitoring infrastructure metrics, but it doesn't provide granular visibility into the code itself. Applications Manager fills this gap by giving you code-level performance visibility, allowing you to trace transactions, profile threads, and pinpoint the exact function or line of code that is causing a bottleneck. This is crucial for developers and DevOps teams who need to move past high-level alerts and fix problems at their source.
- End-user experience insights: A true APM solution measures performance from the user's perspective. Applications Manager provides end-user experience insights by combining Real User Monitoring (RUM) and synthetic transactions. This lets you see how your application is performing for actual users across different geographies and browsers, while also proactively simulating critical user journeys to detect issues before they impact your customers. CloudWatch, on its own, does not offer these capabilities.
- Database and application dependency mapping: Modern applications are a complex web of interconnected services and databases. Applications Manager automatically maps these dependencies, providing a visual representation of how all your services are connected. This dependency mapping combined with distributed transaction tracing helps you quickly identify how a performance issue in one service or database is affecting your entire application, dramatically speeding up root cause analysis.
- AI-driven anomaly detection: Relying on static thresholds can lead to a flood of false-positive alerts. Applications Manager uses AI-driven anomaly detection to learn the normal behavior of your applications and identify truly unusual performance patterns. This intelligent approach reduces alert fatigue and allows your IT team to focus on legitimate problems, improving reliability and efficiency.
- Unified monitoring across 150+ technologies: For most businesses, applications don't live in a single cloud. Applications Manager provides a single pane of glass by offering unified monitoring across AWS, on-premises systems, and other cloud platforms. With support for over 150 technologies, it allows you to manage your entire hybrid IT landscape from one console, making it a complete solution that CloudWatch, as an AWS-specific tool, cannot match.
Take control of your AWS application performance today
Start monitoring your AWS applications with ManageEngine Applications Manager and gain the visibility you need to deliver faster, more reliable digital experiences. Download our 30-day free trial to experience our application performance management software first hand or schedule a demo call for a personalized touch.
