Applications Manager's real user monitoring (RUM) enables you to track the digital end user experience of your website from a real-world user's perspective. It tracks the real user's journey on your website in real-time by analyzing the performance of websites and web applications and provides actionable, data-driven insights to help you improve your website's digital end user experience based on real user feedback and behavior.
Applications Manager: The real user monitoring (RUM) software you need
Real user monitoring tools like Applications Manager enables you to get comprehensive insights into your website or web application performance with the help of our following real time user monitoring capabilities:
Real user application performance monitoring
Global website performance insights
Transaction performance analysis
User sessions insights
Platform-based performance tracking
Script error statistics
Gain real-time visibility into real user website performance
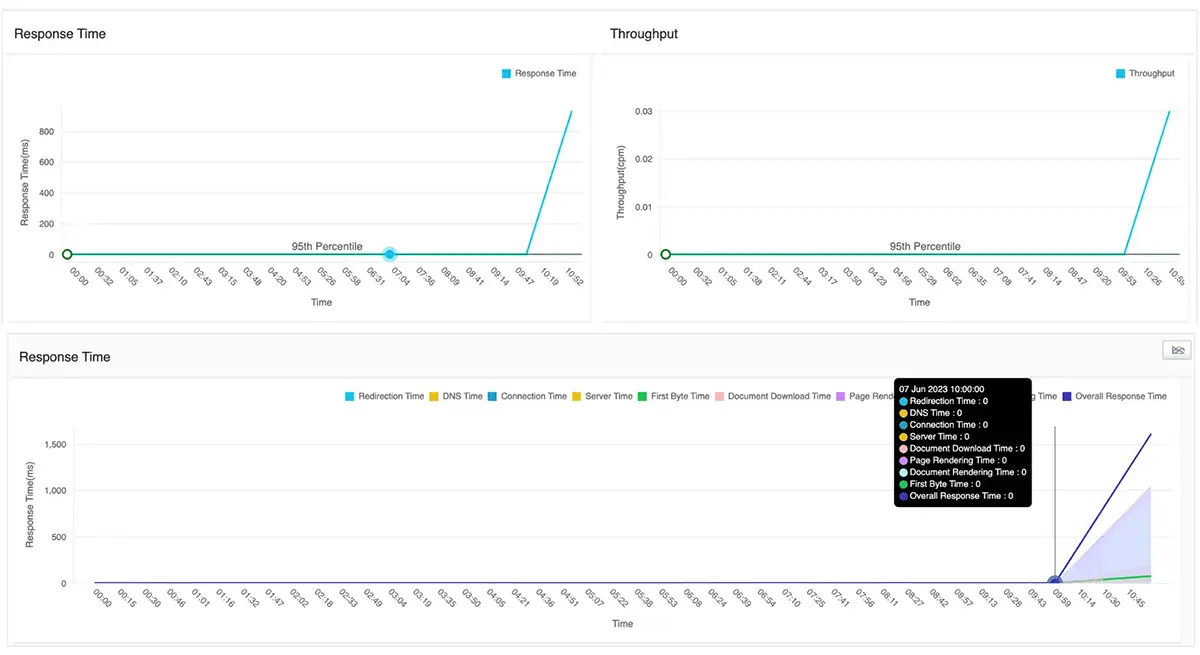
Get a holistic view into the performance of your website/web application based on Core Web Vitals from a real user's perspective. With Applications Manager's real user application monitoring, you can obtain a quick summary of how your website/web application is performing in real-time by keeping track of key RUM metrics such as Response Time, Page load time, Page Views, throughput and take corrective actions in case of abnormal values. Understand user satisfaction based on the Apdex score generated by the monitor to find out how your real users would be experiencing on your website. By correlating page load times and user satisfaction metrics, you can prioritize performance issues that directly affect engagement and conversion rates.
Identify geographic performance variations affecting user experience
Real user monitoring highlights performance variations across regions by analyzing real user data from different geographic locations. With Applications Manager's Real user monitoring tool, you can
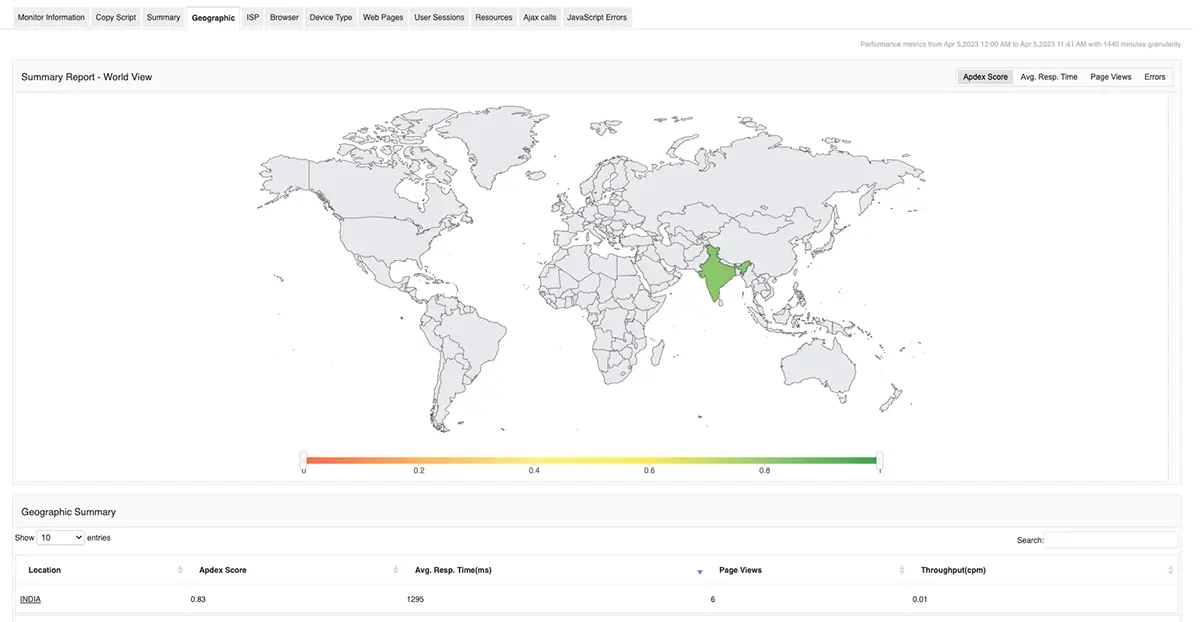
- Obtain a comprehensive overview of your website's performance based on different geographic locations in real-time.
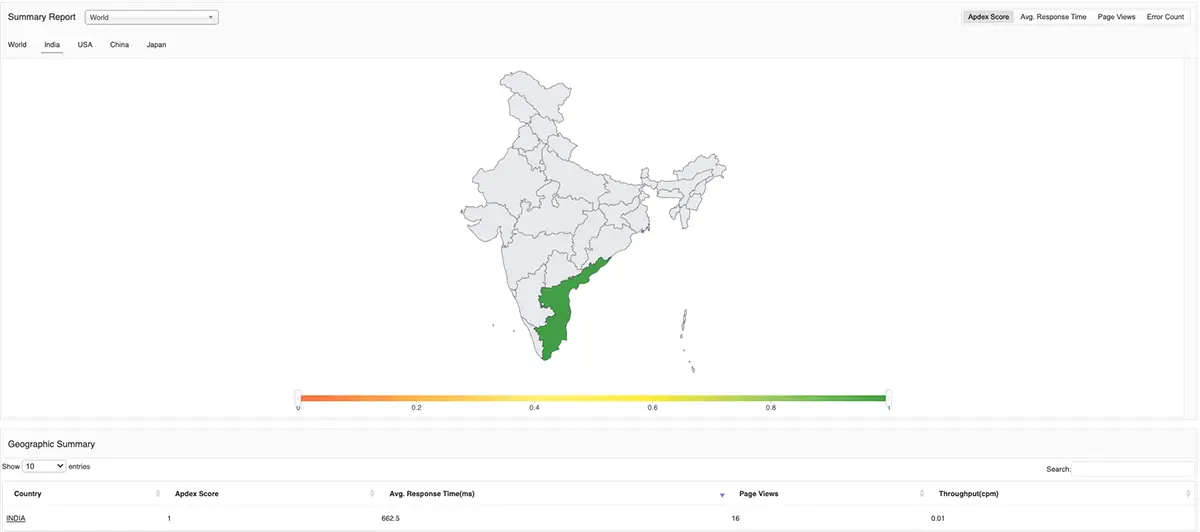
- Visualize how your website is performing across different countries on a world map to find out whether your users are happy or frustrated with the website experience.
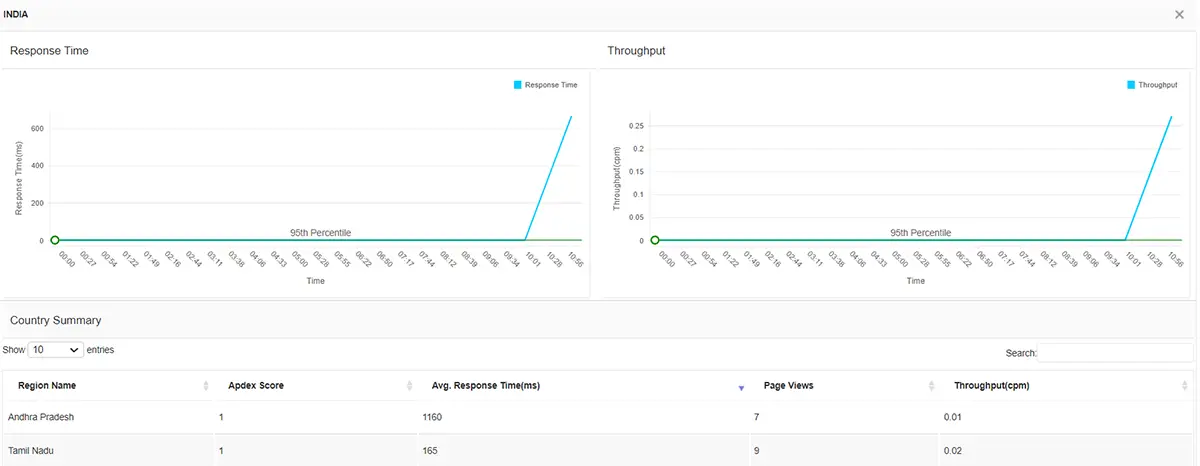
- Quickly identify locations where users are affected with slow website performance based on Response Time, Page Views, Error count, and Throughput, drill down to the metric causing the issue, and take corrective actions to mitigate the issue for that location.
Identify transaction performance issues that impact user conversions
Monitoring transaction performance helps teams detect slow or failed user actions that can lead to abandoned checkouts, incomplete workflows, or customer frustration.
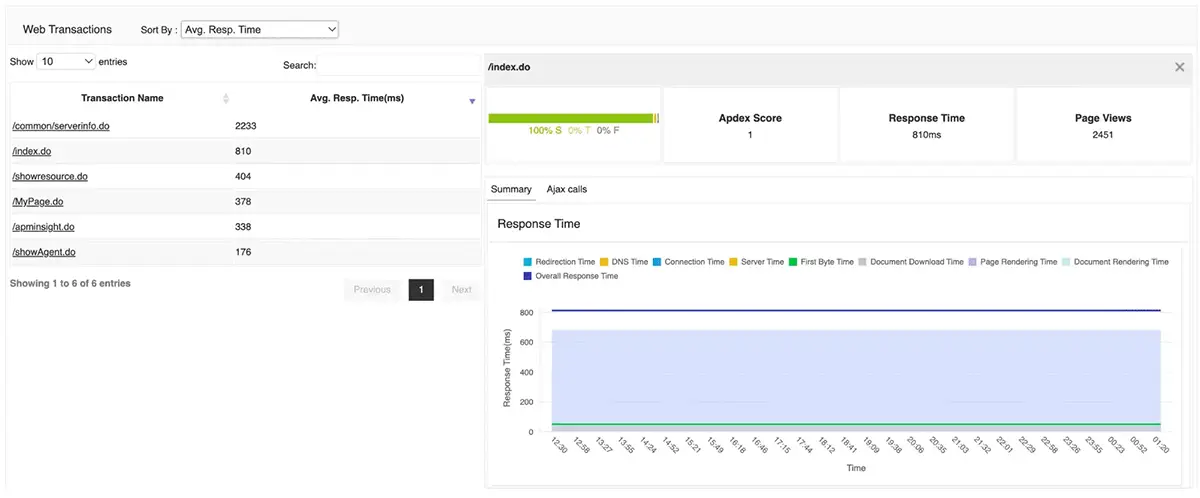
- Track the website journey of your real users by analyzing the performance of individual web transactions running on your website to have a clear picture of how your website is responding.
- Examine how your website is performing by measuring response time, page size, and throughput of your web transactions with clear insights.
- Keep a close watch on the number of page views for your website as well as the errors obtained for individual transactions to identify any potential issues that might occur and to resolve them before impacting end users.
Track user sessions on your website
Session-level insights help teams reconstruct real user journeys and isolate where users encounter delays, errors, or unexpected behavior.
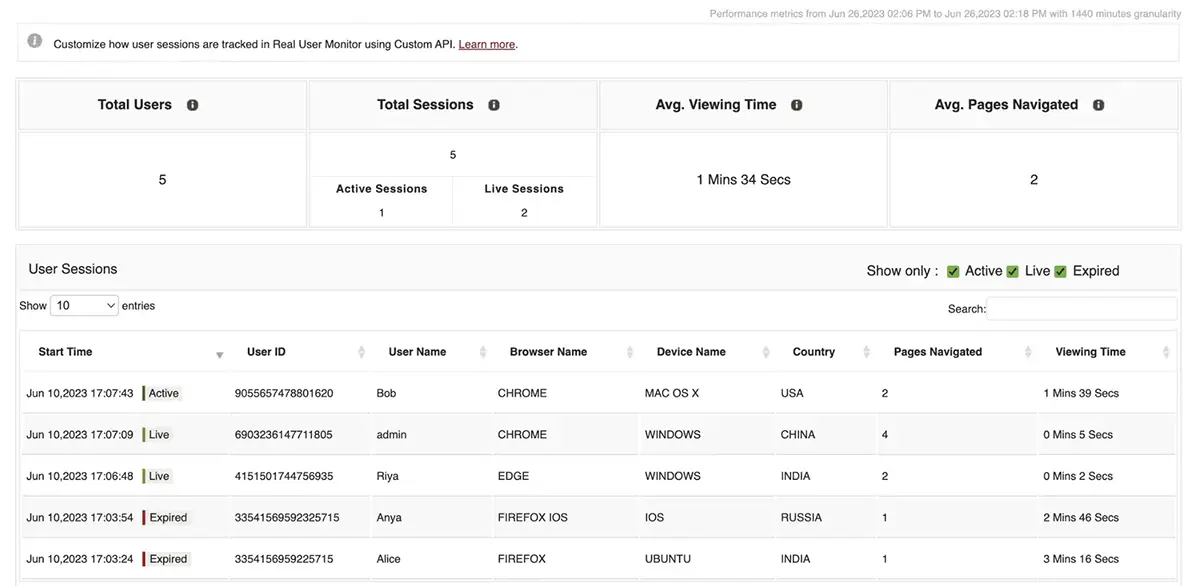
- Obtain deep insights into user sessions that are established by your real users while interacting with your website in real-time.
- Find out the number of user sessions that have connected to your website along with the status of each session to estimate the duration and quality of user sessions established with your website.
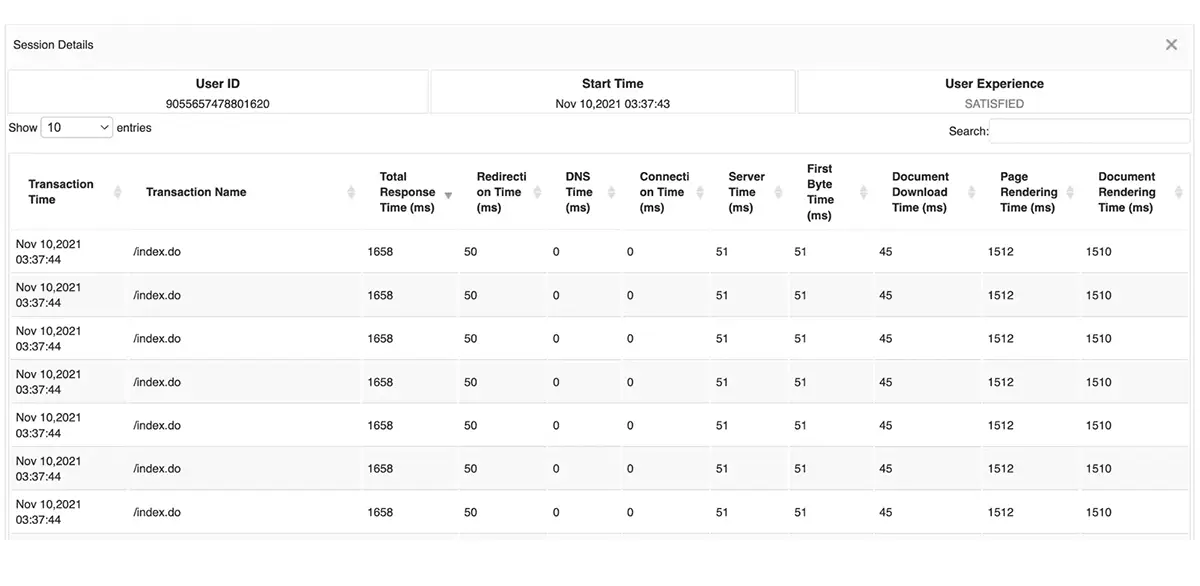
- Identify which session is causing slowness and drill down into individual user sessions to analyze the transaction that's causing the slowness based on key metrics such as page loading time, time spent on the website, number of pages visited with detailed stats on response time.
Optimize performance across browsers, devices, and platforms
Platform-level insights help ensure consistent user experience across modern browsers and devices, reducing performance regressions caused by environment-specific issues.
- Optimize the real user experience of your website based on performance on different platforms used by the end users.
- Obtain deep insights into how your website is responding on various browsers for real users by monitoring the response time, throughput, and the number of users accessing the browsers in real-time.
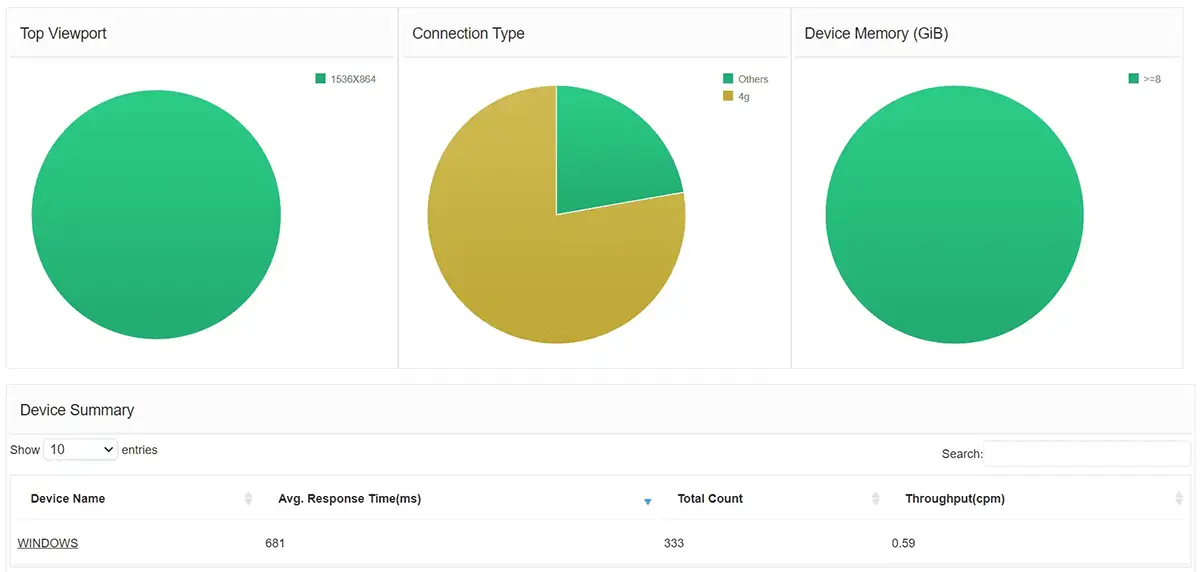
- Get detailed information on the real-time response of your website based on the devices that are used by your real users for interacting with your website.
- Obtain graphical information on the response time, screen viewport, connection type and memory for your devices to help you analyze the real user experience of your website accordingly.
Detect frontend script errors that affect application reliability
Frontend script errors can silently degrade user experience and application reliability without triggering traditional availability alerts.
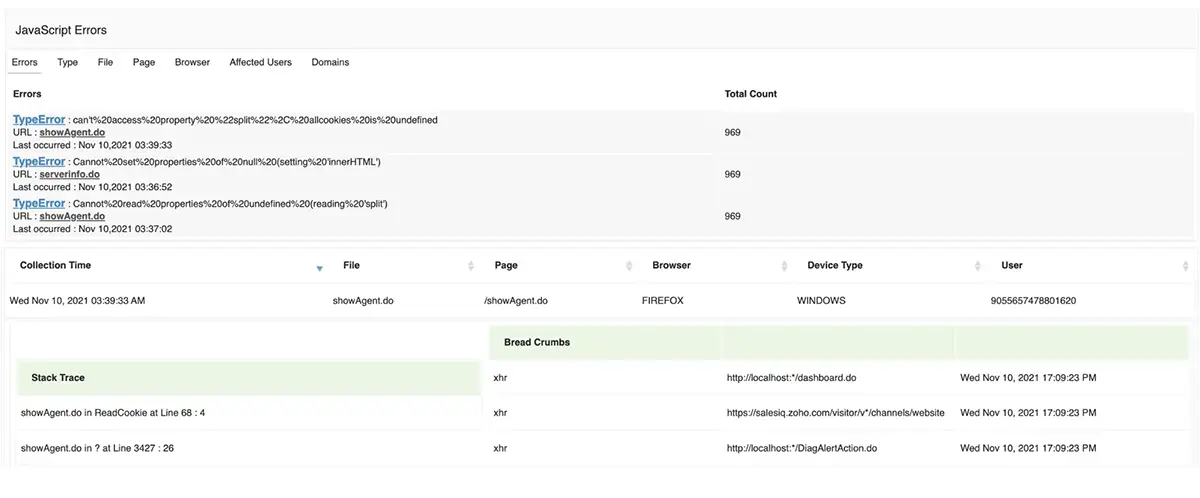
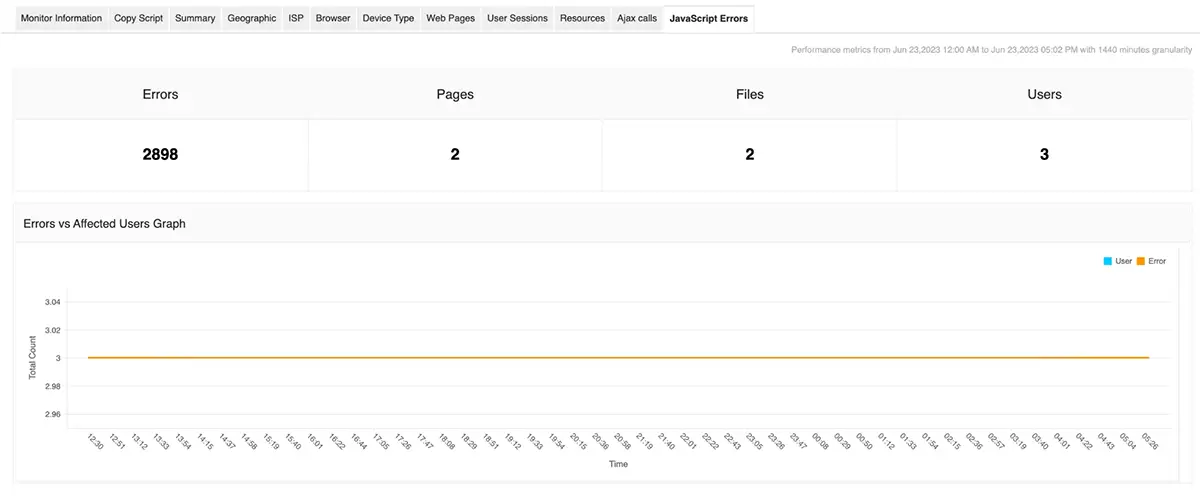
- Identify JavaScript errors that are impacting your website's performance in real time to troubleshoot and resolve them quickly.
- Get insights into the type of JS errors observed, including the count and timestamp of occurrence, along with detailed stats on the files, pages, browsers, domains, and users that are affected by the error to help you identify the root cause of the issue and troubleshoot them faster.
Use cases of real user monitoring
| Industry | How it is used | Business outcome |
|---|---|---|
| E-commerce and retail | Monitors checkout flows, page load performance, and peak traffic behavior. | Reduced cart abandonment and improved conversion rates. |
| Banking and financial services | Tracks transaction flows and regional or device-specific performance issues. | Seamless digital banking and higher online service adoption. |
| Healthcare | Identifies performance lags in telemedicine, portals, and booking systems. | Improved patient trust, reliability, and care outcomes. |
| Education and e-learning | Detects content delivery delays and virtual classroom performance issues. | Consistent learning experiences and higher engagement. |
| Travel and hospitality | Monitors booking and itinerary tools during high-demand periods. | Higher booking completion and smoother user journeys. |
| Media and entertainment | Identifies buffering, resolution, and recommendation performance issues. | Improved audience retention and revenue growth. |
| Logistics and transportation | Ensures reliability of tracking systems, driver apps, and customer portals. | Operational efficiency and stronger customer trust. |
| SaaS and technology | Analyzes user interactions across features, APIs, and onboarding flows. | Improved feature adoption, retention, and revenue. |
| Government and public services | Maintains availability of citizen portals and critical services. | Efficient service delivery and higher public satisfaction. |
Delivering Excellence in Real User Monitoring (RUM) is our top priority
Receive intelligent alerts
Be the first to know when there is a slight discrepancy in the real user experience of your website. Our ML-powered alerting approach cuts down the noise while alerting you on critical events. You can receive the alerts in a medium of your choice - email, text or Slack.
Customizable Dashboards
Powerful visualizations help you see your most relevant information at a glance. You can also create different dashboards for different teams based on your needs.
Visualize your website's real user performance and predict future performance growth trends with our intelligent forecast reporting feature.
Set up real user monitoring in minutes, not hours
Configure a real user monitor for your web application quickly without much fine tuning. The UI is easy to understand and does not need a big initial learning curve.
Simple, affordable pricing structure
Keep your costs in check even as your digital experience monitoringneeds to expand. Check our pricing options here.
Common questions asked on real user monitoring tool
What is Real User Monitoring?
Real User Monitoring is a unique technology that helps keep an eye on how people use websites or applications with the aid of insightful performance data. Since it is impossible to know the impact that real world factors would have on the application performance, real user monitoring gives IT and DevOps teams a better perspective of how their application is being experienced by real end users. It is a real user application performance monitoring solution that gives you a clear view of how fast and smooth a website or app is running, so you can make it even better for everyone using it.
Why is real user monitoring important?
Real User Monitoring lets you see and understand web applications and websites just like your actual users do. It helps you understand your website from an end-user's perspective, which makes it easier to find and fix problems. For instance, users that are using a certain ISP or browser might be facing issues while interacting with your web application. Through RUM monitoring, one can make optimizations to their application such that it performs better in different conditions.
How does real user monitoring (RUM) work?
RUM Performance Monitoring keeps an eye on your websites and web applications by measuring how fast your site loads, tracking user actions, and spotting any errors in the code. All this data is neatly presented in an easy-to-use interface, so you can analyze and improve your website with ease!
What is the difference between RBM and RUM?
Real browser monitoring (RBM) helps you test how your webpages work by imitating their actions on different web browsers and locations. It uses recordings to play back these actions on special agents called End User Monitoring (EUM) agents.
On the other hand, Real User Monitoring (RUM) lets you see how your websites are experienced by actual users in real-time, no matter where they are located in the world. It helps you understand how users perceive your websites and identify any issues they may encounter.
What is the difference between real user monitoring and synthetic monitoring?
Real User Monitoring (RUM) analyzes live user interactions for real-world performance insights. Synthetic Monitoring involves simulated tests to evaluate application performance and availability.
RUM identifies user-centric issues, while Synthetic Monitoring ensures proactive performance testing, helping prevent issues before impacting users. Learn more.
What are the limitations in real user monitoring (RUM)?
Real User Monitoring (RUM) depends on actual user interactions, so it cannot detect issues in low-traffic scenarios or predict potential problems proactively. It provides limited control over test conditions, lacks immediate insights for unvisited paths, and may miss identifying issues until users are impacted. RUM also requires significant data processing, which can be resource-intensive.
What are the benefits of real user monitoring (RUM)?
Real User Monitoring (RUM) offers actionable insights into actual user experiences, helping identify performance bottlenecks in real-world scenarios. It provides detailed metrics on load times, user behavior, and geographic impact. By capturing real-time data, RUM aids in optimizing application performance, improving user satisfaction, and ensuring better decision-making based on real usage patterns.
Are there any prerequisites for Applications Manager's RUM tool?
Yes, you will need to download the RUM agent to configure real-user monitoring. Don't worry, it's easy! Just click on this link and you'll be able to download it from there.
What is the licensing model for RUM Monitoring? Do I need to purchase it separately?
RUM will be available as a count based add-on module. It will work with both Professional and Enterprise editions of Applications Manager.
- When you use RUM Software to monitor your websites, each website will be counted as 1 monitor in your license. This helps you keep track of all your monitored websites easily.
- The price of RUM also depends on the Page views metric. Page views refer to the number of times your web pages are viewed by users. There will be a monthly limit for page views, and you'll be charged separately based on the tier you choose to purchase. This way, you can customize your plan according to your needs.
What is a PageView?
A PageView, also called an impression, happens whenever someone looks at a page on your website. Even if a person views the same page more than once or refreshes it and looks at it again, it still counts as a separate PageView. PageView gives the traffic count of the webpage.
The PageView metric is particularly useful in understanding the frequency at which the webpage is visited. Based on the amount of PageViews, one can also understand the value that the page has to offer its visitors. Webpages that do not offer much to its visitors tend to have lesser PageViews.
Why is Applications Manager the best real user monitoring tool?
- Round-the-clock user experience monitoring
- AI-powered alerting and forecast reporting
- Customizable dashboards and reports
- In-depth root cause analysis (RCA) for troubleshooting
- Service-level agreement (SLA) reports
- Support for third-party integrations
