Why PostgreSQL monitoring is essential for performance and reliability
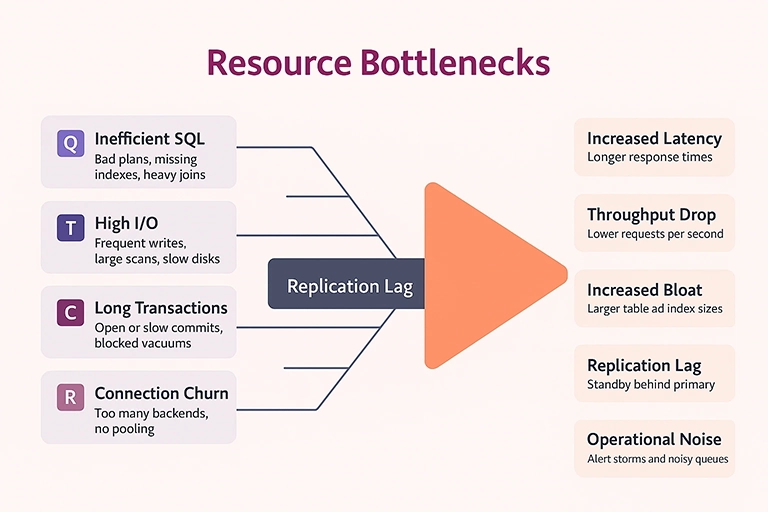
PostgreSQL exposes hundreds of metrics. The real value comes from understanding how metrics interact. For example, a CPU spike may be caused by a slow hash join. A storage bottleneck can follow infrequent autovacuum runs. Query latency can originate from lock contention. Structured monitoring reveals these relationships and turns troubleshooting into a deterministic process.
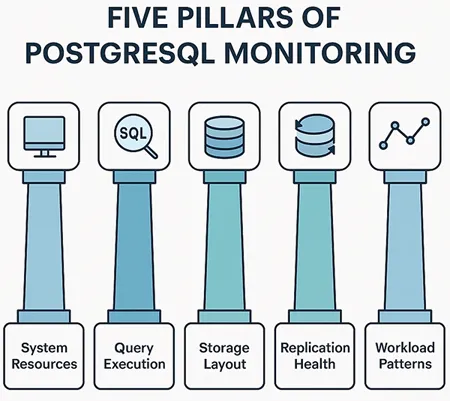
Five key monitoring areas
- System level performance
- Query and connection behavior
- Storage layout and data health
- Replication and high availability
- Application and workload trends
Monitoring across these layers gives teams the visibility needed to find root causes quickly.

1. Monitoring system performance
Every PostgreSQL workload depends on stable system performance. Resource pressure at the operating system level can directly affect query responsiveness, commit times, and cache utilization.
CPU activity
High CPU usage by itself is not a problem, but sustained saturation often indicates deeper issues such as missing indexes or inefficient query plans. Monitoring CPU utilization alongside active sessions and query types helps map performance variations to workload changes.
Memory usage
PostgreSQL uses shared buffers, work memory, and maintenance memory to manage caching, sorting, and maintenance operations. When memory limits are reached, queries spill to disk, which slows down response times. Tracking memory consumption along with temporary file creation provides early visibility into memory pressure.
Disk performance
Storage latency affects nearly every aspect of PostgreSQL performance. High read latency signals poor cache efficiency or slow storage devices, while high write latency affects WAL commits and checkpoint operations. Monitoring IOPS, queue depth, and disk throughput helps identify storage imbalances before they escalate.
2. Monitoring queries and connections
Query behavior reveals how PostgreSQL responds to real workloads. Monitoring queries helps teams detect inefficient SQL, concurrency problems, and unexpected execution patterns.
Query execution trends
Tracking slow queries, frequently executed queries, and high resource consuming queries makes it easier to identify tuning opportunities. Variations in query timing are especially useful because they highlight factors such as caching differences, plan changes, or write contention.
Wait events
PostgreSQL includes detailed wait events that describe what each backend is waiting for. Some common categories include:
- Lock waits, which highlight concurrency challenges
- I/O waits, which suggest disk dependency
Connection patterns
Many performance issues originate from inefficient connection handling. Excessive connection churn, missing connection pooling, or long lived idle sessions can impact throughput. Monitoring connection creation, active backends, and average session duration provides insight into application behavior under load.

3. Monitoring storage layout and data health
Storage efficiency influences read speed, indexing, and cache utilization. PostgreSQL uses MVCC, so data can grow even when row counts remain stable. Monitoring storage patterns ensures long term consistency and performance.
Table and index growth
Monitoring the growth rate of tables and indexes helps identify whether increases are due to genuine data expansion or internal churn. Indexes should be monitored separately since their growth does not always match table growth. Sudden increases often signal missing autovacuum cycles or inefficient update patterns.
Bloat and autovacuum activity
Dead tuples and index bloat slow down both reads and writes. Autovacuum helps manage this, but it must run frequently enough to keep up with workload changes. Monitoring bloat, vacuum frequency, and vacuum durations helps maintain healthy data layouts.
Related: MySQL performance bottlenecks and how to prevent them.
Checkpoints and WAL activity
Checkpoints flush modified pages to disk, but overly frequent checkpoints cause I/O bursts. Monitoring checkpoint intervals, WAL generation rates, and background writer behavior helps prevent unexpected slowdowns during busy periods.
4. Monitoring replication and high availability
Many PostgreSQL deployments rely on streaming replication for redundancy and failover. Monitoring replication health ensures reliability during planned and unplanned events.
Replication lag
Replication lag occurs when the standby cannot keep up with WAL application. It can be caused by slow disks, high WAL volume, or network congestion. Monitoring both time based lag and byte based lag provides a fully accurate picture.Standby performance
A healthy standby should apply WAL segments at a steady rate. Tracking apply latency, standby I/O, and conflict events ensures that the standby remains ready for immediate promotion.
Backup status and integrity
Monitoring backup completion, WAL archiving, and periodic restore validation ensures that disaster recovery processes are reliable. Even occasional restore rehearsals help prevent unexpected failures.
5. Monitoring workload and application behavior
Understanding application workload patterns is essential for connecting database performance to business activity.
Transaction characteristics
Long running transactions block vacuum processes and delay cleanup. Monitoring transaction duration helps teams detect inefficient application logic.
Workload segmentation
Different application modules generate different query patterns. Monitoring activity by client host, user, or application label helps isolate problematic components.
Traffic surges
Predictable or unexpected surges in traffic can create pressure on CPU, memory, and connection pools. Monitoring these spikes helps improve capacity planning and autoscaling decisions.
Designing a scalable PostgreSQL monitoring strategy
A strong PostgreSQL monitoring strategy is not only about tracking metrics, but also about correlating them.
Correlation across layers
CPU spikes are more meaningful when mapped to slow queries or increased WAL activity. Lock waits matter more when connected to specific transactions. Correlation shortens troubleshooting time and improves accuracy during incidents.
Trend based analysis
Gradual increases in bloat, WAL generation, or lock contention often forecast future problems. Monitoring trends over weeks or months helps teams take proactive action.
Baselines and anomaly detection
Each PostgreSQL environment has unique performance characteristics. Establishing baselines allows monitoring tools to surface anomalies quickly, even if the numbers look acceptable on their own.
Post change validation
Any modification to schemas, indexes, or application logic should be followed by monitoring. Comparing pre change and post change metrics ensures that optimizations do not introduce new regressions.
PostgreSQL monitoring with Applications Manager
Applications Manager provides end to end visibility into PostgreSQL performance by correlating system resources, query execution metrics, storage health, autovacuum behavior, WAL generation, and replication lag in one place. It highlights slow queries, tracks buffer usage patterns, monitors connection behavior, and captures storage trends with minimal configuration, helping teams identify bottlenecks before they affect users.
To experience these capabilities in your own environment, download a free, 30-day, trial of Applications Manager now!

