Advanced IBM DB2 performance monitoring
Detect issues early, analyze database behavior, and maintain consistent performance across your IBM DB2 environments.
- Track database workload and activity in real time
- Monitor connection usage and DB2 agent behavior
- Receive instant alerts when thresholds are exceeded
- Identify performance bottlenecks faster with deep insights
- Supports production environments without additional agents
Monitor your IBM DB2 efficiently
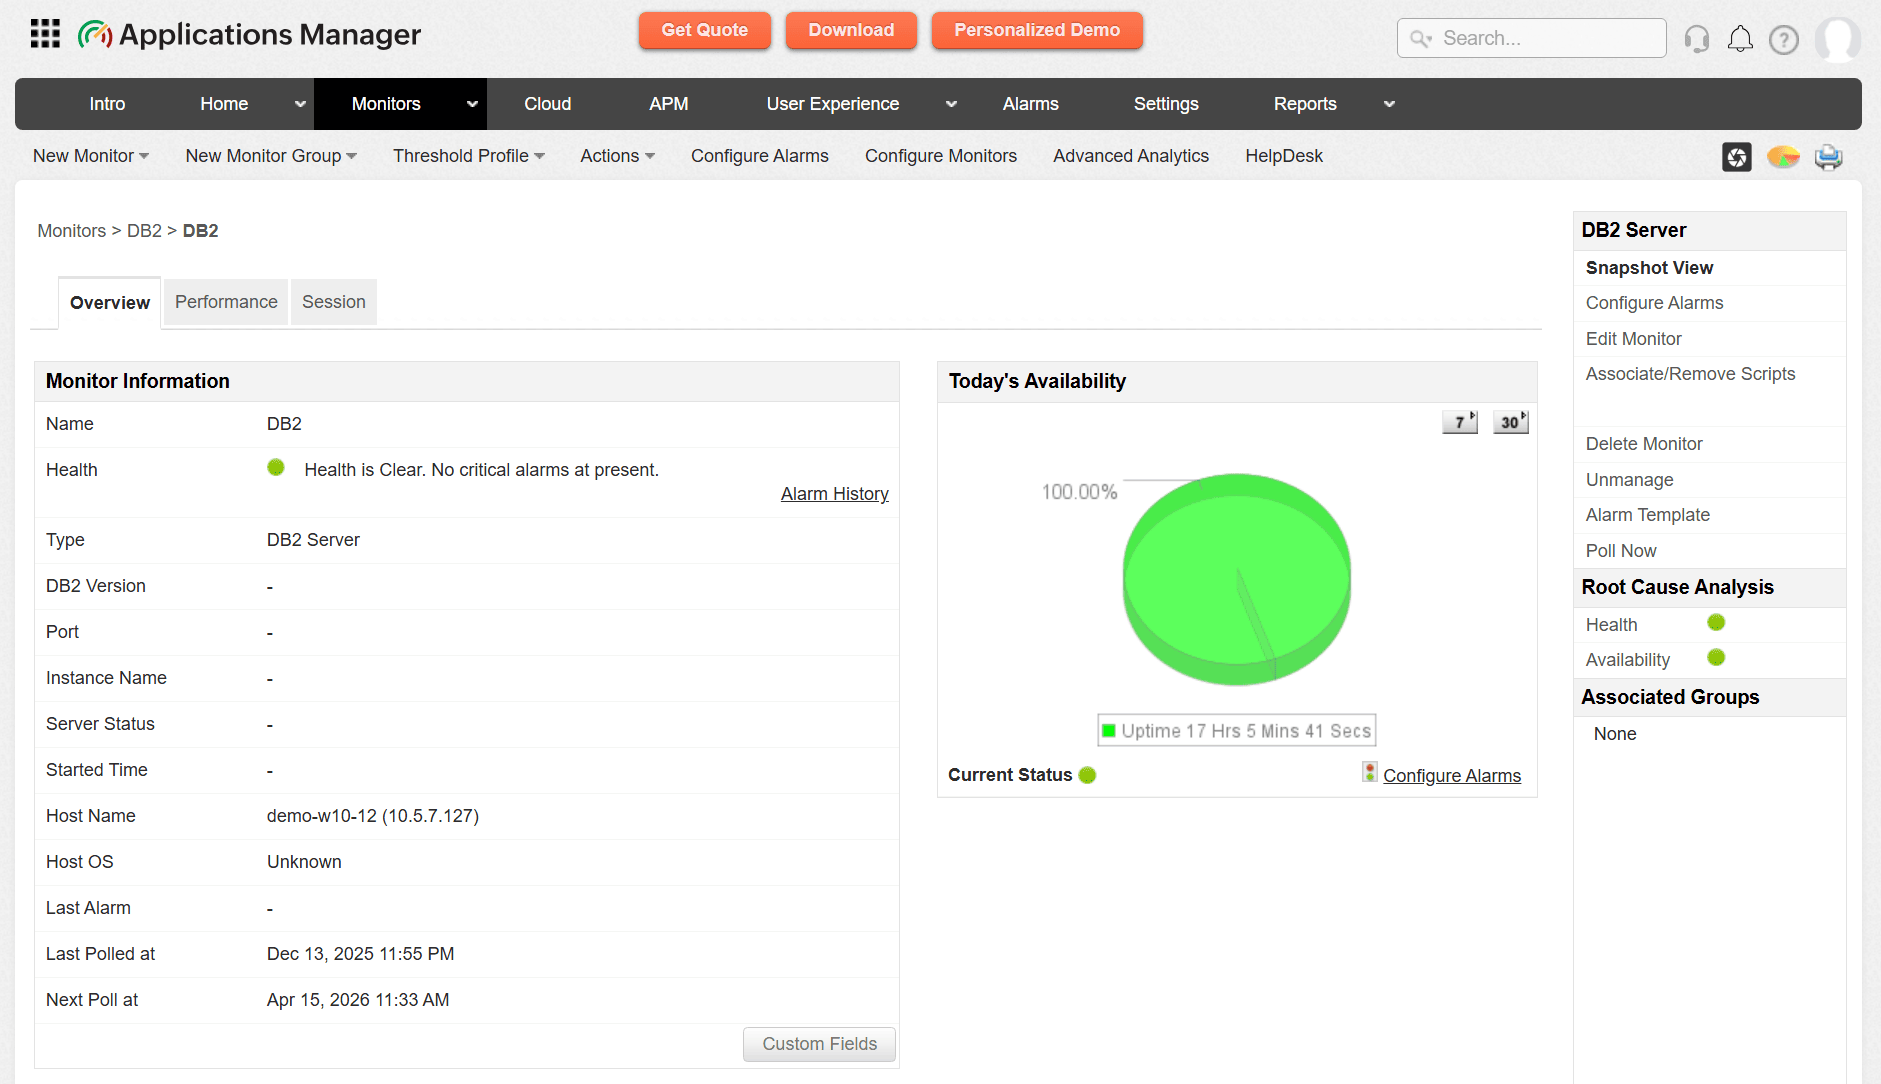
ManageEngine Applications Manager's comprehensive IBM DB2 monitoring capability helps database administrators (DBAs) monitor the availability and performance of production databases. It is an agentless database monitoring software that provides out-of-the-box performance metrics for ensuring the IBM DB2 database server runs efficiently.

The IBM DB2 monitoring tool provides a web client that helps you visualize the network of DB2 Servers. It provides in-depth monitoring data that helps you make educated decisions about usage patterns, plan capacity, and notify you about impending problems. The root cause analysis window helps the operations team to troubleshoot IBM DB2 performance problems quickly. Additionally, the grouping capability helps you group your databases based on the business process supported and helps the operations team to prioritize alarms as they are received.
Some of the components that are monitored in the DB2 database are:
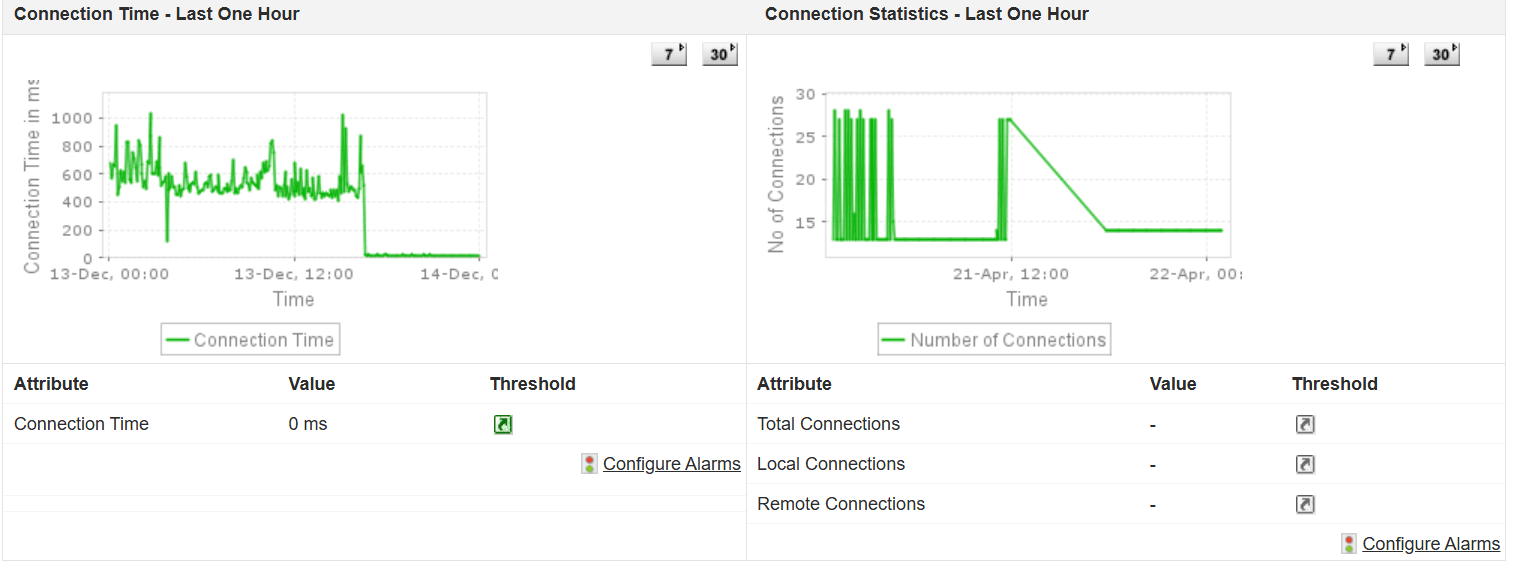
- Connection statistics: Track active and idle connections to understand database load and connection behavior. This helps identify connection spikes, session bottlenecks, and potential resource exhaustion before they affect availability.

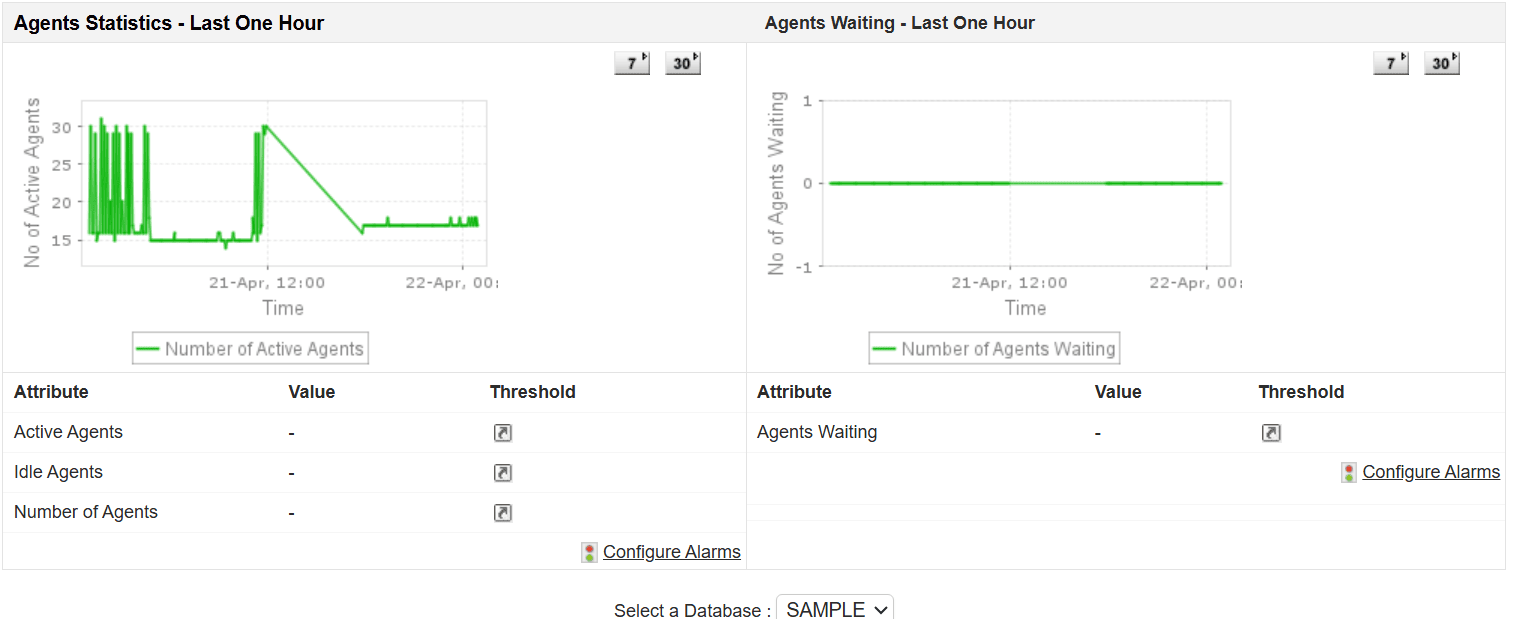
- Agents statistics: Monitor the status and performance of DB2 agents responsible for handling client requests. Keeping an eye on agent utilization helps detect overloaded agents and ensures efficient request handling.

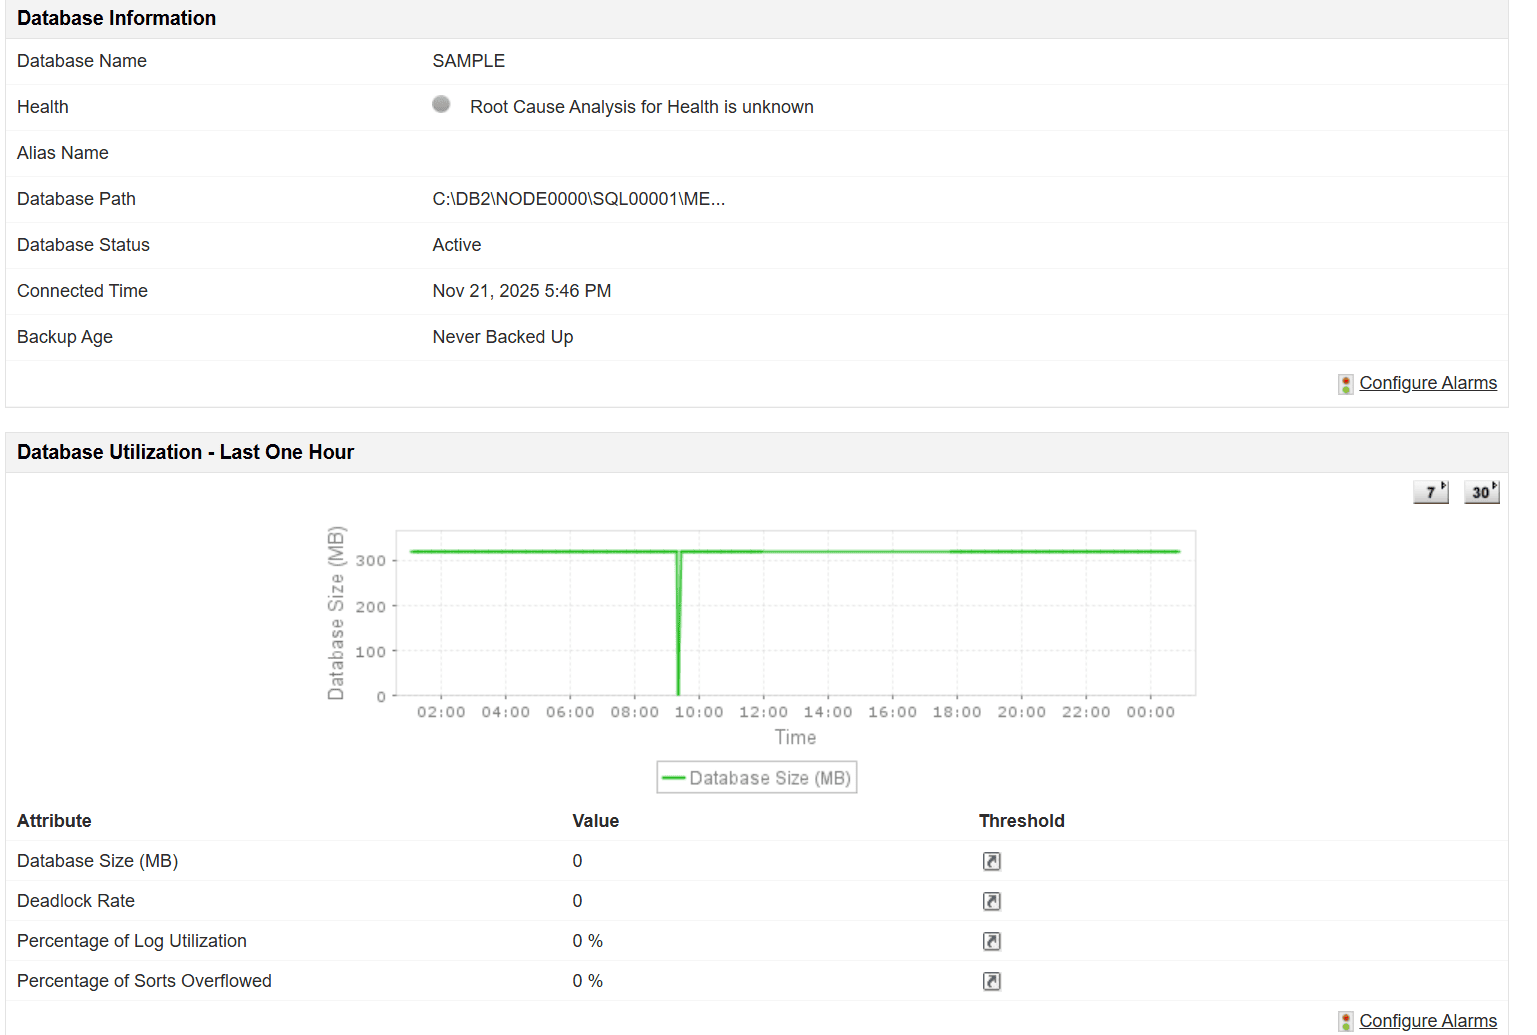
- DB information: Gain visibility into core database details such as database status, size, and configuration parameters. This enables administrators to maintain database health and verify that configurations align with performance requirements.

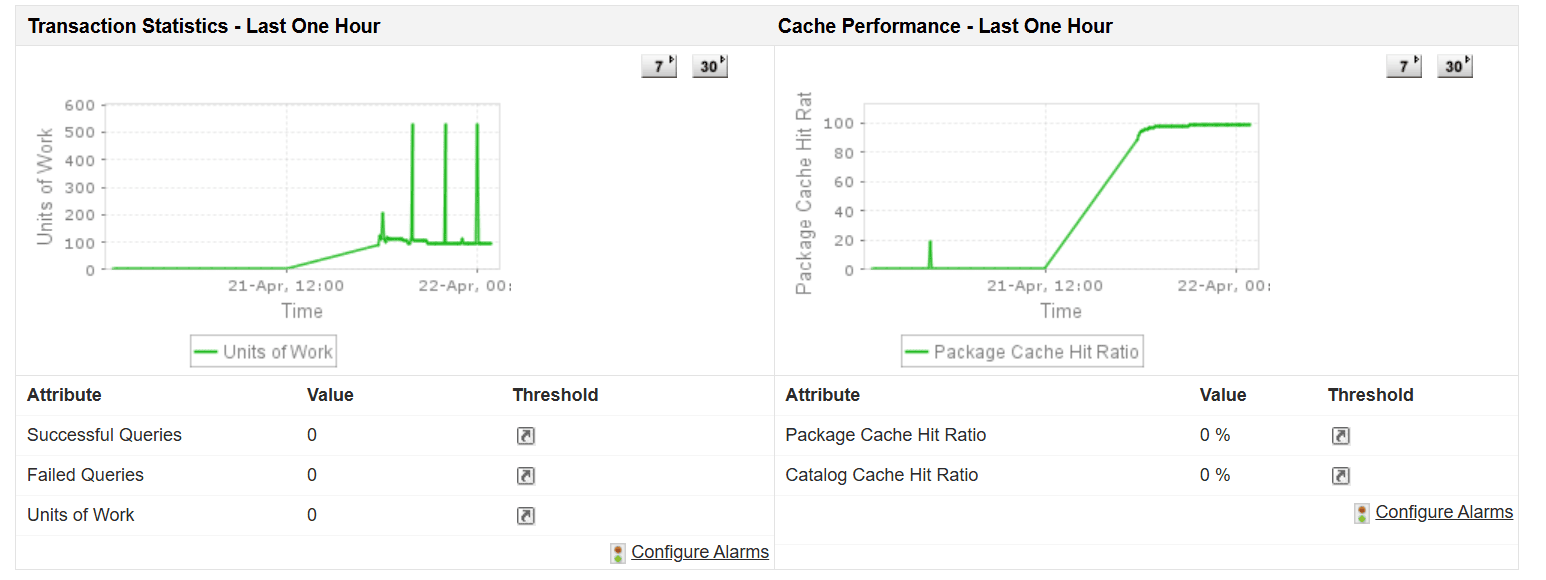
- Transaction statistics: Analyze transaction rates, commits, and rollbacks to understand workload patterns. Monitoring these metrics helps detect abnormal transaction behavior and maintain data consistency and performance.
- Cache performance: Evaluate how effectively the database cache is being utilized to reduce disk I/O operations. Monitoring cache hit ratios helps optimize memory usage and improve overall query response times.

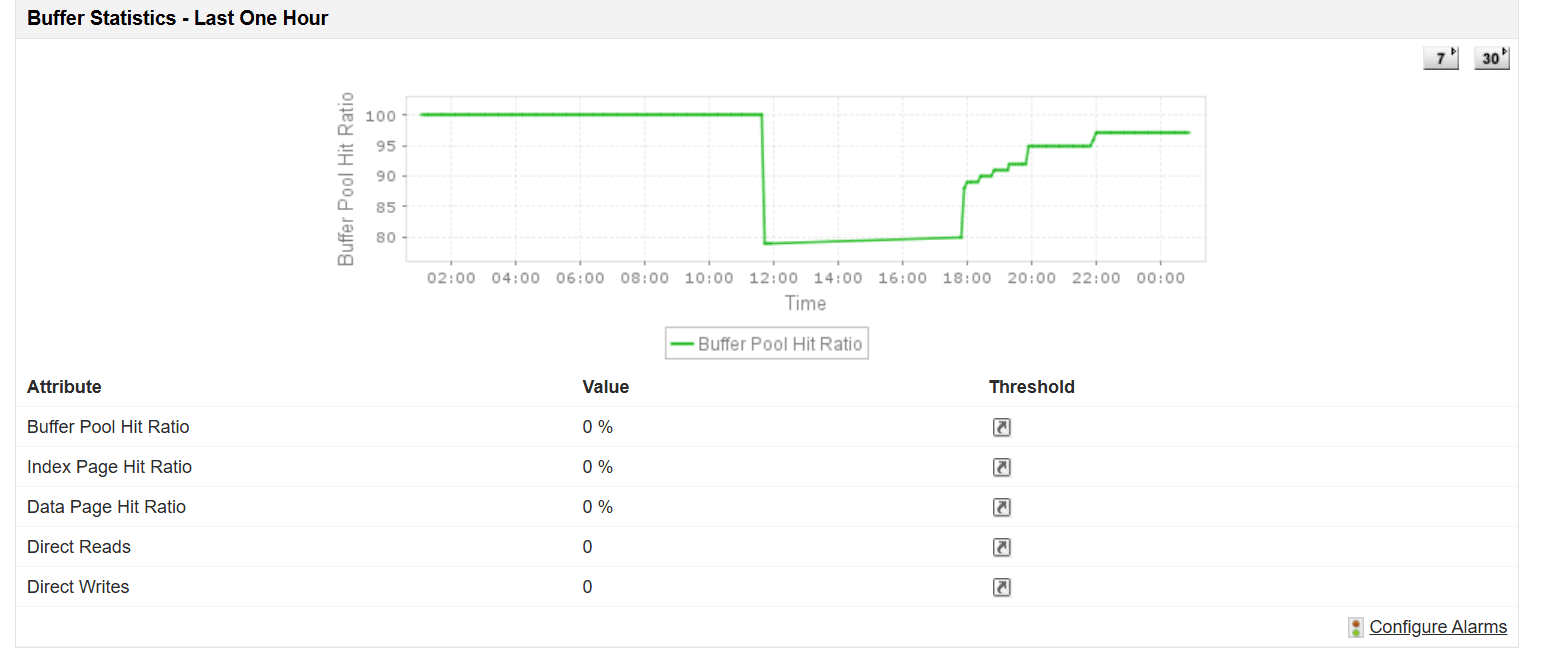
- Buffer statistics:Track buffer pool usage, hit ratios, and page activity to assess memory efficiency. Proper buffer monitoring helps prevent performance degradation caused by insufficient or poorly configured memory allocation.

- TableSpace status:Monitor tablespace usage, availability, and growth trends to prevent storage shortages. Early detection of capacity issues helps ensure uninterrupted database operations and avoids unexpected downtime.
Monitor custom IBM DB2 database queries
Additionally, Applications Manager also provides the ability to monitor any SQL Query of an IBM DB2 Database by using the Database Query Monitoring capability. With this, a DBA can monitor additional performance metrics, custom database tables, and expose business metrics to line of business managers.
Start your journey toward flawless database performance with IBM DB2 monitoring. Download and try the fully functional product version to know more about the DB2 database monitoring capability.
DB2 monitoring capabilities
- Out-of-the-box monitoring of DB2 availability and performance.
- Monitors performance statistics such as connection statistics, and agent statistics. Alarms can be configured for these parameters.
- Based on the thresholds configured, notifications and alarms are generated. Actions are executed automatically based on configurations set.
- Performance graphs and reports are instantly available. Reports can be grouped and displayed based on availability, health, and connection time.
- Delivers both historical and current DB2 performance metrics, delivering insight into the performance over a period of time.
Ensure reliable IBM DB2 performance with proactive monitoring
Stay ahead of performance challenges and keep your IBM DB2 databases running at their best. With deep visibility, intelligent alerts, and comprehensive performance tracking, Applications Manager empowers teams to maintain database health and respond quickly to changing workloads. Start monitoring your IBM DB2 environment today and experience improved reliability and performance. Try it today!
More on IBM DB2 monitoring:
What is IBM DB2 monitoring?
+IBM DB2 monitoring involves continuously tracking the health, availability, and performance metrics of a DB2 database system to ensure optimal database operations and prevent downtime.
Does Applications Manager support agentless IBM DB2 monitoring?
+Yes, ManageEngine Applications Manager provides agentless database monitoring, meaning you can track IBM DB2 performance out-of-the-box without installing additional software on your database servers.
Can I monitor custom SQL queries in DB2?
+Absolutely. Applications Manager includes Database Query Monitoring capabilities that allow DBAs to monitor any custom SQL query, track business-specific metrics, and set alerts based on custom thresholds.
Why IBM DB2 monitoring is critical for enterprises?
+Modern enterprise applications rely heavily on robust database architectures. Proper IBM DB2 monitoring ensures high availability, reduces latency, and optimizes query response times. By continuously tracking crucial metrics such as buffer hit ratios, cache performance, and tablespace status, IT operations can proactively resolve bottlenecks before they impact end-users.
