In this article, we will explore why RUM matters for both UX and DevOps, how it complements other observability signals, and what to look for when choosing an ideal RUM solution.
What RUM measures and why it is different
Real User Monitoring collects client-side data from actual user sessions. Typical signals include page load and navigation timings, Core Web Vitals, resource timing, JavaScript errors, user transactions, geographic and device context, and session-level interaction traces. That means RUM captures variability caused by real-world networks, browsers, devices, and user behavior rather than simulated checks. Because it observes the user's point of view, RUM finds issues synthetic tests miss, such as third-party script slowdowns for a particular browser or poor performance from a specific mobile carrier.
Why RUM matters for UX: Signal to action
User experience is judged in milliseconds and impressions. A few hundred milliseconds in page load can change bounce rates, conversions, and customer sentiment. RUM provides the evidence UX teams need to prioritize fixes. Rather than guessing which page element, image, or third-party call is responsible for slowdowns, teams can use session-level RUM data to correlate visual progress, layout shifts, and frustration signals with user journeys and conversion funnels. That enables targeted fixes that move key metrics such as time-to-interactive and task completion rates. Many UX teams use RUM to validate design decisions, to measure the impact of experiments, and to monitor accessibility and usability across the user base.
Why RUM matters for DevOps: Triage, SLIs, and incident response
DevOps teams need fast, accurate signals to detect production regressions and to respond effectively. RUM serves as a customer-facing SLI source. When errors spike or page performance degrades, RUM tells you whether real users are affected, how many, and which segments are impacted. This reduces noisy alerts that come from backend-only metrics and helps on-call teams focus on incidents with real business impact. RUM data also helps trace problems from the browser back to backend services, third-party APIs, or CDN anomalies by correlating session traces with backend telemetry. This correlation shortens mean time to resolution and improves post-incident root cause analysis..
How UX and DevOps benefit together
When UX and DevOps share the same RUM data, prioritization becomes aligned to business outcomes. UX can point to pages where users abandon because of poor perceived performance while DevOps can map those sessions to error rates, backend latency, or infrastructure events. That alignment produces two wins.
First, teams fix what users actually experience rather than chasing synthetic failures. Second, organizations can create meaningful SLAs and SLOs driven by user experience metrics, such as percent of sessions meeting core web vitals thresholds or median time-to-interactive for top-funnel pages. In practice, companies that unify RUM with logs and APM get faster incident response and better product decisions.
Common RUM use cases you can implement today
- Session prioritization: Rank sessions by business value and frustration signals and replay only the most critical ones.
- Funnel analysis: Track where users drop out during checkout and map dropouts to performance metrics.
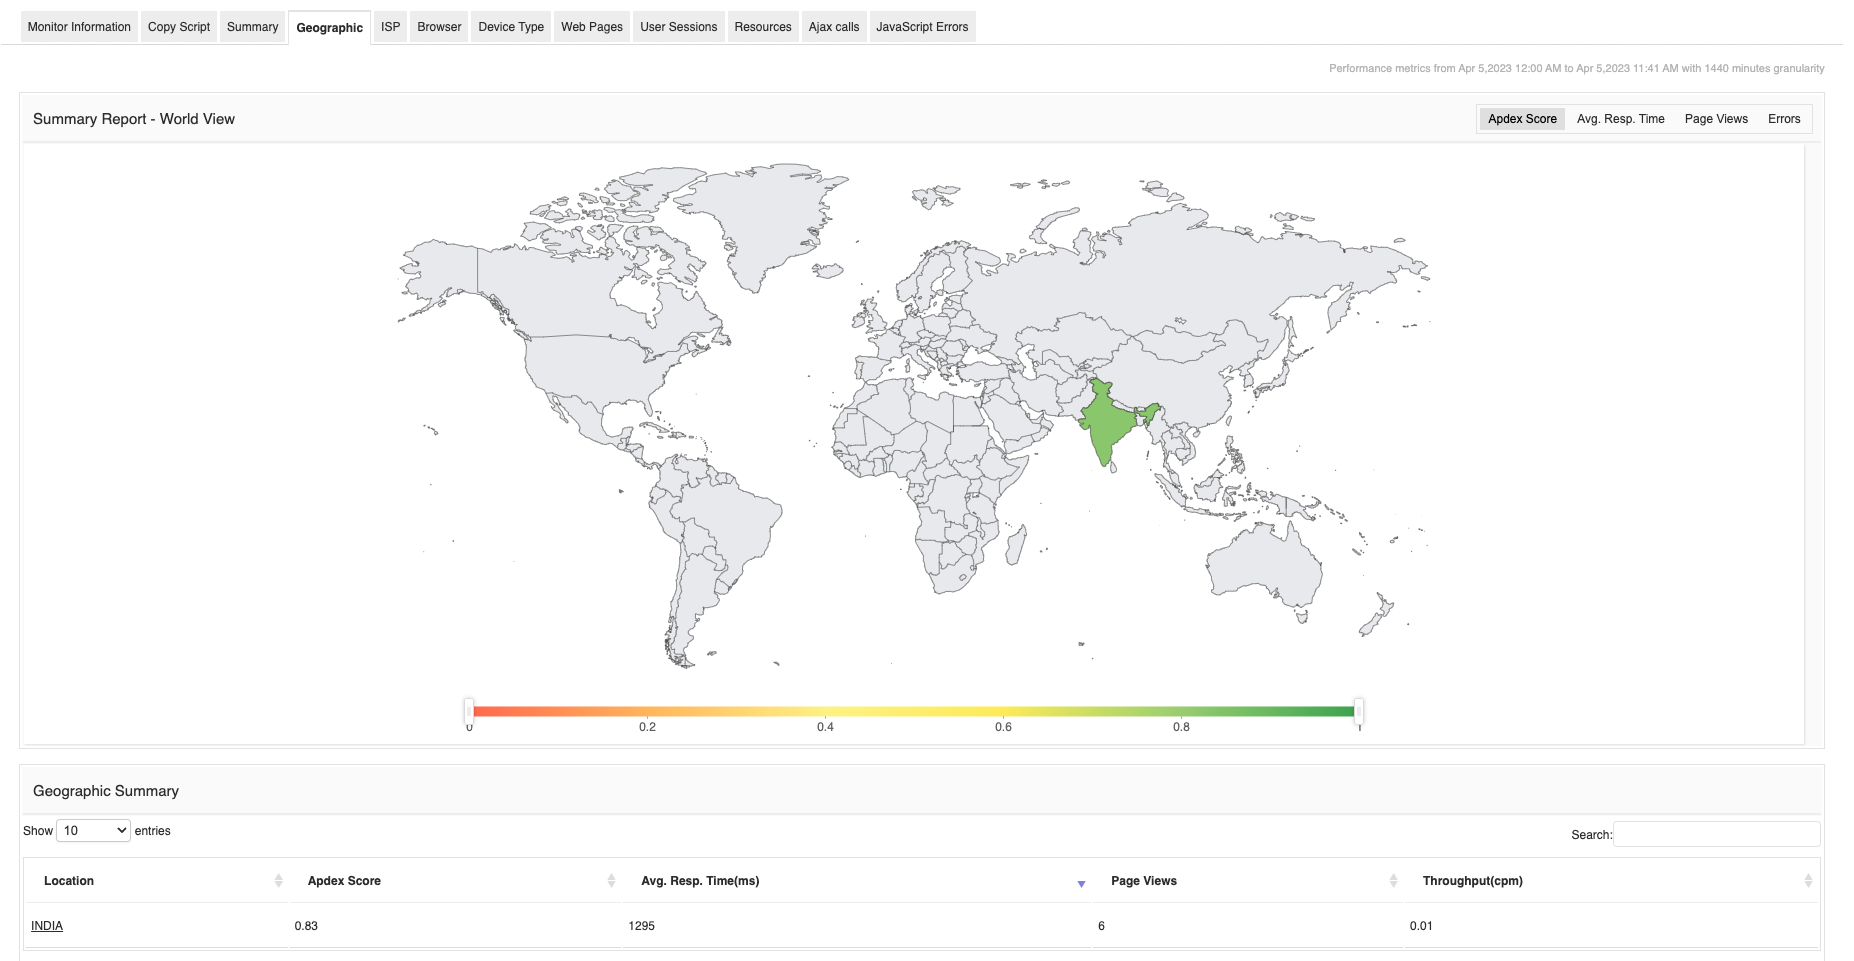
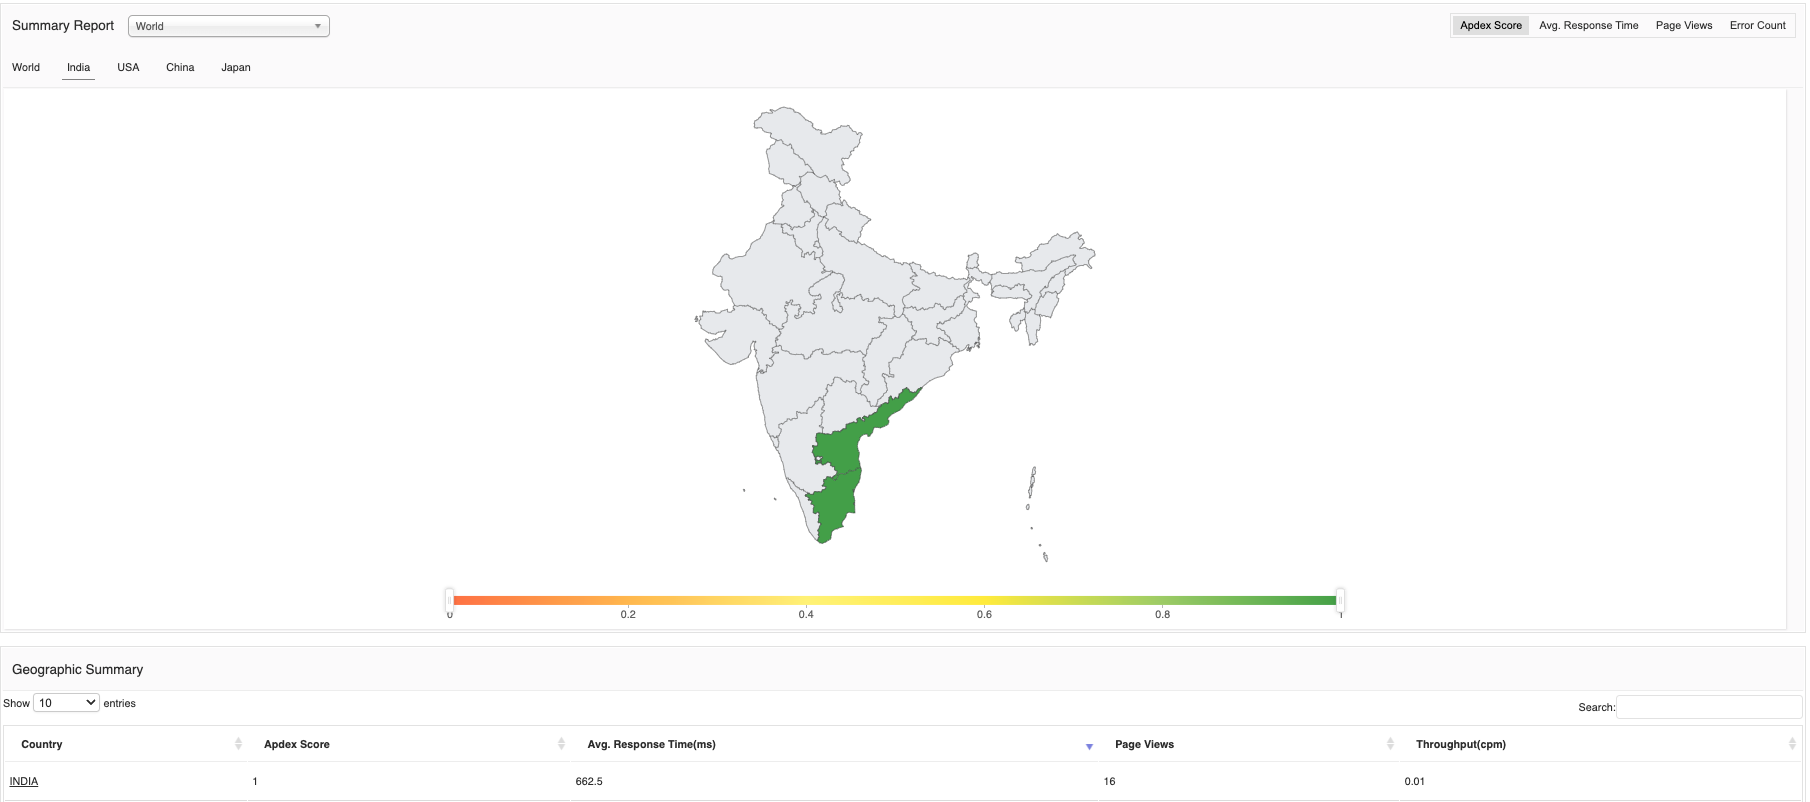
- Geographic and device segmentation: Find performance regressions limited to certain ISPs, countries, or browser versions.
- Release impact monitoring: Compare pre and post-release RUM baselines to detect regressions quickly.
- Third-party vendor monitoring: Identify when ad networks, analytics scripts, or payment providers cause perceptible slowdowns.
How RUM complements synthetic monitoring and APM
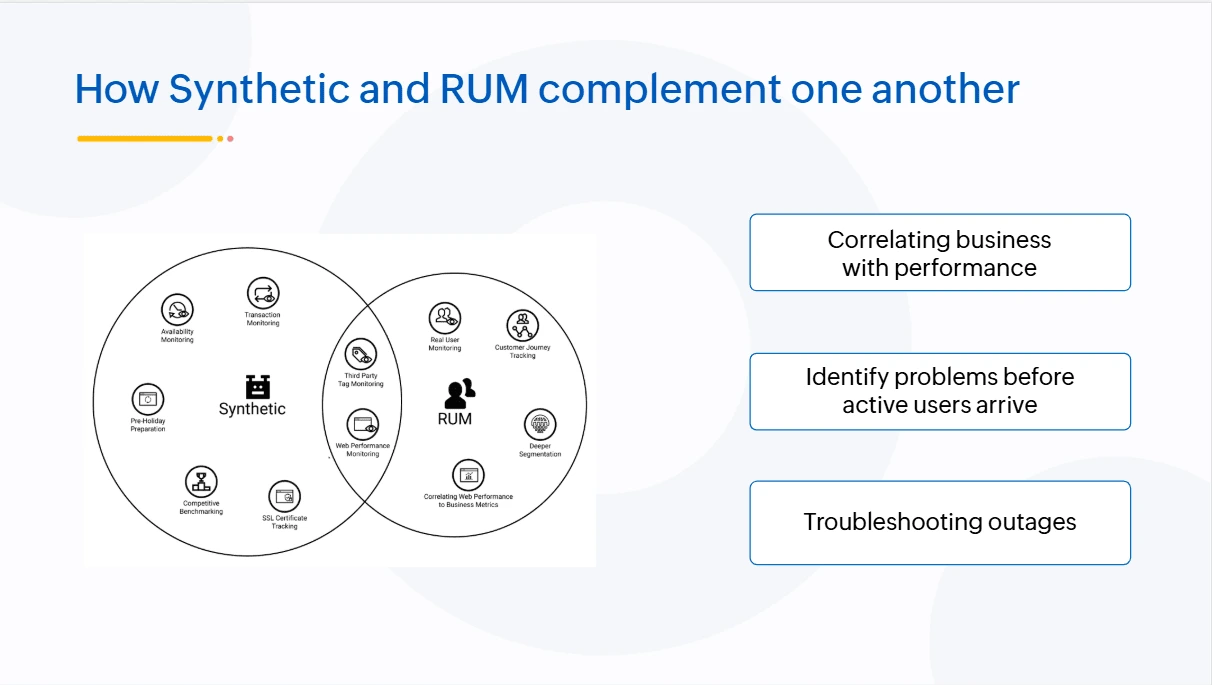
RUM and synthetic tests are complementary. Synthetic monitoring tests provide scheduled, controlled checks that are excellent for SLAs and baselining. RUM gives the messy truth of production. Similarly, APM captures backend traces and resource usage, while RUM captures the frontend perception. The most effective observability stacks combine all three: synthetic checks for availability, APM for service-level causality, and RUM for user-level impact. Together they give end-to-end visibility from browser to database.

What to look for in a RUM solution
- Session fidelity: High-resolution timings and session replay without excessive sampling.
- Correlation with backend telemetry: Easy linking between frontend sessions and backend traces.
- Core Web Vitals and custom metrics: Built-in support for modern UX metrics.
- Low overhead: minimal client-side impact and privacy-compliant data collection.
- Actionable alerts: alerting on user-impacting regressions rather than raw errors. Many leading vendors emphasize slightly different mixes of these capabilities, so align vendor choice to whether your priority is UX optimization, incident response, or observability at scale.
Common pitfalls to avoid
- Over-sampling: capturing too much session data can be costly and slow. Use smart sampling that preserves business-critical sessions.
- Blind segmentation: failing to segment by device, browser, and location hides targeted failures.
- Treating RUM as only a dashboard: RUM must be integrated into paging, release checks, and product analytics workflows to deliver value.
Bringing RUM into your workflow
Real User Monitoring is not just a monitoring checkbox. It is an essential feedback loop that connects UX, product, and operations to actual customer outcomes. When teams instrument RUM thoughtfully, they reduce guesswork, accelerate incident triage, and create tighter feedback between feature changes and user behavior.
Why ManageEngine Applications Manager helps
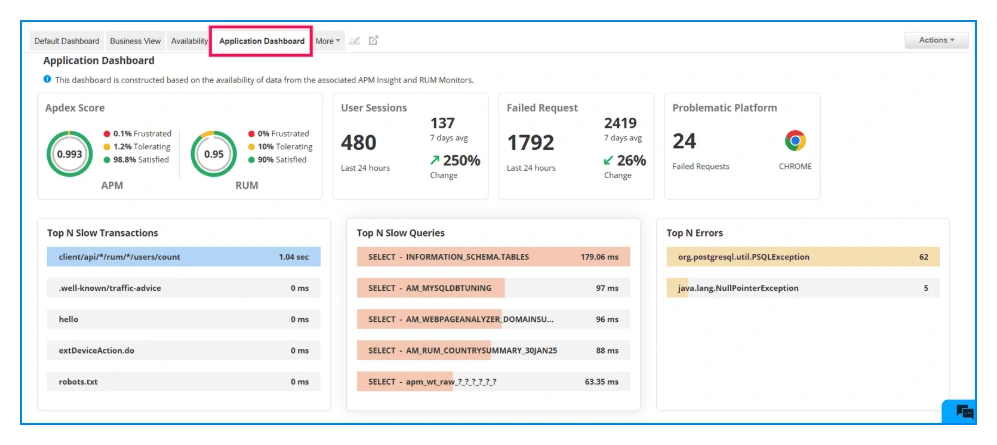
ManageEngine Applications Manager combines server and application performance monitoring with user experience insights so teams can connect frontend pain points to backend causes in one console. Applications Manager provides RUM-style visibility alongside APM, infrastructure metrics, and synthetic checks, making it practical for DevOps and UX teams to collaborate on the same evidence. If you want to reduce user-impacting incidents and make releases safer, Applications Manager provides the unified visibility needed to put the user at the center of both development and operations.


