What is MySQL monitoring?
MySQL monitoring is the continuous process of observing and analyzing the performance, availability, resource utilization, and overall behavior of a MySQL server. For experienced database administrators (DBAs), this is a critical practice to ensure database stability, optimize performance, and proactively address potential issues within complex database ecosystems supporting mission-critical applications.
Modern MySQL deployments often span cloud-native, hybrid, and scaled-out architectures. Therefore, effective MySQL monitoring goes beyond basic server checks, requiring in-depth analysis of query execution, replication integrity, memory management, and workload forecasting.
The importance of MySQL monitoring for advanced DBAs
Advanced DBAs are responsible for maintaining SLAs, supporting high-volume transactions, and resolving complex issues in real-time. MySQL monitoring is crucial for:
- Query optimization: Identifying slow queries, understanding execution plans, and detecting missing or unused indexes.
- Replication management: Monitoring master-slave or group replication for lag, errors, and GTID consistency.
- InnoDB tuning: Analyzing buffer pool behavior, I/O patterns, and lock contention to optimize performance.
- High availability: Monitoring failovers, connection limits, and availability metrics to ensure uptime.
- Security and compliance: Detecting unusual access patterns, privilege escalations, and auditing user activity.
- Performance forecasting: Using historical data to predict future resource needs and plan capacity.
- Real-time troubleshooting: Correlating metrics to quickly diagnose and resolve performance problems.
Core areas of MySQL monitoring: Metrics and use cases
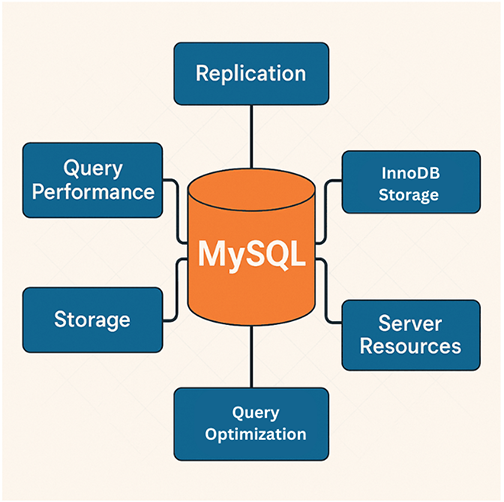
Advanced MySQL monitoring means tracking the metrics that directly impact performance, consistency, and availability. This includes query execution efficiency, InnoDB internals, replication state, and server resource saturation. Experienced DBAs use these data points to pinpoint bottlenecks, maintain replication health, harden security, and plan capacity. Below are the key areas, metrics, and real-world scenarios that matter when managing production-grade MySQL environments.

1. Query performance and optimization
- Top slow queries: Queries exceeding a defined threshold in the slow_query_log.
- Query execution time breakdown: Time spent on different stages (CPU, I/O, locking).
- Full table scans: Number of queries scanning entire tables.
- Index usage: Effectiveness of index utilization.
- Query plan analysis: Output from EXPLAIN to understand query execution.
- Temporary table creation: Number and size of temporary tables created.
- Scenario: Application performance degrades during peak hours.
- Monitoring insight: Slow query log reveals a complex JOIN operation without proper indexing. EXPLAIN confirms a full table scan.
- Resolution: Add an index to the tables involved in the join.
- Outcome: Effectiveness of index utilization.
2. Replication monitoring
- Replication lag: Delay between master and slave.
- I/O thread status: Status of the I/O thread on the slave.
- SQL thread status: Status of the SQL thread on the slave.
- GTID consistency: Status of Global Transaction Identifiers.
- Replication errors: Any errors encountered during replication.
- Scenario: A disaster recovery (DR) site is lagging behind the primary database.
- Monitoring insight: High replication lag is observed. The SQL thread on the replica is slow.
- Resolution: Identify and optimize long-running queries on the master server that are causing a backlog.
- Outcome: Reduced replication lag and improved DR site synchronization.
3. InnoDB storage engine monitoring
- Buffer pool hit rate: Percentage of data found in memory.
- Read/write IOPS: Disk I/O operations per second.
- Dirty pages ratio: Percentage of modified pages in the buffer pool.
- Log file waits: Time spent waiting for log file operations.
- Lock waits: Time spent waiting for row-level locks.
- Scenario: Application write performance is slow.
- Monitoring insight: Low buffer pool hit rate and high write IOPS are observed.
- Resolution: Increase the InnoDB buffer pool size.
- Outcome: Improved write performance due to increased memory caching.
4. Server health and resource utilization
- CPU usage: Percentage of CPU utilized.
- Memory usage: Total, used, and free memory.
- Disk space usage: Available disk space.
- Network traffic: Number of active database connections.
- Connections: Time spent waiting for row-level locks.
- Load average: System load on the server.
- Scenario: The MySQL server becomes unresponsive.
- Monitoring insight: High CPU usage and a large number of active connections are observed.
- Resolution: Identify and terminate long-running or blocking queries and optimize connection management.
- Outcome: Server responsiveness is restored.
5. Security monitoring and access control
- Failed login attempts: Number of unsuccessful login attempts.
- Connection origins: IP addresses connecting to the server.
- Privilege changes: Modifications to user permissions.
- User activity: Log of user actions, such as queries and data modifications.
- Authentication methods: Types of authentication used.
- Scenario: A potential brute-force attack is suspected.
- Monitoring insight: A sudden spike in failed login attempts from an unknown IP address is detected.
- Resolution: Block the suspicious IP address using a firewall and investigate the failed login attempts.
- Outcome: The attempted security breach is prevented.
Applications Manager for advanced MySQL monitoring
ManageEngine Applications Manager provides a comprehensive MySQL monitoring solution with:
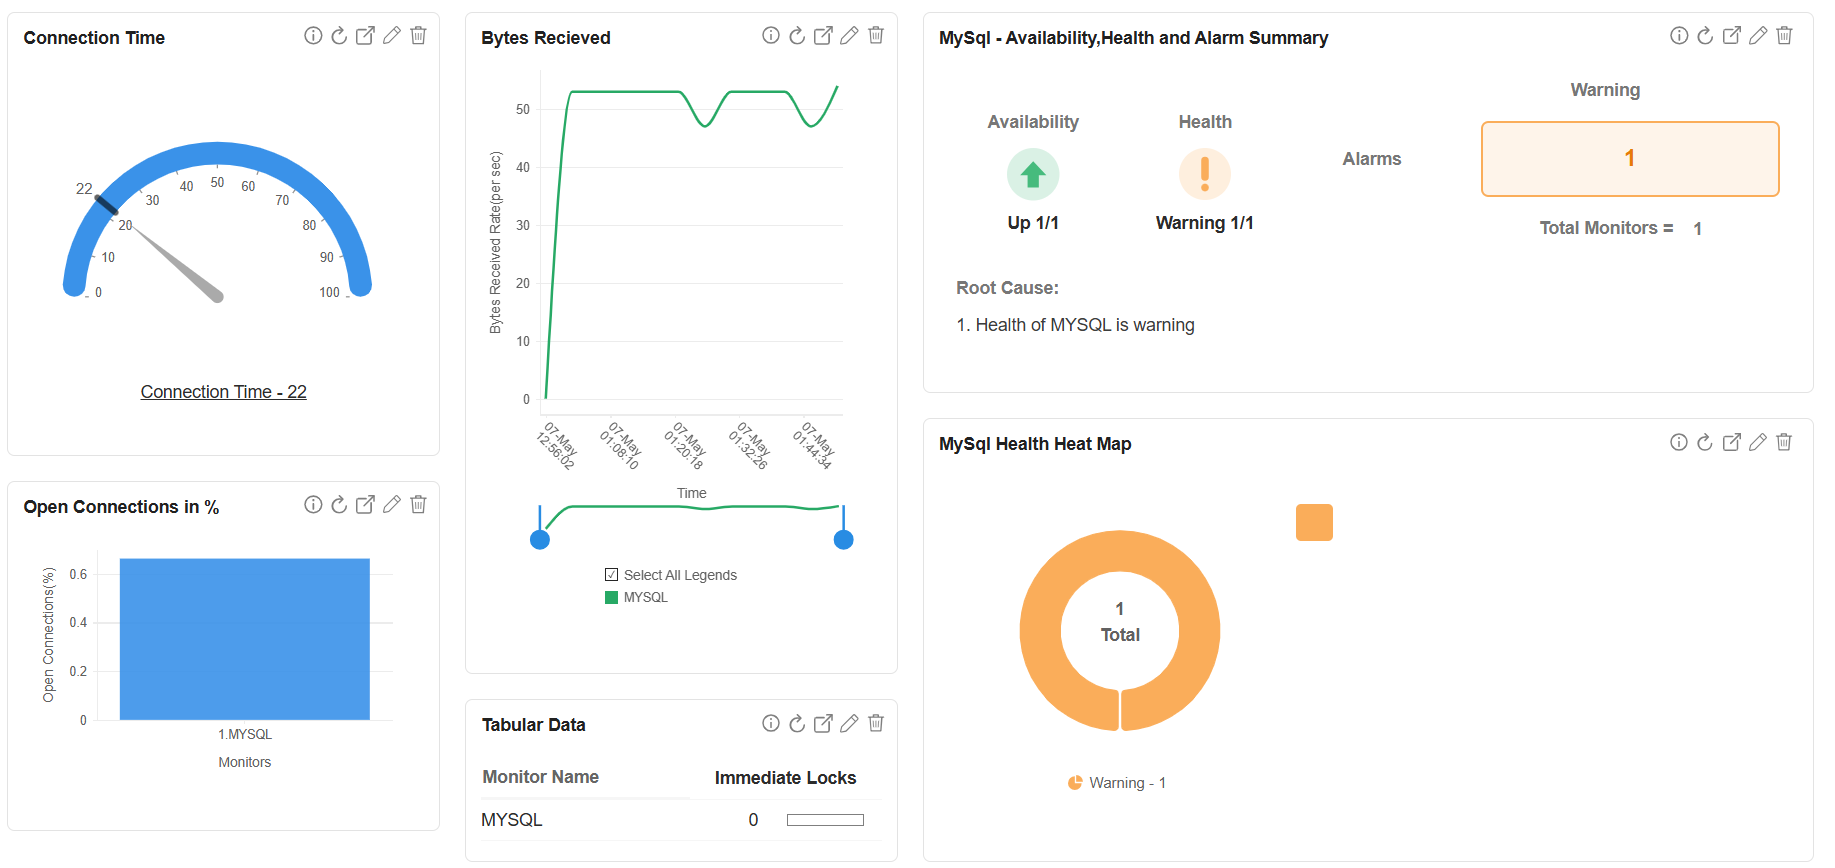
- Real-time dashboards with over 50+ MySQL metrics
- Automated alerting and threshold-based notifications
- Slow query profiling with historical analysis
- Replication health visibility for both async and semi-sync setups
- Custom scripts and REST API support for deep integrations
- Trend-based forecasting and capacity planning
- Correlated infrastructure monitoring—from OS to MySQL to application layers.

Applications Manager helps DBAs proactively manage MySQL environments, optimize performance, and ensure high availability.
Effective MySQL monitoring is essential for maintaining database health and performance. By tracking key metrics and understanding their implications, advanced DBAs can quickly identify and resolve issues, optimize database configurations, and ensure the reliability of mission-critical applications. Tools like Applications Manager simplify this process, providing the necessary insights to manage complex MySQL deployments effectively. Download a 30-day, free trial now!

