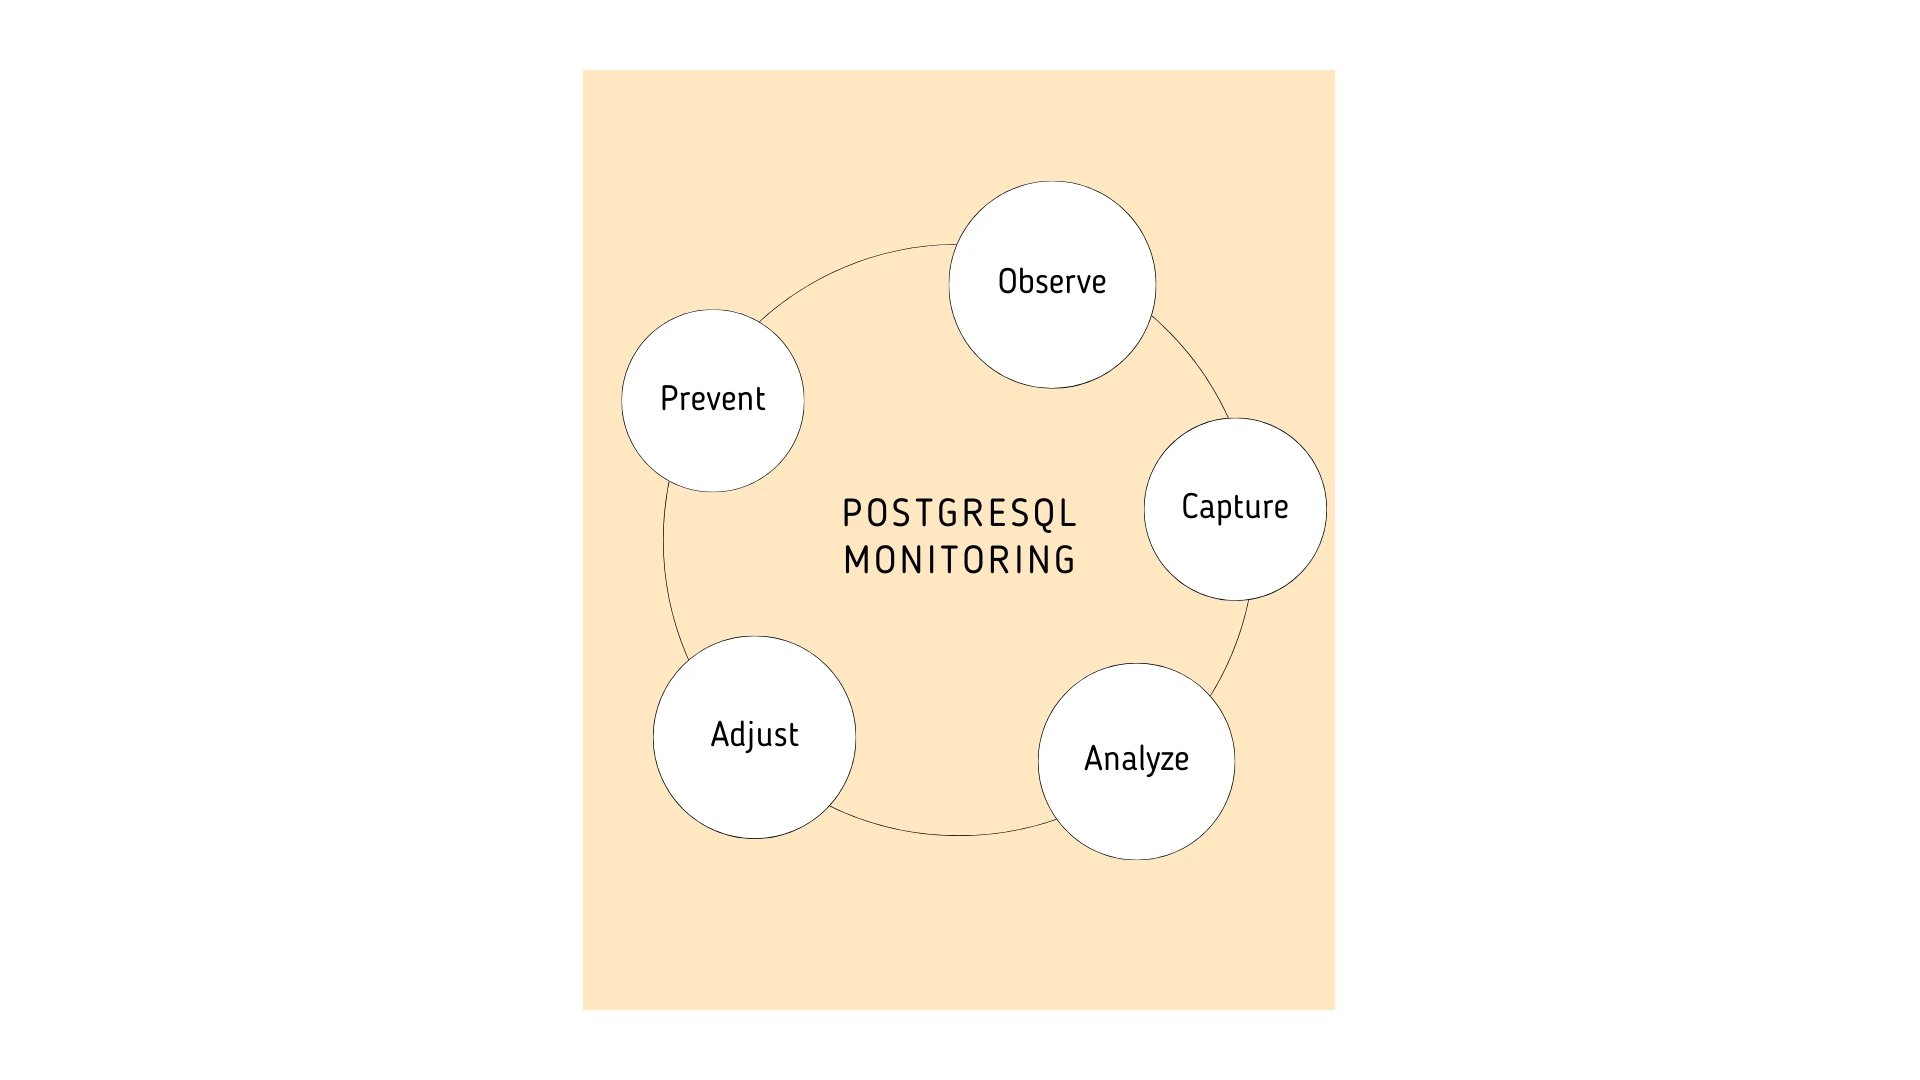
The focus of this article is on practical best practices that bring long term performance stability in PostgreSQL databases.
1. Monitor your workload, not fixed thresholds
PostgreSQL handles very different types of workloads. A system might serve thousands of small OLTP transactions in the morning, run reporting tasks in the afternoon, and process long running batch jobs at night. These shifts influence CPU usage, I/O patterns, cache behavior, and replication activity. Because of this, fixed thresholds often create noisy or misleading alerts.
What to do instead:
Create baselines that reflect how your system normally behaves during each workload pattern. Track typical values for latency, buffer activity, index usage, vacuum frequency, and I/O saturation. Once you understand these patterns, it becomes much easier to detect subtle changes that hint at early performance problems.
Why this works:
Baseline drift shows up before slow queries do. For example, you might notice planning times creeping upward long before you see longer response times. This early signal gives you time to analyze what changed in the workload or schema.

2. Track behavior changes, not only slow queries
Slow queries get the most attention, but they are usually an end result rather than the first sign of trouble. PostgreSQL provides several small signals that help you understand when behavior is starting to shift.
Key indicators worth tracking:
- A query switches from an index scan to a sequential scan.
- Latency becomes less consistent even if the averages look stable.
- Temp file usage starts appearing during operations that normally stay in memory.
- A particular table sees more frequent vacuum operations.
- Indexes with historically stable usage suddenly drop in relevance.
These signals often point to changes in data distribution, outdated statistics, or inefficient access patterns. Catching them early helps you prevent slowdowns rather than reacting to them later.
A practical example:
If a reporting query that normally uses an index plan suddenly begins scanning the entire table, the performance issue might not show up immediately. However, this plan change is a clear indication that PostgreSQL no longer believes the index is selective. Monitoring should highlight the change before users feel any impact.
3. Account for external factors in performance evaluation
PostgreSQL performance often reflects what is happening in other layers. It might be storage that is slower than usual, a network link that is experiencing packet loss, or an application change that doubled the number of connections.
Examples of cross layer influences:
- A caching issue causes a surge of read queries.
- A microservice retry loop creates an unexpected traffic spike.
- Cloud storage experiences temporary latency.
- A container gets moved to a more crowded host.
- A background job overlaps with peak traffic by mistake.
If you monitor PostgreSQL without considering these surrounding conditions, it may appear as if the database is slowing down on its own. When metrics from the application, OS, and network layers are correlated with database activity, root cause analysis becomes clearer and resolutions become faster.
4. Implement a simple learning loop for continuous improvement
Every performance issue teaches you something about your database and your workload. If you capture the right details each time, future issues become easier to predict and prevent.
Information worth capturing:
- Which queries were affected.
- How plans changed.
- What resource patterns shifted.
- Which application events occurred around the same time.
- Which fix restored the expected behavior.
With enough observations, certain combinations of metrics will start to form recognizable patterns.
For example, an increase in temp file creation often appears alongside unstable join performance. Or planning time spikes appear after specific deployments. These patterns help your team tune alerts and refine baselines so the monitoring system becomes smarter over time.

Applications Manager: The ideal PostgreSQL monitoring tool
Putting these best practices into action is much easier when your monitoring tool captures behavior, context, and correlation instead of focusing only on raw values.
Applications Manager provides several advantages that help improve PostgreSQL performance:
- Adaptive baselines that reflect actual workload patterns.
- Visibility into query behavior, plan transitions, and relation level activity.
- Correlation between PostgreSQL metrics and application or system events.
- A historical view that helps teams learn from past performance incidents.
Applications Manager helps teams stay ahead of performance issues and keeps PostgreSQL running reliably as workloads grow. Explore now by downloading a free, 30-day, trail now!

