An autonomous database with a built-in data collection infrastructure, Oracle Database utilizes a licensed feature called the Automatic Workload Repository (AWR). Given the widespread use of Oracle databases and their importance in supporting business operations, it's essential to use a dedicated tool for Oracle monitoring to monitor the performance of these databases and reduce business downtimes.
Organizations should employ an Oracle monitoring software that enables them to:
ManageEngine Applications Manager's Oracle monitor offers multidimensional, out-of-the-box Oracle monitoring, prompt alerting, and insightful reports. Because of its numerous features, Database Performance Analyzer for oracle by Applications Manager is a powerful Oracle DB performance monitoring tool used by thousands of IT admins.
Given its complexity, Oracle database monitoring is often both challenging and time-consuming, and important parameters can easily slip through the cracks. With an effective Oracle monitoring software, it's easy to track the performance of various facets of Oracle database, especially metrics related to tablespaces, sessions, SGAs, datafiles, and disk I/O.
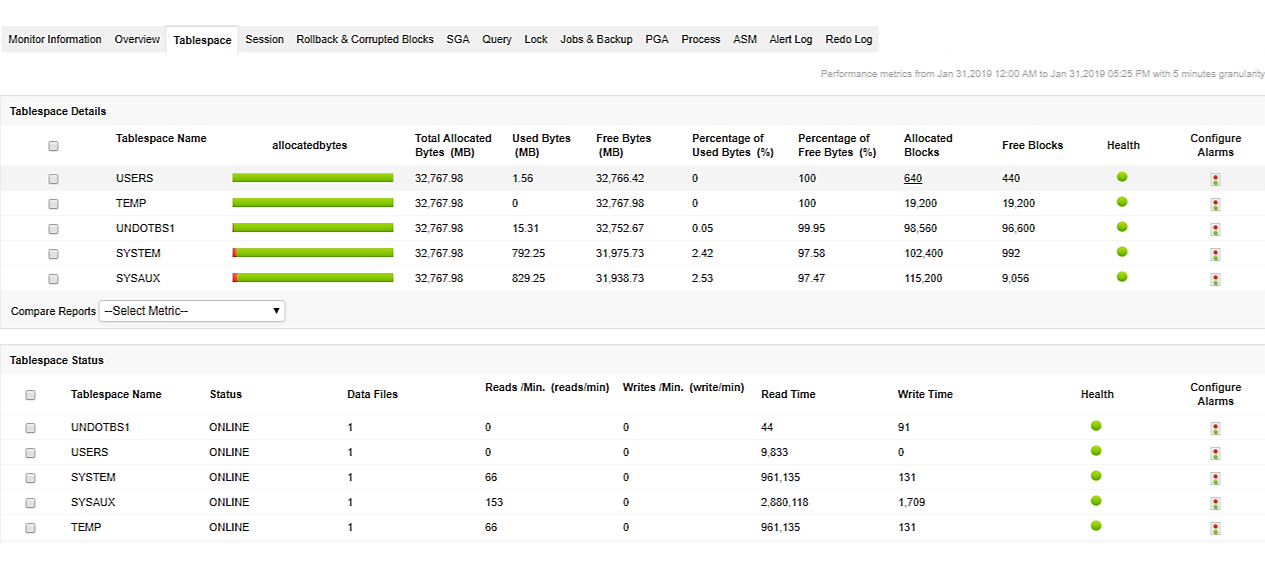
Applications Manager's Oracle performance monitoring capability tracks the usage and growth of your Oracle tablespace and helps you ensure proper provisioning of tables. Utilize Applications Manager Oracle monitoring tool to monitor the performance and status of tablespaces by keeping an eye on important metrics like allocated bytes, allocated blocks, percent of used and free bytes, free blocks, read/write data, datafiles' details and more.
Learn more about monitoring tablespaces.

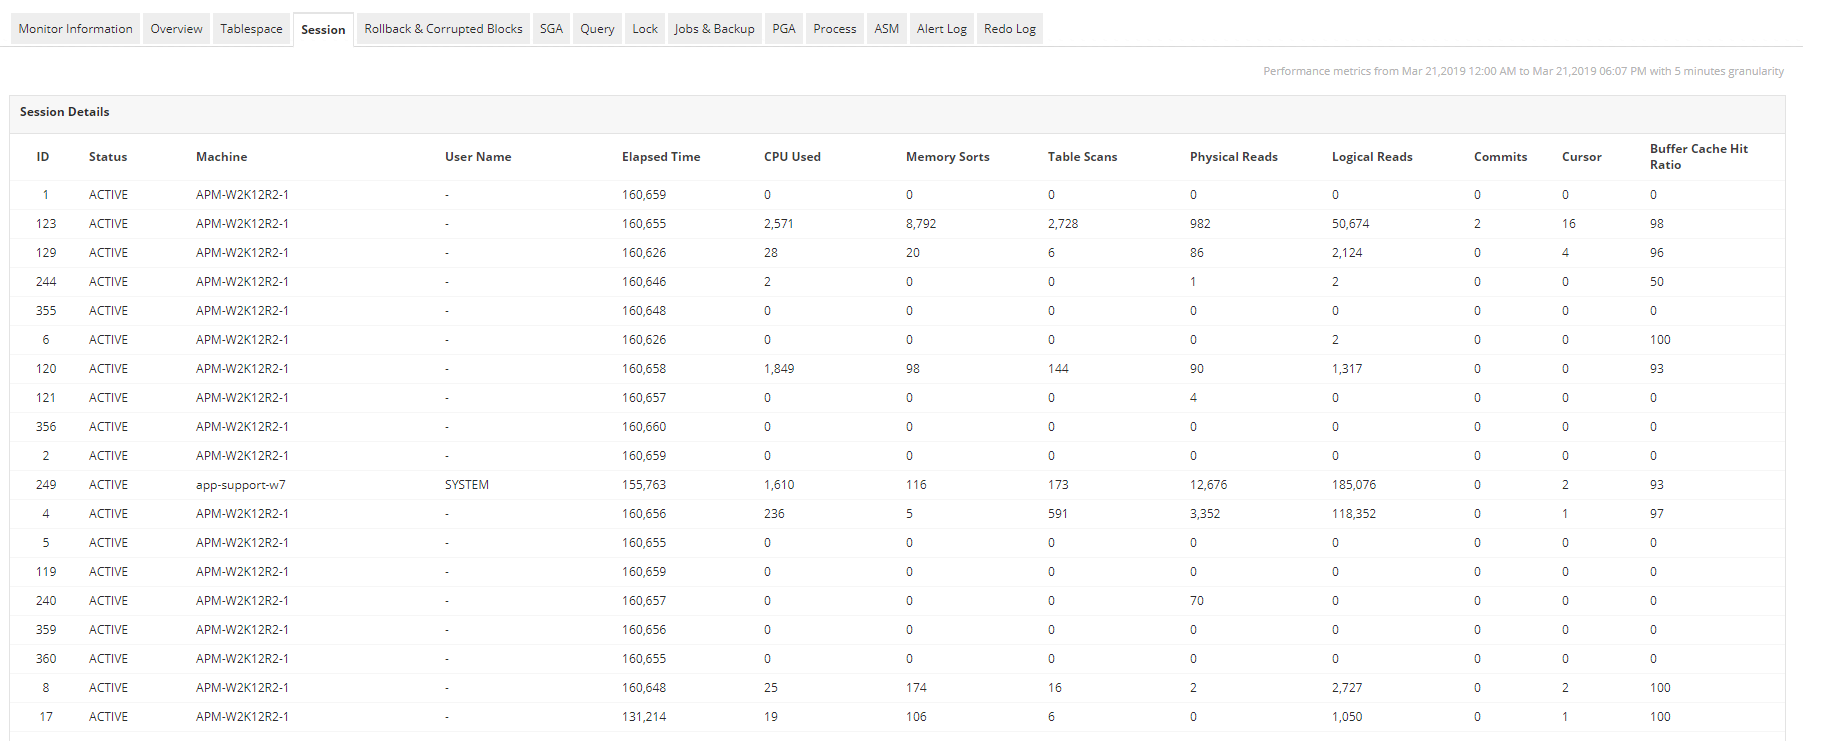
By monitoring Oracle sessions, you gain valuable information about the server load, and using Oracle monitoring tools like Applications Manager's Oracle monitoring solution makes it easy to optimize your database. You'll receive details regarding sessions, session users, session summary, and session wait.
Learn more about monitoring Oracle sessions.

When it comes to optimization of resource usage and query latency, efficient storage of data in memory goes a long way. With Applications Manager's Oracle DB monitoring feature, monitor Oracle database's memory structures and processes by tracking PGA and SGA stats.
Learn more about monitoring Oracle memory structures.

Oracle ASM manages the underlying disk storage; it acts as an interface between the Oracle instance and storage devices that contain the actual data. It simplifies the administration of Oracle related files by evenly distributing individual disks and files into disk groups. With Applications Manager's Oracle performance monitor, you can view ASM statistics graphically, with full drill-down capability to the ASM disk group and ASM disk level.
Learn more about monitoring ASM disks.
Learn how to optimize your Oracle database with ManageEngine Applications Manager. Schedule a personalized demo!
Request DemoOracle Scheduler allows you to design schedules and run programs on designated schedules. While most Oracle server monitoring tools offer surface-level metrics about database health and availability, Applications Manager's Oracle monitoring tracks the performance and status of numerous other metrics, such as Oracle jobs and backup jobs. Information about the status of jobs, last run status, last run duration, run count, and failure count can reveal a lot about your Oracle database's efficiency.
Learn more about monitoring Oracle jobs.

In order to effectively set up a stable data protection system, it's important to understand your recovery point objective (RPO) and recovery time objective (RTO) needs. An ideal Oracle monitoring tool like Applications Manager monitors the log apply gap and log apply lag metrics for a deeper insight into how far the standby database is behind the primary database. To prevent data loss caused by such a lag, monitoring these metrics can prove useful in taking corrective action to bring both the primary and standby instances in sync.
Applications Manager has a dedicated RPO panel that showcases the archive log details for the primary database where you can get the statuses of the log destination as well as the protection, transmit, and recovery modes. You can also track the databases that are created under the physical and logical standby modes by the Oracle Data Guard environment through our Oracle monitor console.
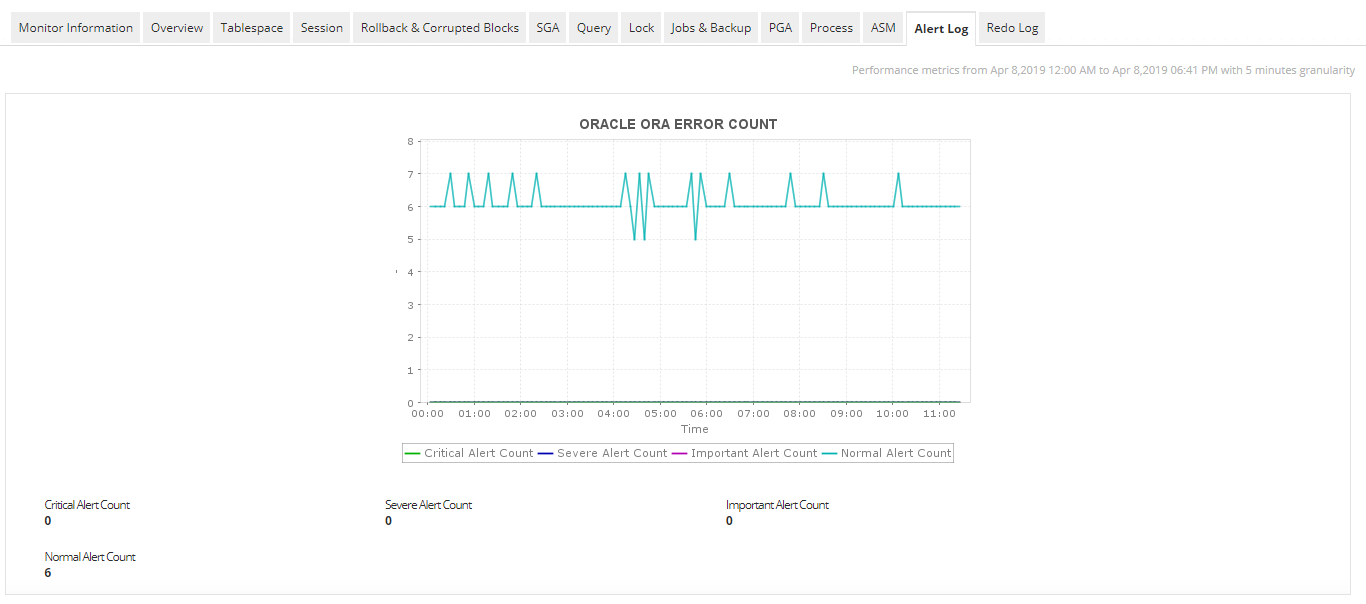
When your database encounters an issue, it's important to examine your alert logs. During alert log monitoring, it's critical to filter the warning logs from the actual error logs. Database Performance Analyzer for Oracle by Applications Manager collects these logs and classifies them into severe, critical, important, and normal alerts for effective monitoring. It also provides granular details about the logs, such as message level, record ID, originating time, host address, and message text.

Applications Manager collects data on blocked sessions which can be analyzed to understand the queries that are waiting for lock and help administrators take a call on the session that needs to be killed. With it's blocked session monitoring capability, you can get information on both the waiting and blocking sessions which makes it easier to resolve lock conflicts.

In most cases, slow latency is the result of queries or locks. By monitoring queries and locks, you can drill down and isolate the SQL statements and locks consuming significant time. You can also monitor custom queries with Applications Manager Database Query monitoring.
Learn more about Database Query monitoring.
Applications Manager's Oracle application monitoring capability provides you with a highly functional fault management system that includes a Root Cause Analyser, which allows you to identify the source of the faults and resolve issues faster. You can set thresholds for various Oracle performance attributes and receive alerts immediately upon violation. By setting up Anomaly Profiles, you can recognize gradual degradation in performance and prevent it from going downhill by resolving issues before they become potential threats.
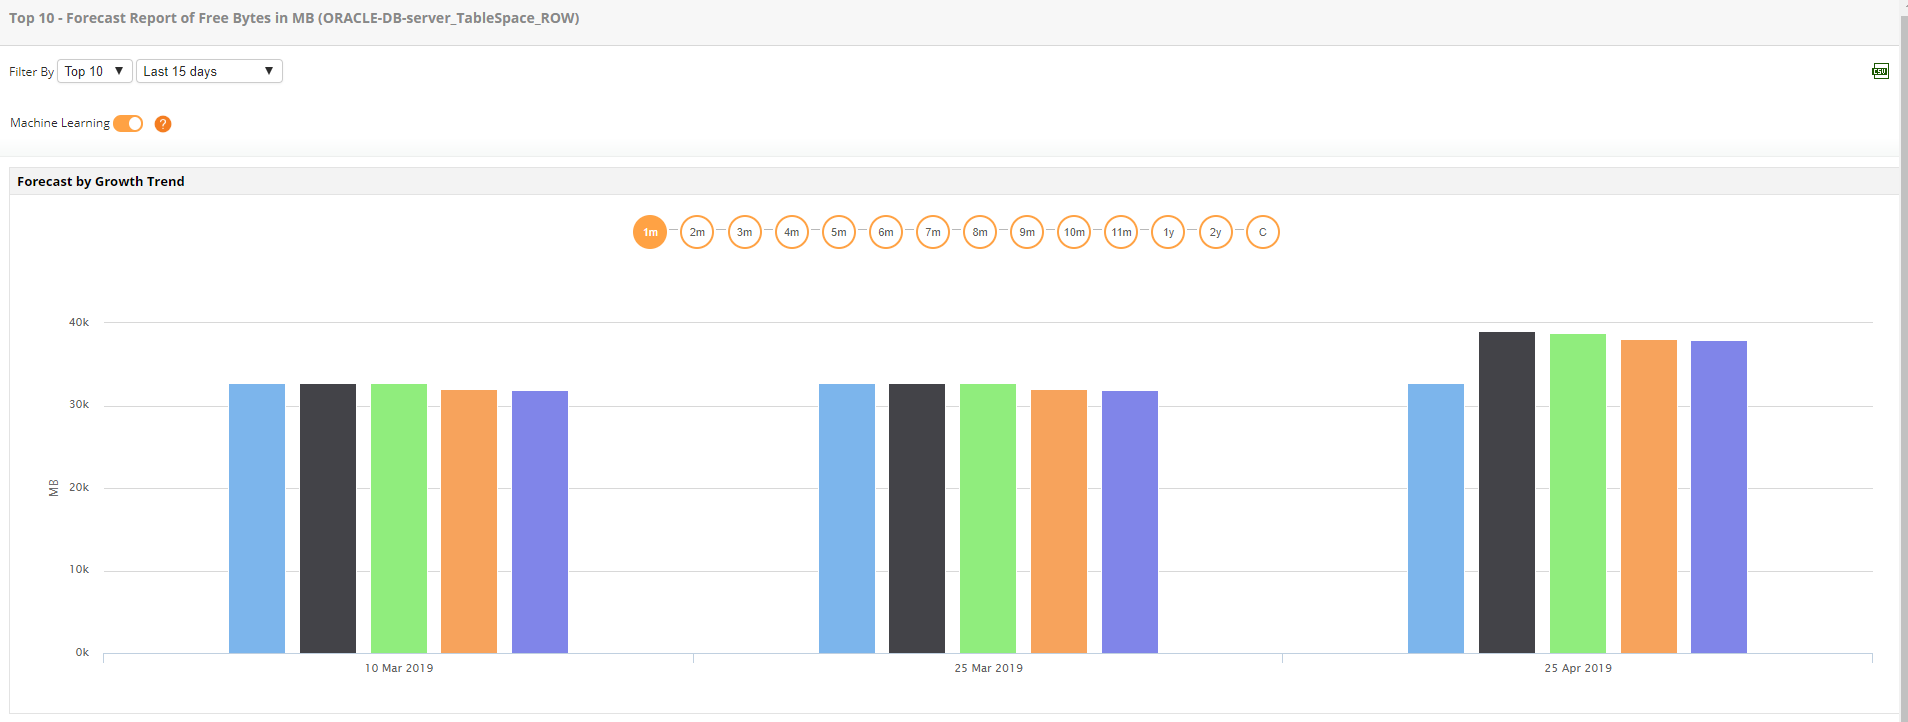
View graphs and historical performance for all Oracle database attributes. With trend analysis reports, you can analyze performance trends with increased precision. Using Applications Manager's Oracle performance monitor, you'll make informed decisions with forecast reports, which perform predictive analysis by using machine learning techniques.

To know more about all the Oracle technologies that Applications Manager supports, click here. You can also check out our Oracle server monitoring tools page.
Applications Manager is more than just an Oracle DB monitoring tool; it also offers comprehensive monitoring for the following databases: