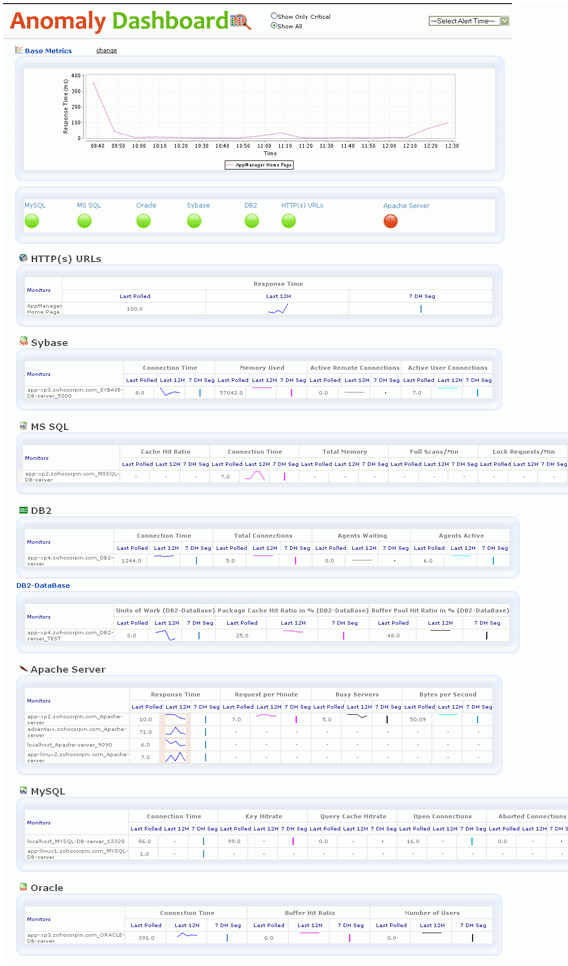
The performance of monitors can be viewed from Anomaly Dashboards. It helps the user to intuitively scan through hundreds of performance metrics with ease. If the health of monitor/monitor group has turned critical, you can troubleshoot via Anomaly Dashboards.
Sparkline Graphs on last polled value, 12 hour average, 7 day segmented by hour metrics, etc. help provide the visibility you will need to quickly identify a problem when an Event is generated in production. Additionally, the ability to even view metrics across technologies for a specific "Business Service" adds to the flexibility and usability of the dashboard.
Click here to know more about Anomaly Detection.

It allows us to track crucial metrics such as response times, resource utilization, error rates, and transaction performance. The real-time monitoring alerts promptly notify us of any issues or anomalies, enabling us to take immediate action.
Reviewer Role: Research and Development
Trusted by over 6000+ businesses globally