Oracle Solaris, a Unix operating system known for its reliability and scalability, is one of the most widely used Unix OSs among businesses across the globe. For businesses using Solaris servers, a proper Solaris monitoring solution is the key to efficiency.
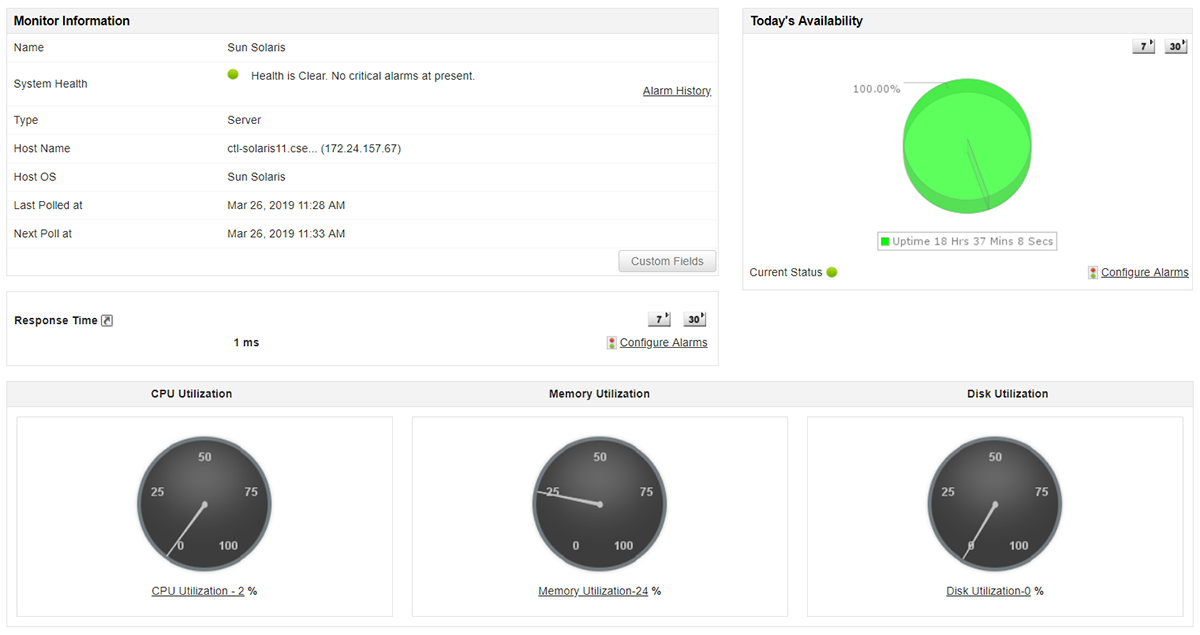
Applications Manager's Solaris performance monitoring enables IT admins to track the performance and availability of Solaris servers and receive alerts during downtime. Unlike most Solaris performance monitoring tools that offer only health and availability stats for your database, Applications Manager checks usage patterns, offers insights to plan capacity, and helps track issues and resolve them before they pose a threat to business operations.
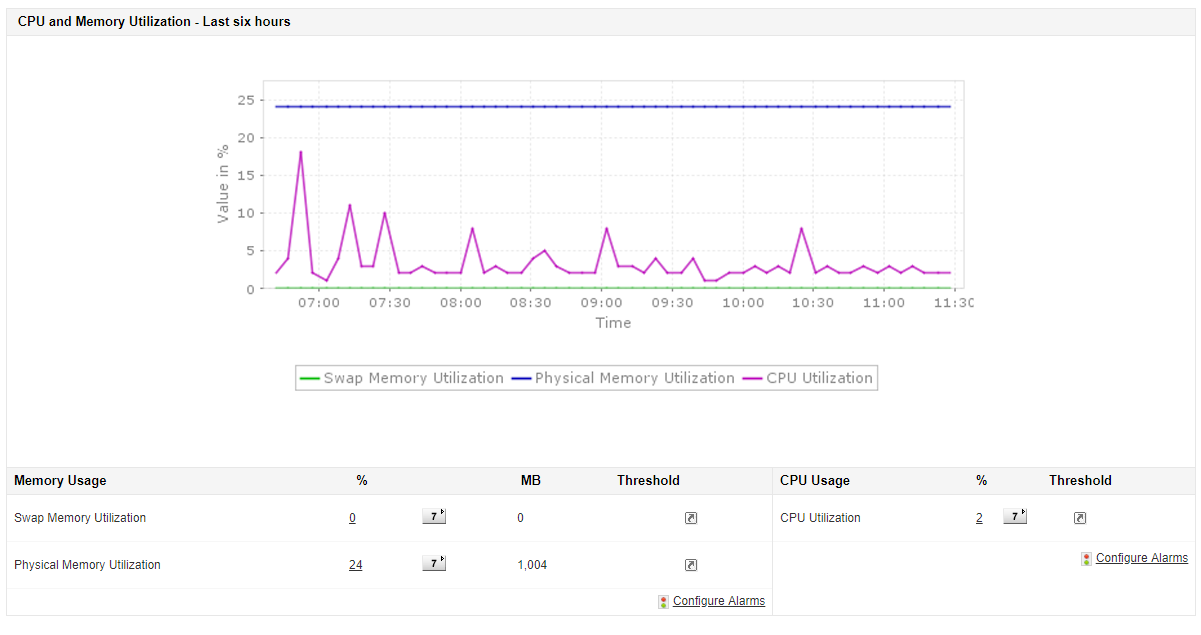
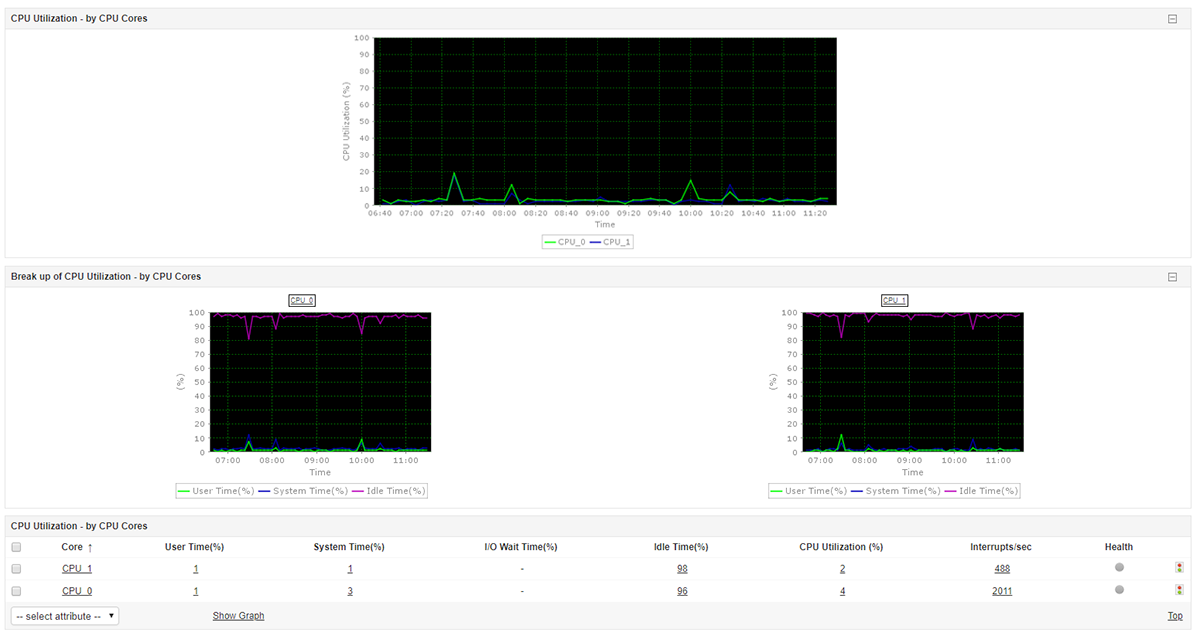
Applications Manager's Solaris performance monitoring capabilities enable you to constantly check on the performance stats of key parameters such as memory usage, system load, and system processes running behind the Solaris server. Keep track of CPU utilization stats for individual cores including parameters such as Blocked Processes, User Time, System Time, I/O Wait Time, Idle Time, and Interrupts/Sec to estimate the size of the load processed by your Solaris server. If the critical threshold for CPU utilization is violated, an email containing the CPU's top ten consumed processes is triggered and sent to the IT admin.
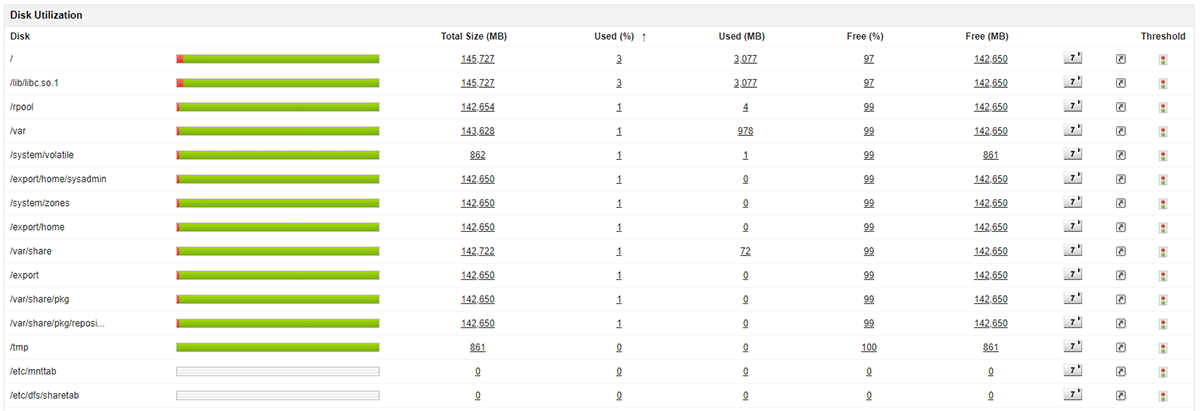
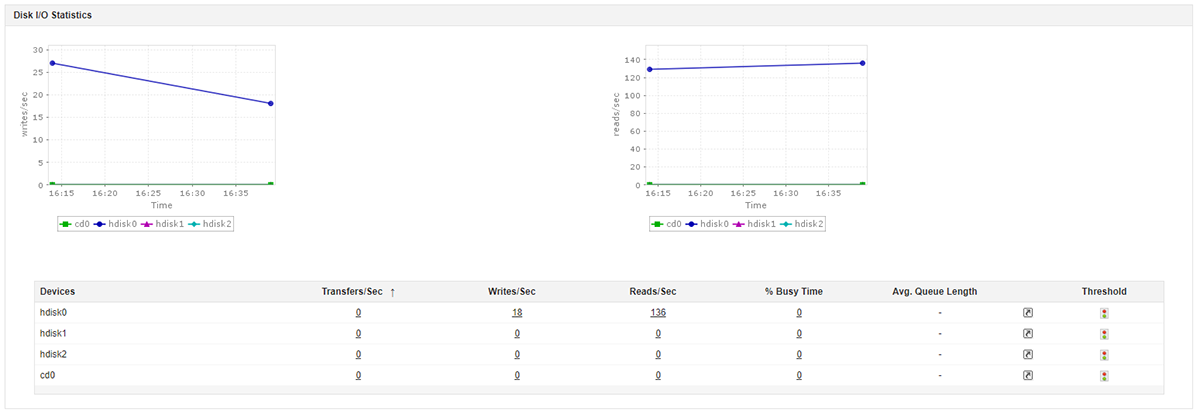
Our Solaris performance monitoring tool can help closely track disk utilization with a disk wise break-up, ensuring that disk space errors are always captured. With detailed disk I/O statistics enabling you to monitor disk transactions individually, regulating disk usage is easy.

See how Applications Manager can meet your Solaris monitoring requirements. Schedule a personalised demo now!
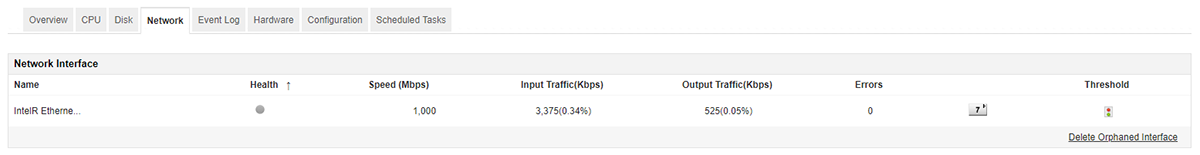
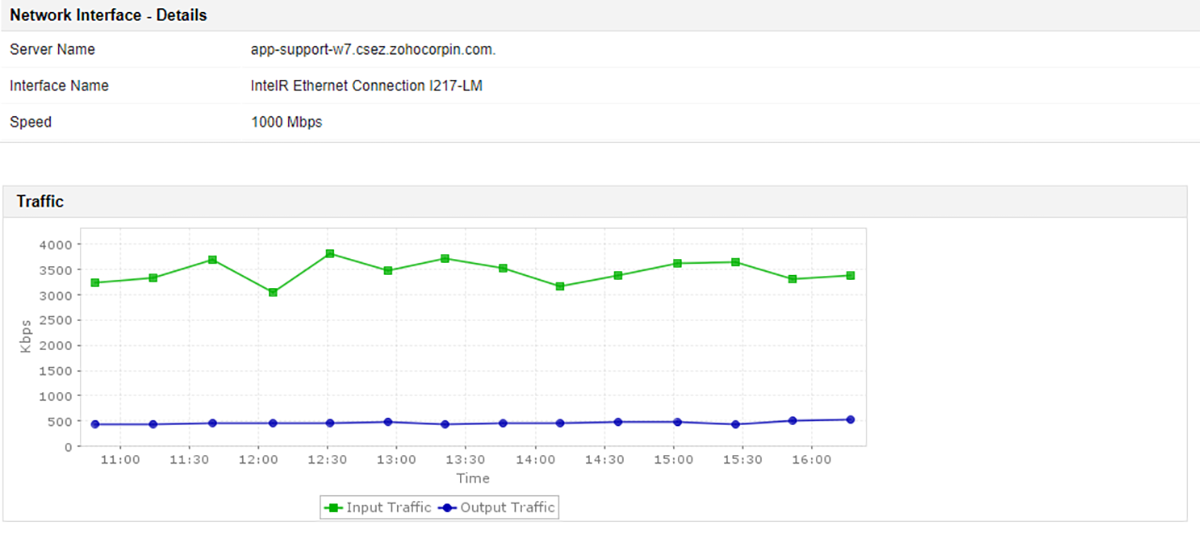
Request DemoApplications Manager's Solaris monitoring enables you to identify the status of machines and their performance in the network with ease. It monitors essential parameters such as traffic, utilization, and number of packets sent or received in a network interface, enabling you to understand how much network load the server handles.
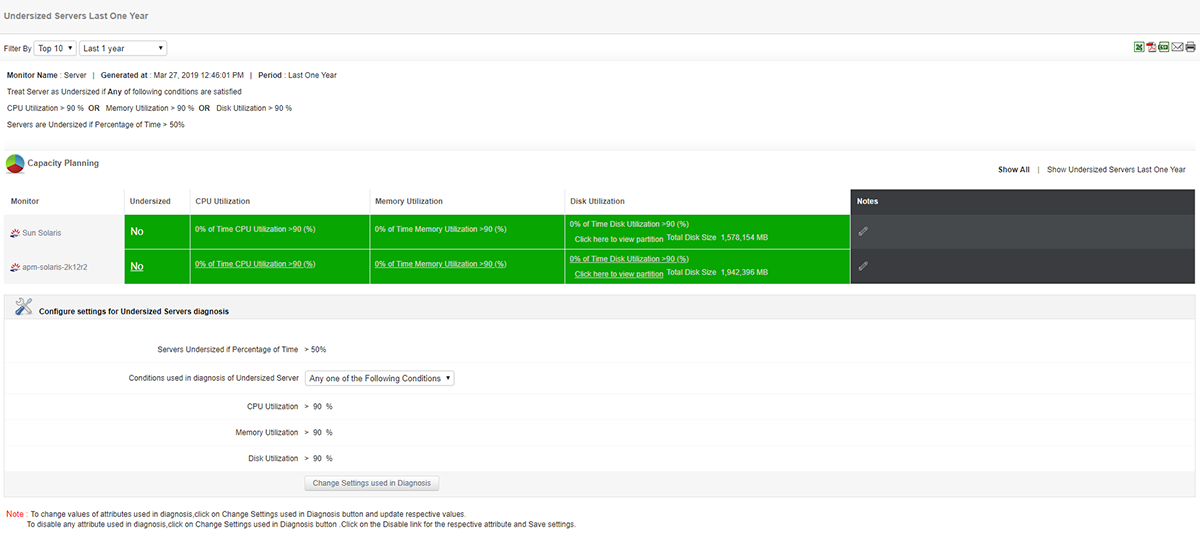
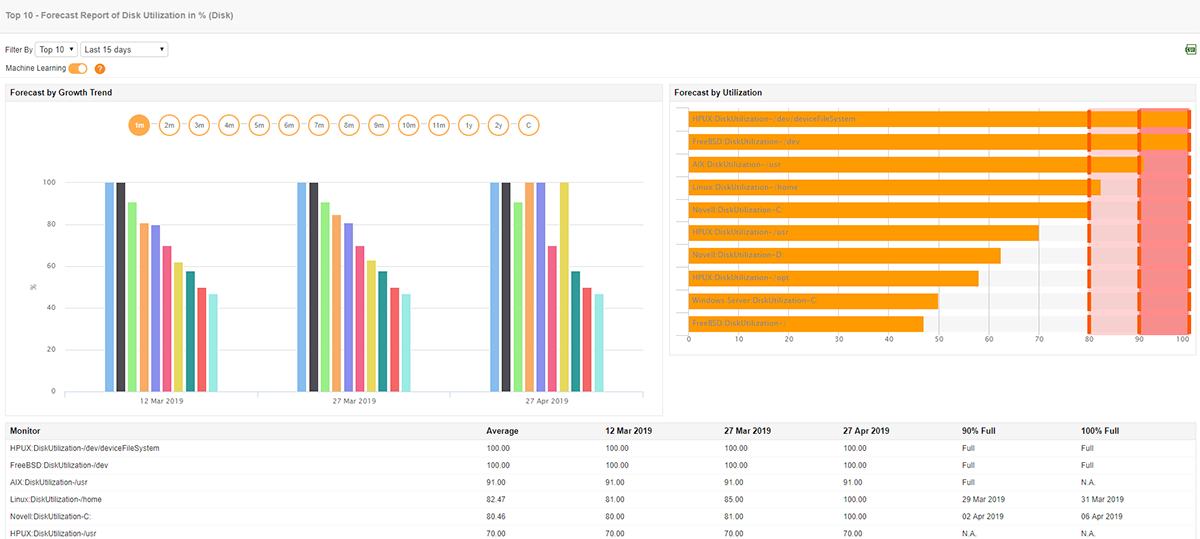
Solaris performance monitoring with Applications Manager includes deep analytical capabilities to measure and track resource utilization and attribute performance trends of Solaris servers. You can compare and analyze attribute-wise historical performance trends as well as use machine learning to forecast future growth and utilization trends of your Solaris servers. The built-in capacity planning reports help identify servers that are overutilized or underutilized, and aid in load distribution plans.
Applications Manager is a powerful performance monitoring solution with comprehensive monitoring, alerting, and reporting capabilities, and is the preferred choice of IT admins for Solaris performance monitoring. Applications Manager supports more than 100 popular business applications across servers, VMs, databases, cloud apps, ERP suites, web servers, and more. If you're looking for Solaris performance monitoring tools, download a free trial of Applications Manager to test your Solaris monitoring requirements.
It allows us to track crucial metrics such as response times, resource utilization, error rates, and transaction performance. The real-time monitoring alerts promptly notify us of any issues or anomalies, enabling us to take immediate action.
Reviewer Role: Research and Development

"I like Applications Manager because it helps us to detect issues present in our servers and SQL databases."
Carlos Rivero
Tech Support Manager, Lexmark
Trusted by over 6000+ businesses globally