Schedule demo


ManageEngine has been recognized as a Customers' Choice in the 2023 Gartner Peer Insights™ Voice of the Customer for Application Performance Monitoring and Observability report. Learn more

Monitor Oracle Sessions

Oracle Performance Monitoring: Monitor Oracle Sessions

Monitoring Oracle Sessions made easy

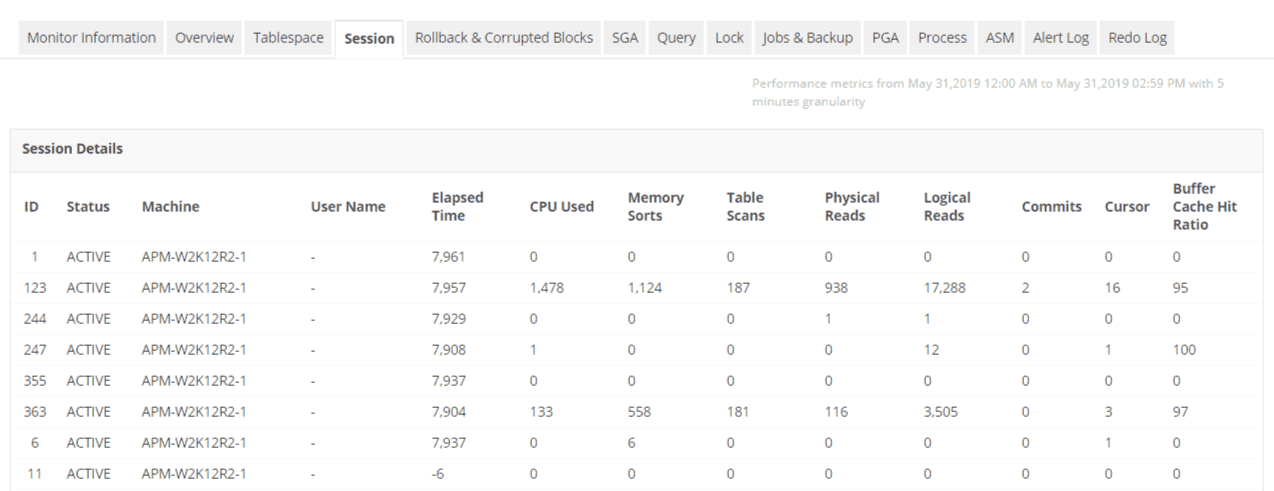
The ManageEngine Applications Manager Oracle Monitoring capability includes monitoring Oracle Sessions. A session consists of every connection to the Oracle database by a user from a specific process. By tracking the number of Oracle sessions, we can track how busy a particular server is. This gives insight on how loaded an Oracle Database is. It also helps understand which users take more system resources.

It is hence important for the database administrator to monitor the sessions in addition to monitoring tablespace, monitoring datafiles for ensuring smooth functioning of production databases. Below graphic represents Applications Manager's Oracle User Session monitoring capability.
Monitor Oracle Sessions

Metrics while monitoring Oracle Sessions:

Some of the metrics for Oracle datafile management are as follows.

  • User Session : This tells the exact user connecting to the Oracle DB and can also help identify which business application / host is using the Oracle database resources.
  • Elapsed Time : helps identify time a specific user uses the Oracle database and gives hints on users who could even be running long running queries.
  • CPU Used by a Specific User: helps identify users consuming high system resources. Helps segment users and identify if non critical business applications are consuming high system resources.
  • Number of Memory Sorts : helps identify if queries used by a specific user are optimal or can be optimized even more.
  • Number of Oracle Table Scans: helps identify if queries used by a specific user are optimal or can be optimized even furthur.
  • Physical Reads: gives an indication of how many times the disk is hit for a specific user. These metrics together with the other metrics give an good indication of where system resources are being spent.
  • Monitor Logical Reads
  • Monitor Number of Commits
  • Cursor
  • Buffer Cache Hit Ratio

Related Oracle Monitoring Capability

Loved by customers all over the world

"Standout Tool With Extensive Monitoring Capabilities"

It allows us to track crucial metrics such as response times, resource utilization, error rates, and transaction performance. The real-time monitoring alerts promptly notify us of any issues or anomalies, enabling us to take immediate action.

Reviewer Role: Research and Development

"I like Applications Manager because it helps us to detect issues present in our servers and SQL databases."
Carlos Rivero

Tech Support Manager, Lexmark

Trusted by over 6000+ businesses globally