Home » Kafka Observability Guide » Container observability and metrics
Advanced Kafka Observability: Achieving deep visibility for mission-critical data streams
Apache Kafka has solidified its position as the foundational technology for building scalable, fault-tolerant, and high-throughput data streaming platforms, underpinning critical operations across diverse industries. Its pervasive use, from real-time analytics and log aggregation to serving as the backbone of microservices architectures, necessitates a shift beyond traditional monitoring paradigms as deployments scale across distributed systems and mission-critical workloads.
This guide delves into the realm of advanced Kafka observability, moving beyond surface-level metrics to equip DevOps, SREs, and development teams with the tools and techniques required for deep visibility into Kafka internals and its surrounding ecosystem. We will explore the modern Kafka observability stack, encompassing AI-powered anomaly detection, distributed tracing, predictive analytics, and multi-cluster observability, demonstrating how these sophisticated approaches drive both enhanced operational efficiency and tangible business success.
1. The evolution of Kafka Observability
Kafka observability has progressed from basic monitoring of system metrics such as CPU utilization and disk throughput to a sophisticated, AI-driven paradigm centered on proactive insight and business correlation. Key pillars of this evolution include:
Proactive issue detection: Traditional alerts depend on static thresholds and reactive triggers. Advanced tools now leverage historical baselines and intelligent trend analysis to identify deviations before they manifest as service disruptions.
Dependency mapping: Kafka clusters interact with producers, consumers, databases, storage systems, and APIs. By mapping these interdependencies, teams can identify ripple effects—such as a slow consumer impacting upstream producer performance or causing message backlog.
AI/ML-based anomaly detection: Machine learning models trained on historical Kafka telemetry data can identify patterns that may not be apparent through human observation. Whether it is a subtle performance drift or a gradual increase in lag, AI enhances situational awareness.
Synthetic testing: Simulating producer and consumer activity allows teams to benchmark cluster health, test failover readiness, and measure latency under controlled stress scenarios.
Understanding this evolution enables teams to transition from basic system checks to a proactive, resilient operational model.
2. Real-time Kafka performance profiling
Profiling Kafka performance in real time provides immediate insights into data flow and areas of inefficiency. This facilitates quicker mitigation and long-term optimization. Key techniques include:
Event flow visualization: Visual dashboards mapping the lifecycle of a message—from producer to broker and onto the consumer—reveal end-to-end delays and bottlenecks.
Latency decomposition: Breaking down latency into discrete components such as network transmission time, Kafka internal queueing, and consumer deserialization. Identifying high-latency zones enables precise tuning.
Partition imbalance detection: Uneven data distribution can overload specific brokers or consumer threads. Tools that flag skewed partition traffic assist in effective topic rebalancing.
JVM profiling: As Kafka operates on the JVM, aspects such as garbage collection, thread locks, and heap usage are critical. Profiling heap dumps, GC logs, and thread contention reveals inefficiencies not visible at the Kafka metric layer.
These profiling techniques contribute to optimizing Kafka clusters not only for performance but also for cost-efficiency and scalability.
3. Correlating Kafka logs with business impact
Raw metrics do not always provide a comprehensive understanding. Recognizing the real-world impact of technical anomalies—such as a spike in consumer lag—requires establishing connections between infrastructure and business KPIs. Strategies for achieving this include:
Contextual logging: Enriching logs with meaningful business metadata—customer IDs, transaction IDs, session details—allows logs to serve as investigative tools during service degradations.
Multi-layer correlation: Combining Kafka logs with application, API gateway, and database logs to trace an event across systems. This full-stack context improves root cause identification.
Real-time dashboards: Constructing dashboards that correlate increases in consumer lag with delayed order processing or failed transactions. When teams observe the business consequences, prioritization becomes clearer.
Distributed tracing: Utilizing frameworks such as OpenTelemetry to trace messages through Kafka and into downstream services. These traces visualize request paths, highlighting failure points across service meshes.
This business-centric observability ensures that teams not only resolve issues more rapidly but also address those with the most significant impact.
4. Advanced alerting and automated remediation
Effective observability minimizes alert fatigue while ensuring that critical issues are addressed promptly. This balance is achieved through intelligent, context-aware alerting. Key features include:
Adaptive thresholds: Instead of static, one-size-fits-all thresholds, advanced systems adjust based on factors such as time-of-day, workload patterns, or business calendars.
Event correlation engines: These systems group related alerts into incidents, reducing noise. For example, a slowdown in a consumer application, increased broker load, and message retries may indicate a single underlying issue..
Automated playbooks: Implementing automated actions such as:
Restarting failed consumers automatically when lag exceeds defined thresholds.
Triggering horizontal scaling of consumers via Kubernetes autoscaling.
Rerouting messages to backup topics in the event of persistent errors.
Escalation & integration: Alerting systems should integrate with platforms such as Slack, PagerDuty, or ServiceNow for incident management, with severity-based routing and SLA-based escalation policies.
Advanced alerting not only enhances visibility but also empowers teams to act swiftly and with greater confidence.
5. Observability in multi-cluster & cloud-native Kafka deployments
In contemporary architectures, Kafka often spans hybrid clouds, edge environments, and containerized microservices. Observability strategies must adapt accordingly. Considerations for these deployments include
Cross-cluster visibility: With Kafka MirrorMaker and Confluent Replicator, data frequently traverses multiple clusters. Tracking replication lag, partition synchronization status, and throughput is essential to ensure consistency.
Multi-cloud correlation: Kafka brokers on platforms like AWS may interact with consumers on Azure and data lakes on GCP. Observability tools must consolidate performance data across cloud boundaries.
Kubernetes observability:
Monitoring Kafka pods for restarts, memory throttling, and node availability.
Utilizing Prometheus and Grafana with exporters to visualize broker health in real time.
Linking Kafka service metrics with other workloads within the same namespace for dependency awareness.
Security monitoring: Auditing topic access logs, monitoring TLS/SSL handshake errors, and detecting anomalous IP addresses. Forwarding these events to SIEM platforms is crucial for security operations.
Cloud-native observability ensures performance, resilience, and compliance at scale.
6. AI-powered predictive analytics for Kafka
Predictive analytics enables teams to anticipate failures and resource bottlenecks. Instead of reacting to incidents, proactive measures can be taken. Advanced techniques include:
Advanced anomaly detection: Employing unsupervised learning methods (e.g., Isolation Forests, clustering) to detect outliers in traffic patterns, consumer behavior, or error rates.
Capacity planning: Utilizing time series forecasting (e.g., ARIMA, Prophet) to predict broker storage usage, message volume growth, or consumer demand.
Failure prediction: Developing models trained on historical failure data to identify leading indicators—e.g., a combination of increased heap usage, GC pauses, and CPU spikes suggesting a high likelihood of broker failure.
Optimization recommendations: Leveraging reinforcement learning to simulate what-if scenarios, assisting teams in right-sizing clusters, adjusting retention policies, or rebalancing partitions proactively.
7. Kafka observability with Applications Manager
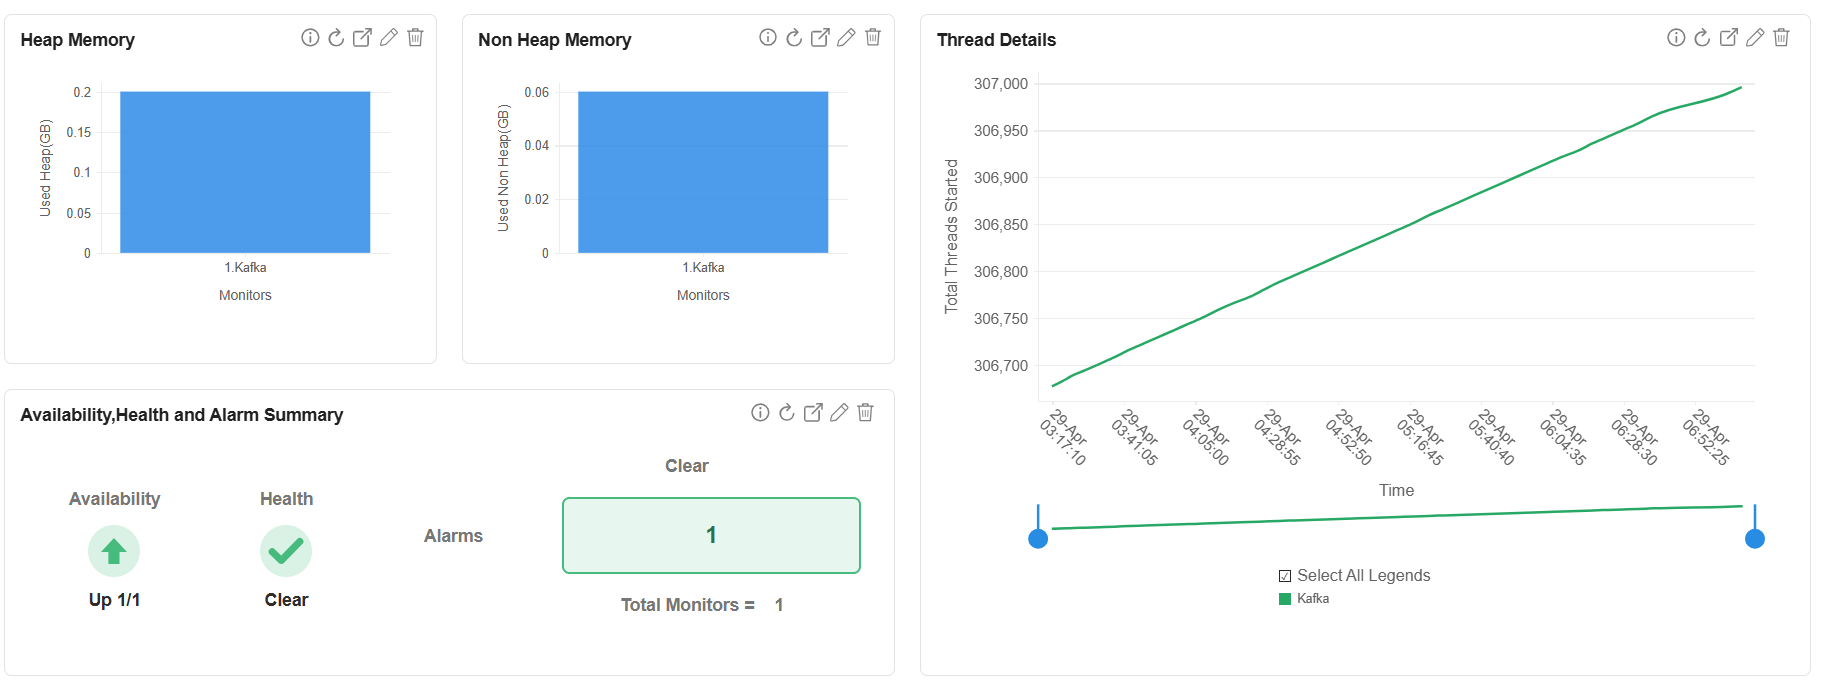
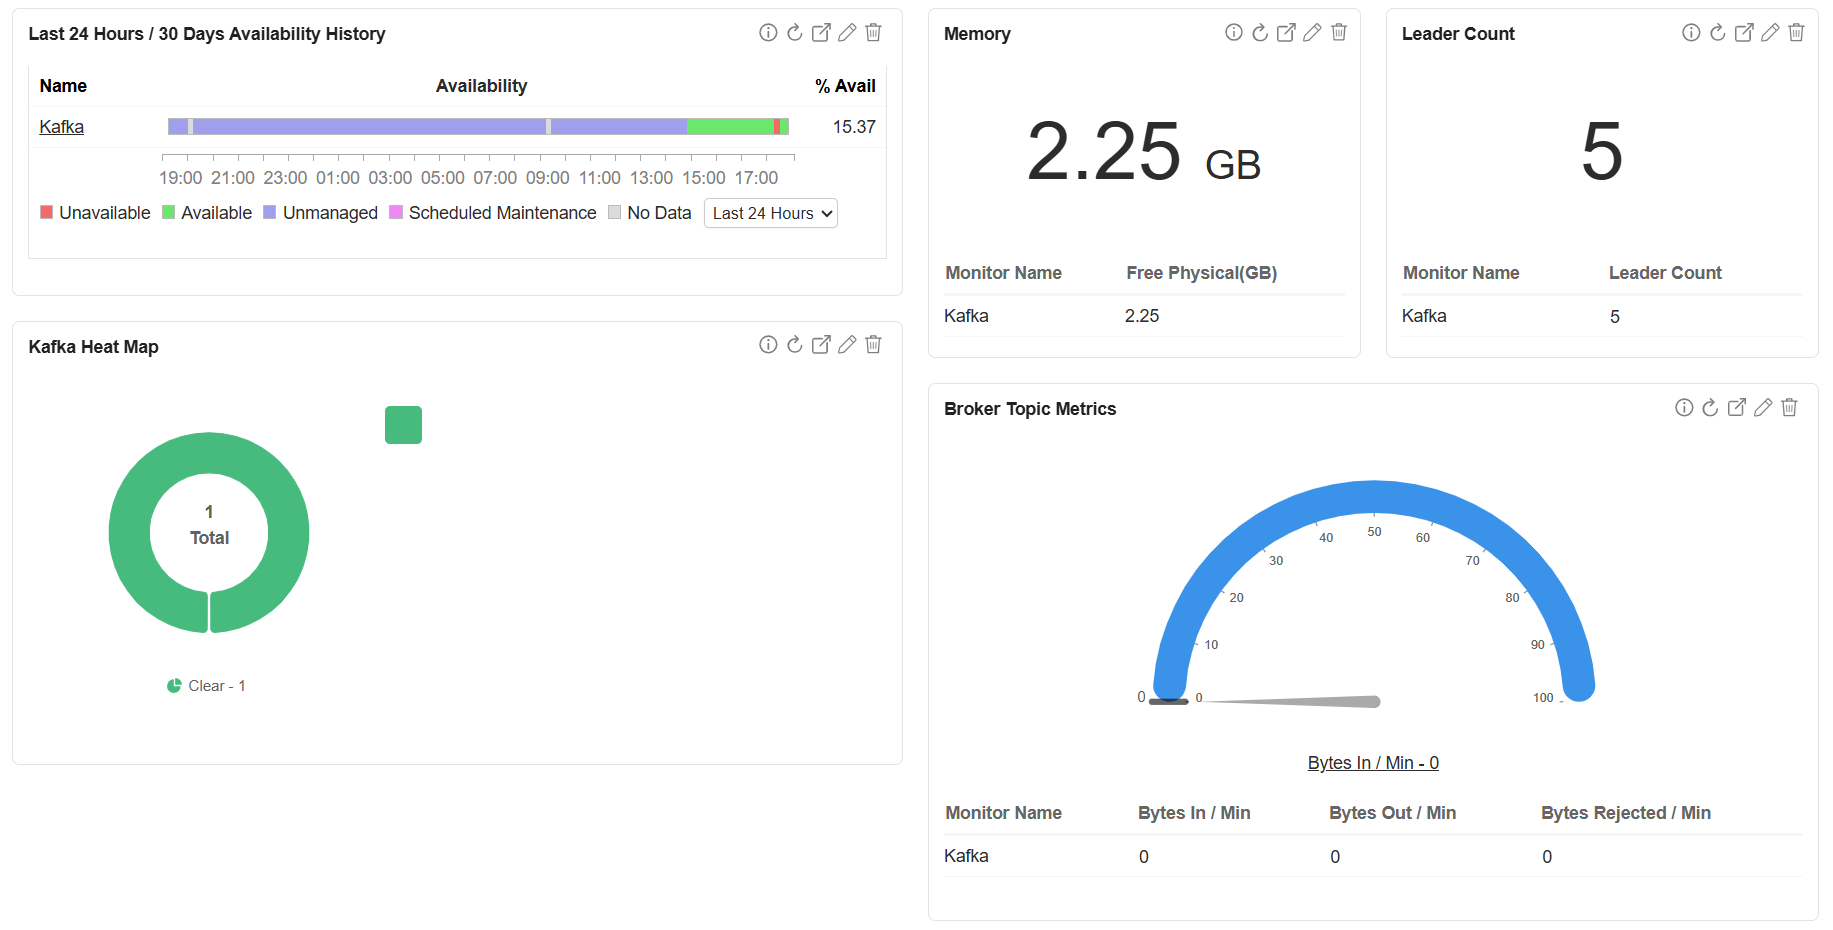
Applications Manager provides an integrated observability suite for Kafka, supporting modern use cases such as AI-driven alerts, service mapping, and intelligent dashboards. Key capabilities include:
Autonomous anomaly detection: Identifying metric anomalies based on learned baselines, enabling the detection of subtle issues like gradual lag increases or throughput declines.
Unified dashboards: Correlating Kafka metrics with user experience scores, business SLAs, and the health of downstream applications.
Automation workflows: Configuring rule-based actions—such as restarting services, notifying teams, or scaling brokers—triggered by defined conditions.
Simplified onboarding:
Adding Kafka clusters through agentless or agent-based discovery.
Defining thresholds using intelligent templates.
Utilizing tracing plugins to visualize flow between Kafka and connected applications.
With Applications Manager, observability becomes a strategic and actionable asset.
ManageEngine Applications Manager provides a comprehensive suite for advanced Kafka observability, building upon the essential metrics highlighted in our blog, Kafka Monitoring: Metrics that matter. This foundation of key metrics complements the advanced anomaly detection and unified dashboards discussed here.
Conclusion
Modern Kafka observability transcends mere failure detection; it encompasses understanding Kafka's impact on business operations, ensuring resilience at scale, and preventing issues before they arise.
By integrating AI, tracing, multi-cluster visibility, and predictive analytics, observability evolves into a significant force multiplier for Kafka operations. Tools like ManageEngine Applications Manager facilitate this transformation, empowering teams to scale confidently, troubleshoot effectively, and align performance with business objectives. Investing in advanced Kafka observability today transforms your Kafka pipeline from a potential blind spot into a transparent, controllable, and business-aligned asset.
Priya, Product Marketer
Priya is a product marketer at ManageEngine, passionate about showcasing the power of observability, database monitoring, and application performance. She translates technical expertise into compelling stories that resonate with tech professionals.
Loved by customers all over the world
"Standout Tool With Extensive Monitoring Capabilities"
★★★★★
It allows us to track crucial metrics such as response times, resource utilization, error rates, and transaction performance. The real-time monitoring alerts promptly notify us of any issues or anomalies, enabling us to take immediate action.
Reviewer Role: Research and Development
"I like Applications Manager because it helps us to detect issues present in our servers and SQL databases."
Carlos Rivero
Tech Support Manager, Lexmark
Trusted by thousands of leading businesses globally