Optimizing MySQL performance: A deep dive into common bottlenecks
MySQL is a robust and widely adopted database engine, but even the most dependable systems can run into performance issues. When applications slow down, replication falls behind, or timeouts disrupt user experiences, MySQL often sits at the center of the problem. Identifying the specific root cause, however, can be a challenge.
Relying solely on basic metrics like server uptime or CPU usage can mask critical early warning signs. Most MySQL performance problems begin as subtle inefficiencies in queries, locks, memory usage, or connection handling, and only escalate when left unaddressed.
In this article, we examine common causes of MySQL slowdowns and explain how a MySQL monitoring strategy can help uncover and resolve them before they impact your users.
Identifying and addressing slow queries
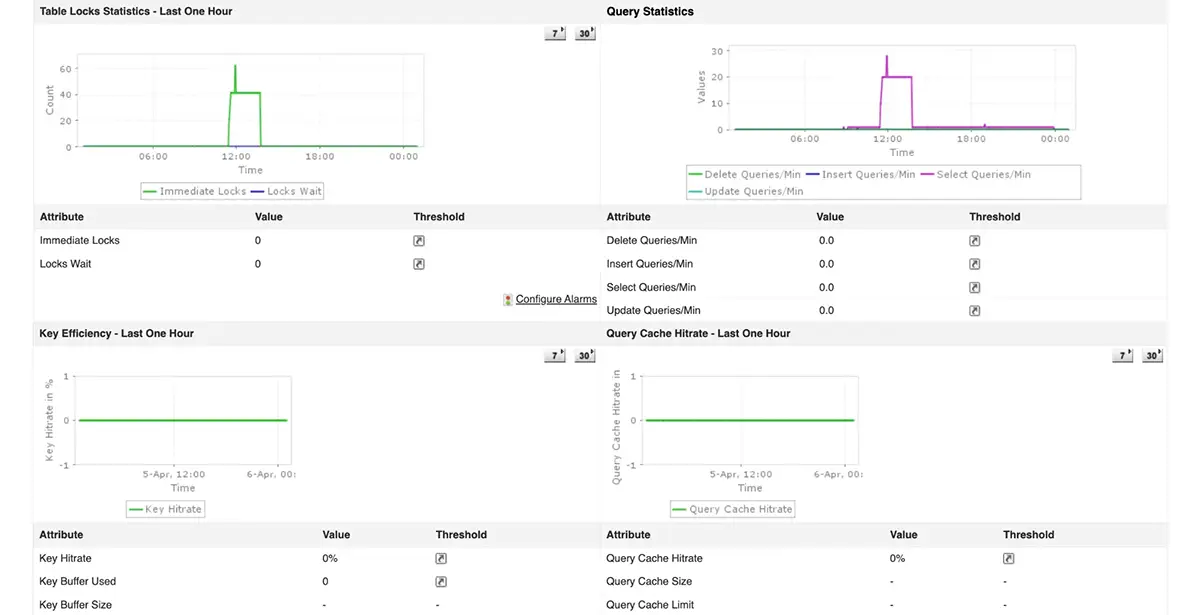
Some slow queries are easy to spot, but others hide in plain sight. A single inefficient join or a missing index can cause problems, especially when a query runs thousands of times per hour. As these queries pile up, they begin to strain CPU, memory, and disk performance.
Basic server metrics do not highlight which queries cause the most load. To optimize effectively, you need to examine:
- How long queries run
- How often they execute
- Whether they rely on full-table scans
- How well they interact with the cache.
This kind of detailed visibility allows you to fix real problems rather than guess at solutions.

Mitigating lock contention
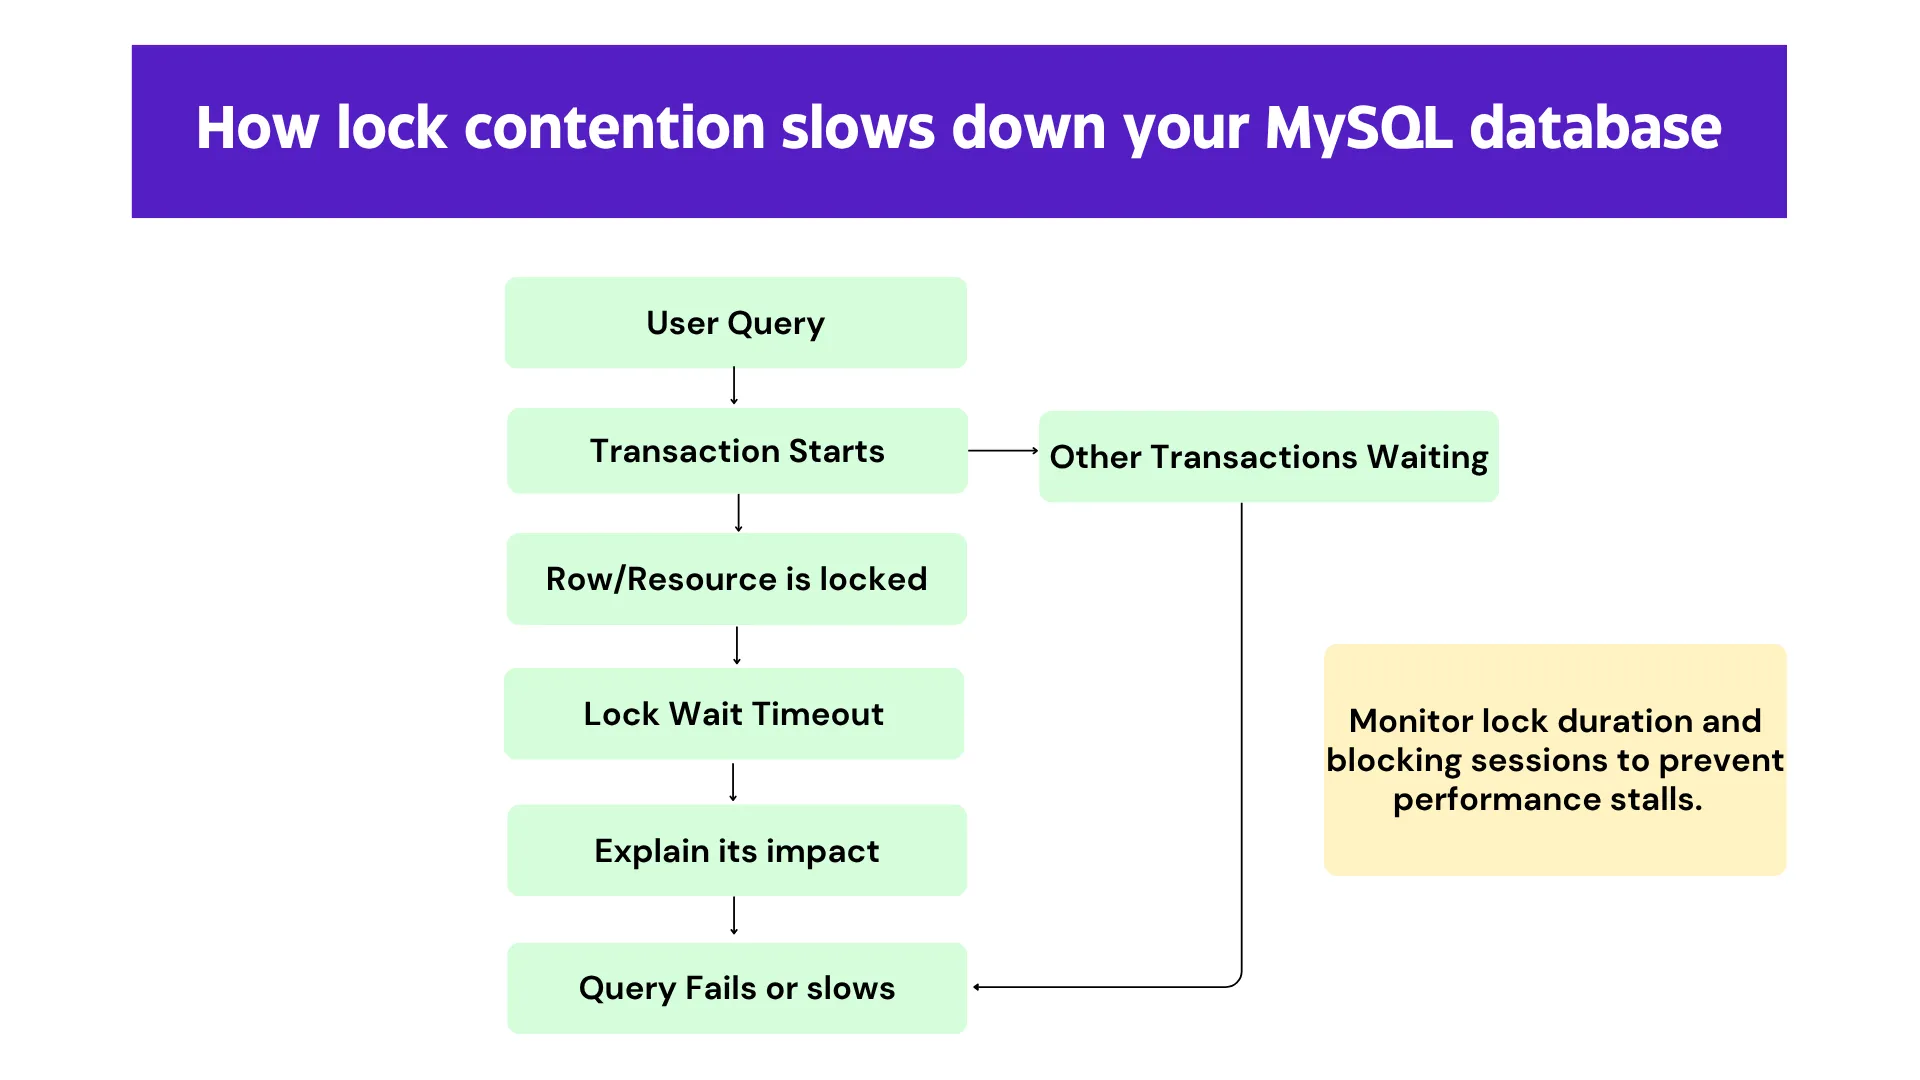
Even when your database reports no timeouts or errors, the system may still respond sluggishly. This often points to transaction-level conflicts, where multiple sessions compete for the same data and trigger locks.
Locks that last too long delay other transactions. When this happens frequently, the system experiences bottlenecks or even deadlocks.
To prevent these scenarios, it is essential to monitor:
- How long locks persist
- Which sessions create them
- Whether they rely on full-table scans
- How many transactions remain blocked at any given tim.

Addressing these issues early helps maintain performance consistency, especially under heavy user loads.
Proactive management of replication lag
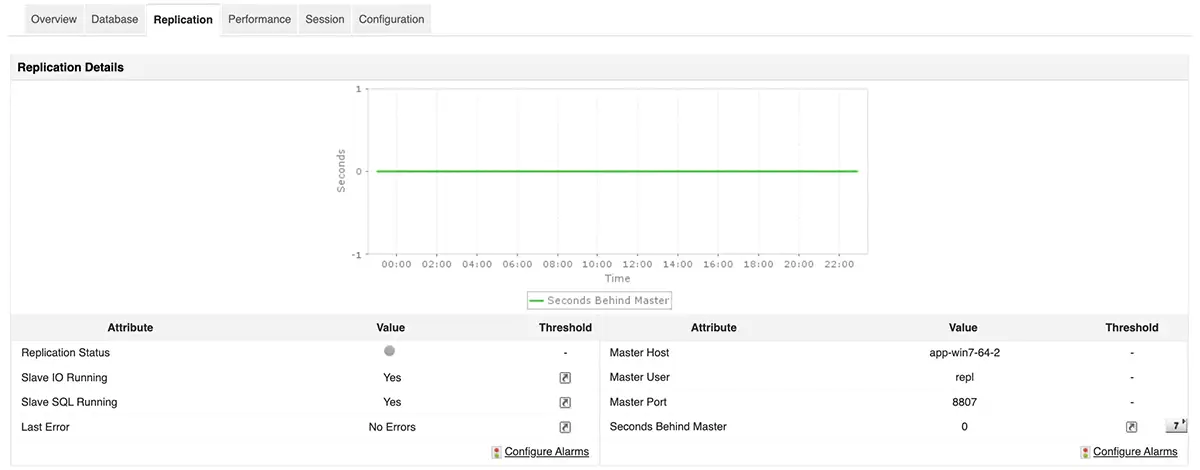
Replication allows MySQL to scale and stay resilient, but it can quickly introduce problems when replicas fail to keep up with the primary server. Once lag builds up, users may begin reading outdated data or run into inconsistencies during failovers.
Many teams overlook replication lag until it becomes a production issue, and catching up afterward can take hours. To avoid this, track replication delay in real time and monitor the health of SQL and IO threads across all replicas. Keeping replication transparent ensures better data accuracy and system reliability.

Preventing connection exhaustion
MySQL handles only a limited number of concurrent connections. When this limit is reached, new connection attempts fail, causing immediate disruption across applications.
Connection saturation can sneak up on you, especially when services leak connections, traffic suddenly spikes, or pools remain poorly configured. Watching key indicators like threads connected, threads running, and aborted connections helps detect patterns early. By spotting trends before they peak, you can scale capacity or reconfigure connection handling to avoid outages.
Optimizing memory usage
Plenty of available RAM does not guarantee efficient memory use inside MySQL. The InnoDB buffer pool plays a critical role in serving queries quickly. If it is too small or poorly configured, the database will lean heavily on disk I/O, slowing down response times.
When you notice low buffer pool hit ratios, high disk access rates, or temporary tables written to disk, it’s often a sign of deeper tuning issues. Surface-level monitoring won’t capture these behaviors. Instead, look closely at how MySQL allocates memory for caching, sorting, and temporary operations to improve internal efficiency.
Smarter alerting for proactive problem solving
Alerts are only helpful when they are meaningful. Rigid, static thresholds often generate noise, leading to alert fatigue and missed context. On the other hand, too few alerts risk missing critical issues.
Behavior-based thresholds that adapt to usage patterns provide a better alternative. They help ensure you are only notified when performance deviates from expected baselines, allowing you to focus on what matters.
Elevating your MySQL monitoring strategy
MySQL supports some of the most critical parts of your infrastructure. It deserves more than uptime checks and reactive fixes. Effective monitoring means having a comprehensive view of query behavior, lock dynamics, replication health, memory allocation, and connection activity, all consolidated in one place! For a metric-specific breakdown, check out our blog on the top 5 important metrics to monitor in your MySQL server.
ManageEngine Applications Manager delivers just that. With deep diagnostics, real-time insights, and adaptive alerting, it equips you to identify issues faster, resolve them earlier, and ensure your MySQL environment performs at its best.
Download a 30-day free trial of Applications Manager now!

