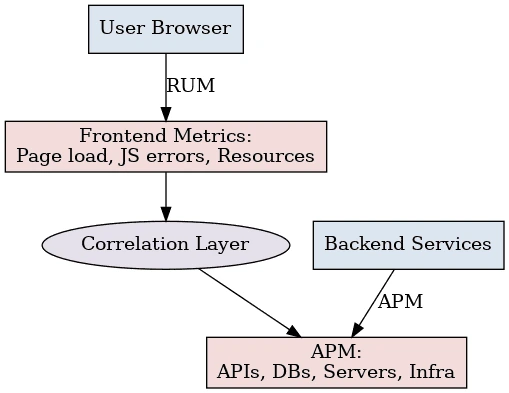
In this article, we’ll explore how RUM adds crucial context to APM, why both are necessary for modern performance management, and how organizations can bring them together effectively.
APM: A backend-first view
APM tools excel at monitoring:
- Application internals: JVM, .NET CLR, memory usage, garbage collection, transaction traces.
- Backend services: API latency, database query performance, caching layers.
- Infrastructure metrics: CPU, memory, disk I/O, network bandwidth.
- Synthetic transactions: Scripts that mimic user flows to proactively detect downtime.
This backend-first perspective answers “How are my systems performing?” It allows teams to detect bottlenecks, debug stack traces, and measure SLA compliance.
But APM has one limitation: it assumes that good backend health equates to good user experience. In reality, users can still struggle with slow rendering, JavaScript errors, network variability, or third-party resource delays even when backend metrics look fine.
RUM: The customer’s perspective
Real User Monitoring provides the missing piece by capturing what happens in the browser or mobile device of actual users.
RUM focuses on:
- Page load timing: DNS lookup, TCP connection, SSL negotiation, server response, DOM rendering.
- JavaScript errors: Failures that break interactivity.
- AJAX/XHR performance: Asynchronous requests critical to SPAs and dynamic applications.
- Device, browser, and OS diversity: Performance variations across Chrome, Safari, Android, iOS, etc.
- Geographic segmentation: Regional slowdowns due to network hops, ISPs, or CDN availability.
- Resource-level insights: Impact of images, scripts, ads, or third-party widgets.
Where APM answers “Is my app healthy?”, RUM answers “Are my users happy?”
Why APM without RUM falls short
Backend metrics look fine...
- Servers show normal CPU and memory usage
- Database queries respond within 50ms
- API latency is under budget
Yet customers still complain about sluggish checkout. What’s wrong?
Customers abandon carts, and revenue takes a hit, while your dashboards show no red flags.
How RUM complements APM
Bringing RUM and APM together creates a full-stack visibility loop:
- Detect user-visible issues: RUM shows when users face slowness or errors.
- Correlate with backend traces: APM reveals which API, query, or server caused it.
- Confirm impact: RUM quantifies how many users and which segments are affected.
- Prioritize fixes: Teams focus on issues with real business impact, not just server anomalies.
This loop bridges the gap between technical performance and business outcomes.

Together, they give both the outside-in view (RUM) and the inside-out view (APM).
Use cases where RUM enhances APM
- Incident response
RUM helps on-call engineers cut through noise. Instead of reacting to every backend threshold breach, teams know which anomalies actually hurt users. For example, if CPU spikes but RUM shows no degradation, the team can safely de-prioritize. - Root cause analysis
RUM pinpoints where in the user journey problems appear. APM then traces it back to the faulty microservice or database query. Together, they shorten mean time to resolution (MTTR). - Release validation
APM ensures backend changes don’t introduce regressions, while RUM confirms the new release actually improves user experience. Both dimensions matter in DevOps CI/CD pipelines. - Third-party monitoring
APM has no visibility into external scripts like ad tags, analytics beacons, or payment gateways. RUM captures their performance impact on real users, giving teams leverage with vendors. - Business impact correlation
By combining conversion funnel metrics with RUM latency and APM backend traces, teams can measure how technical performance affects revenue, drop-offs, or engagement.
Implementation best practices for integration with Applications Manager
To get the best value from combining RUM and APM, you don’t need to put together different tools. ManageEngine Applications Manager already integrates both in a unified console. Here’s how its practices line up:
1. Correlate frontend sessions with backend performance
Applications Manager automatically links browser-side metrics like page load time, resource breakdown, and JavaScript errors with backend service health, database queries, and infrastructure metrics. This makes it easier to trace a user’s journey across layers.
2. Smart sampling and focused visibility
You can configure session sampling to capture critical user journeys — for example, logins, checkouts, or high-value workflows — while aggregating less critical sessions. This keeps overhead low without sacrificing insight.
3. Breakdowns by device, browser, and geography
Instead of normalizing data across multiple disjointed tools, Applications Manager gives you out-of-the-box segmentation by location, operating system, and browser type. That helps identify issues specific to certain user subsets.
4. SPA and modern web support
Applications Manager RUM agents handle navigation events in modern single-page apps, ensuring you don’t lose visibility when pages render dynamically rather than reloading fully.
5. Privacy-aware monitoring
Applications Manager’s RUM setup is designed with privacy in mind. It does not capture sensitive information such as passwords or payload data. Teams can also enhance JavaScript error tracking by adding custom scripts to include contextual breadcrumbs, giving more clarity into client-side issues without compromising user trust.
6. User-focused alerting
You can set thresholds for key frontend performance indicators (for example, sessions where interactive time exceeds three seconds) and tie those alerts to backend performance. This ensures alerts only fire when real users are affected, reducing noise.
Why choose Applications Manager for RUM + APM
With many vendors, you end up deploying one tool for backend monitoring and another for frontend user tracking, then struggling to stitch the data together. Applications Manager removes that complexity.
By combining Real User Monitoring with server, application, database, and infrastructure monitoring in one platform, it:
- Gives teams a single pane of glass across user experience and backend performance.
- Eliminates the “finger-pointing” between frontend and backend teams during incident resolution.
- Helps prioritize fixes by showing both how users are impacted and where the root cause lies.
- Reduces cost and overhead compared to running multiple monitoring tools.
In short, Applications Manager makes RUM and APM work together seamlessly, helping DevOps, SREs, and product teams deliver faster, more reliable applications that truly align with user expectations.

