FAQs about Docker monitoring
What is Docker?
+
Docker is an open-source containerization platform that allows developers to build, deploy, and manage applications inside lightweight, portable containers. It abstracts the OS layer and provides an isolated environment for applications, ensuring consistency across different computing environments.
What is Docker monitoring?
+
Docker monitoring involves tracking the performance, health, and resource usage of containers running within a Docker environment. It ensures containers operate efficiently by observing metrics such as CPU usage, memory consumption, network activity, and storage performance.
Key benefits:
- Performance optimization: Identifies bottlenecks and improves efficiency.
- Resource management: Prevents resource contention and over-utilization.
- Reliability: Maintains uptime and ensures service availability.
- Visibility: Provides insights into container operations for proactive management.
Use case scenario: Imagine an e-commerce platform running multiple microservices in Docker containers. During a holiday sale, the platform experiences a surge in traffic. Without proper monitoring, containers handling critical services like payment processing may face high CPU usage, causing slow transactions or failures. Docker monitoring helps the IT team identify bottlenecks in real-time and scale resources accordingly, ensuring a smooth user experience.
How to monitor Docker?
+
Use built-in Docker commands: Leverage commands like docker stats
for real-time resource usage (CPU, memory, etc.), docker inspect
for deeper container details, and docker logs
to debug container activities.
Utilize monitoring tools: Open source tools like Prometheus and Grafana can visualize and alert on metrics, while advanced Docker monitoring tools like ManageEngine Applications Manager ensures full-stack performance insights.
Set up logging and alerting: Use Fluentd, ELK stack (Elasticsearch, Logstash, Kibana), or Logstash for centralized logging to track and troubleshoot issues. Pair this with alerting systems to stay ahead of problems.
Integrate with Kubernetes monitoring: If you’re orchestrating with Kubernetes, tools like Kubernetes Metrics Server provide cluster-level insights, while Kube-State-Metrics offers state-related data for pods, nodes, and other resources.
Why is Docker monitoring important?
+
Docker monitoring is crucial for several reasons. Here are a few:
- It helps maintain efficient performance, ensuring that Docker containers are utilizing resources optimally.
- It plays a vital role in promptly detecting and addressing any issues that may arise, thereby minimizing downtime and ensuring smooth operation.
- Choosing the right Docker monitoring system from a range of options ensures improved health, performance, and availability.
Additionally, Docker monitoring provides valuable insights into container health and performance trends, allowing for proactive optimization and resource allocation.
What is the role of a Docker monitor?
+
A Docker monitor tracks the performance and health of Docker containers. It draws critical performance metrics like CPU, memory, disk throughput, network traffic etc. to ensure seamless operation of the containers. With real-time insights into container status, logs and events, it helps in identifying performance anomalies that might lead to issues like container crashes or resource starvation. It provides deep visibility into container performance and resource utilization that help admins to understand the behavior of their Docker environment and make well-informed decisions while operating on Docker.
What Docker metrics should I track for performance monitoring?
+
Monitoring the right metrics is crucial for effective Docker container management.
Key metrics include:
- CPU Usage: Measures how much processing power each container is consuming, helping to identify resource contention.
- Memory Usage: Tracks the memory consumption per container to prevent memory leaks and ensure optimal performance.
- Network I/O: Monitors data transfer rates to detect network bottlenecks and ensure smooth communication between containers.
- Disk I/O: Observes read and write operations, which can indicate storage performance issues.
- Container Uptime: Provides insights into container availability and potential restarts or failures.
- Error Rates: Captures application-level errors within containers for proactive issue resolution.
These metrics provide a holistic view of container health and help IT teams manage resources effectively while ensuring minimal service disruption.
How does Docker monitoring differ from traditional server monitoring?
+
Aspect | Traditional Server Monitoring | Docker Monitoring |
Scope | Focuses on entire OS & hardware | Focuses on individual containers |
Resource Isolation | Monitors host system usage | Tracks per-container resource consumption |
Metrics | CPU, memory, disk, network | Container-specific CPU, memory, I/O |
Tools | Nagios, Zabbix, New Relic | Prometheus, cAdvisor, Applications Manager |
Challenges | OS-level issues | Container lifecycle management & dynamic scaling |
How can I monitor Docker containers in real-time?
+
Docker monitoring can be monitored by several methods. Here are a few:
- Using
docker stats
: Shows real-time CPU, memory, network, and disk usage.
- Using Prometheus & Grafana: Collects real-time metrics and visualizes them.
- Using cAdvisor: Provides per-container resource usage in a web UI.
- Using Applications Manager: Monitors container health, performance, and other key metrics with automated alerts and in-depth reports.
Can I use ManageEngine Applications Manager to monitor Docker containers?
+
Yes, ManageEngine Applications Manager supports Docker monitoring. It provides:
- Auto-discovery of Docker containers and hosts.
- Resource usage tracking (CPU, memory, disk, network).
- Container lifecycle monitoring (starting, stopping, restarting).
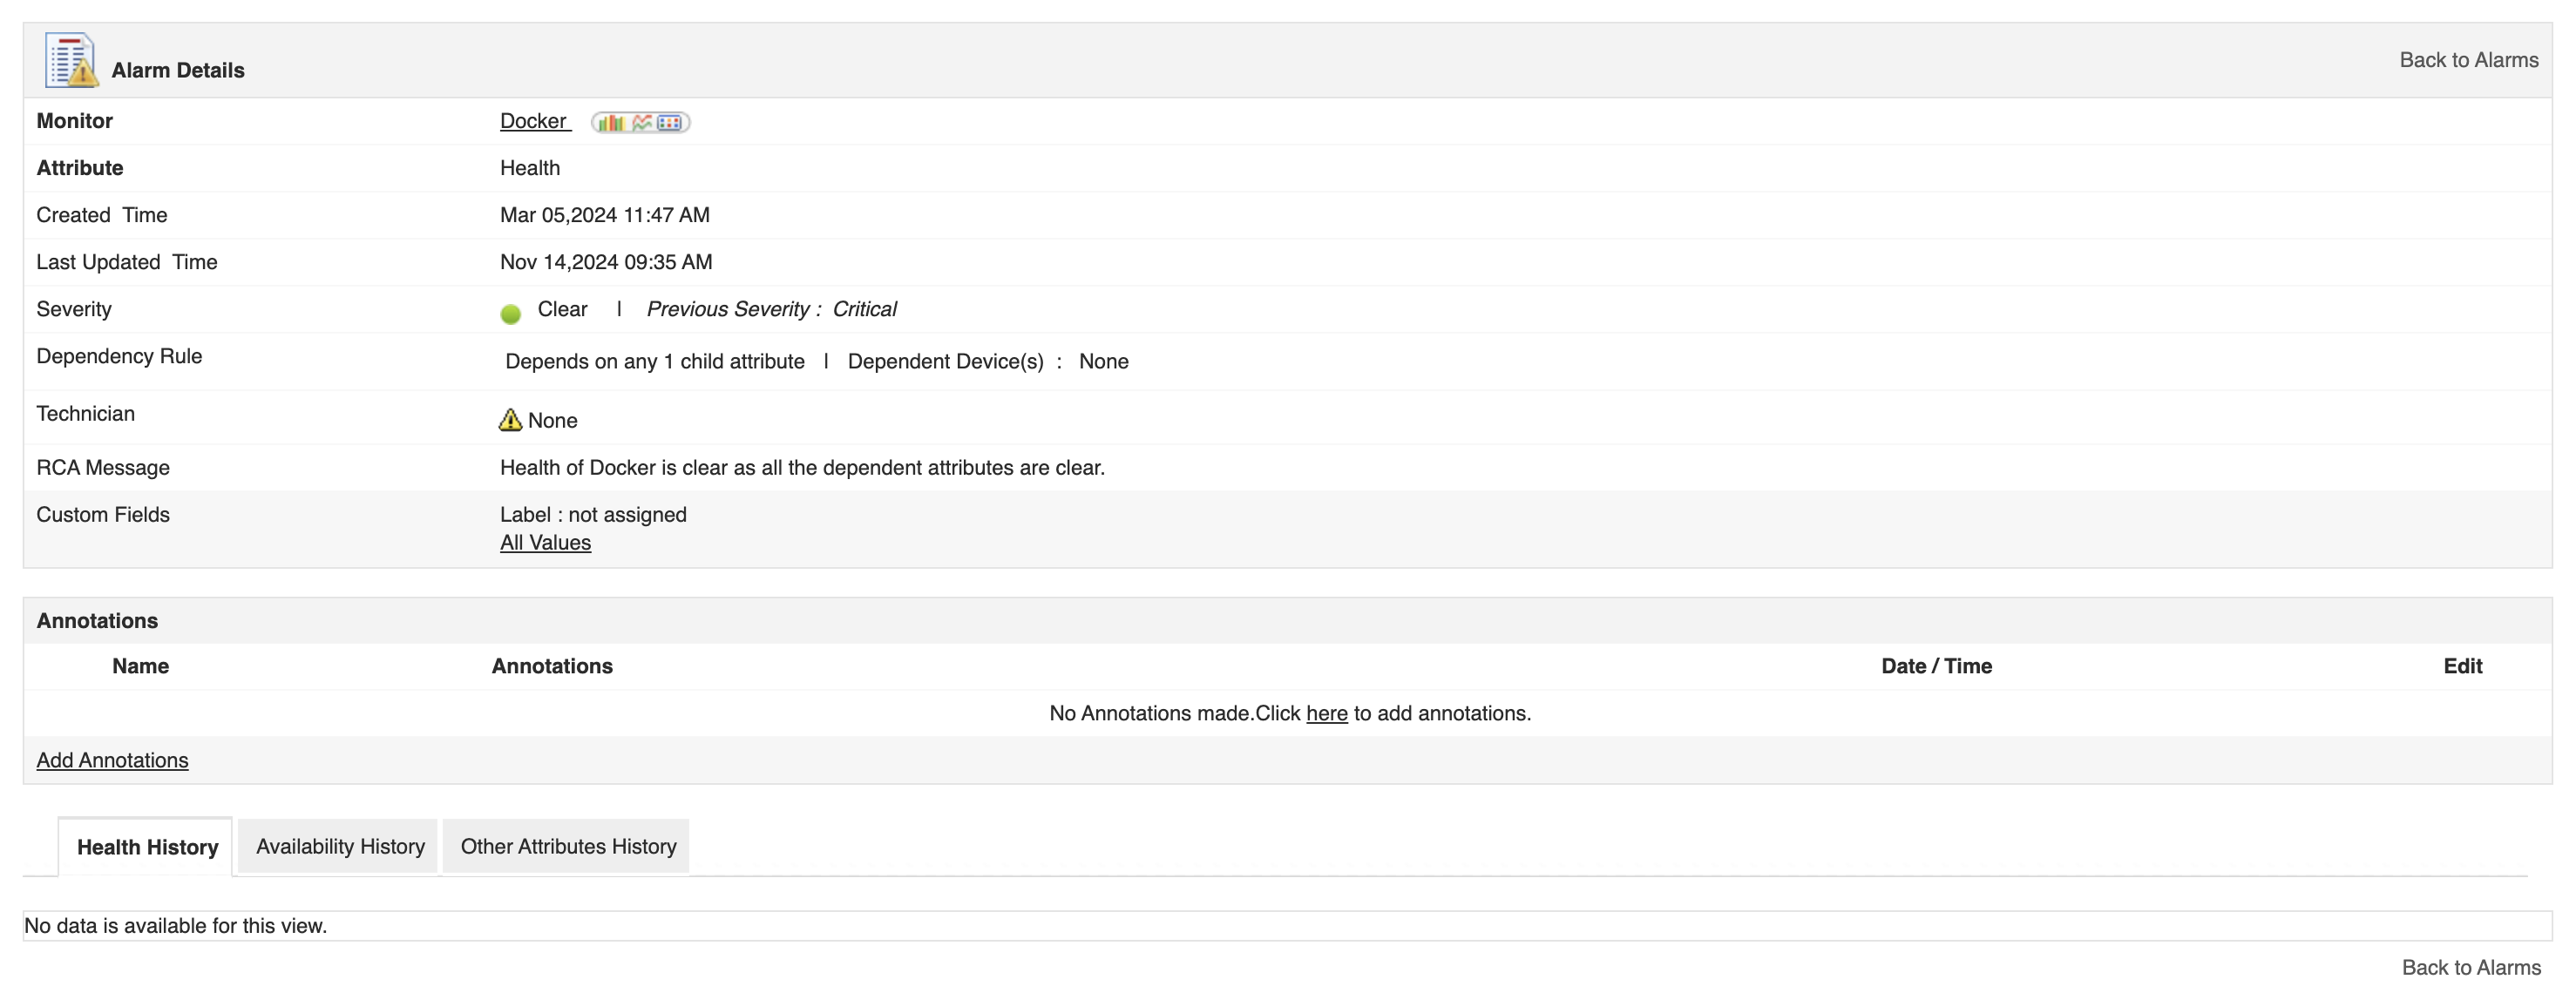
- Alerts and notifications for performance issues.
- Integration with Kubernetes for containerized environments.
How does Applications Manager's Docker monitoring work?
+
Applications Manager provides comprehensive Docker monitoring with real-time visibility into both container performance and host system resource usage.
Key features include:
- Automatic Discovery: Automatically detects and monitors running containers.
- Performance Metrics: Tracks CPU, memory, disk, and network usage.
- Continuous Data Collection: Provides real-time data for proactive analysis.
- Threshold-based Alerts: Notifies when resource usage exceeds predefined limits.
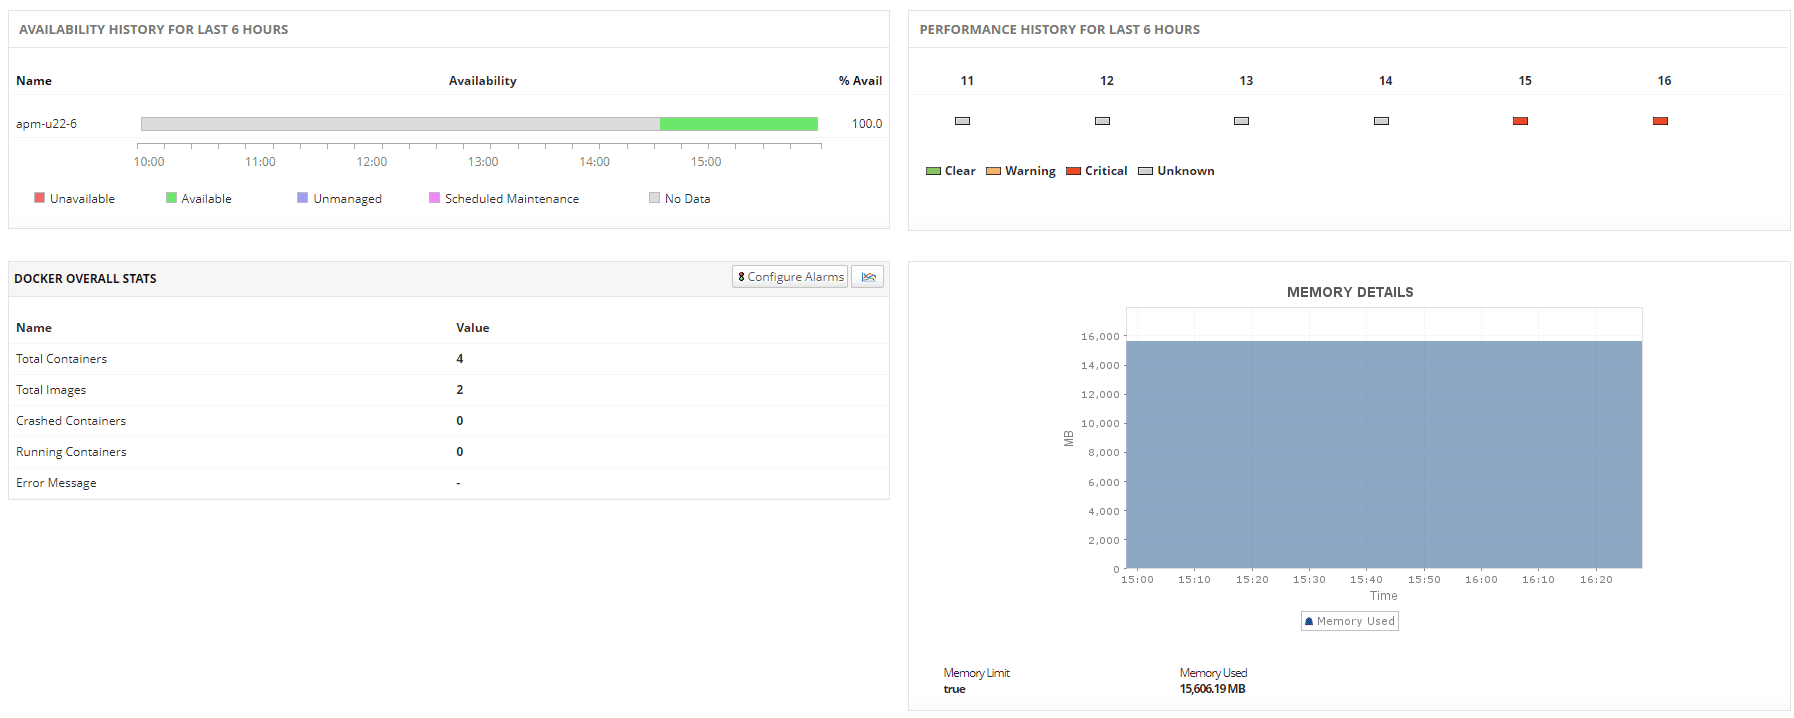
- Insightful Dashboards: Offers detailed visual reports for better decision-making.
These capabilities help IT teams troubleshoot issues, optimize performance, and ensure high availability in production environments.
Can I set up alerts for specific Docker container metrics in Applications Manager?
+
Yes, ManageEngine Applications Manager offers advanced alerting capabilities for Docker container metrics.
Alerting features:
- Threshold-based alerts: Configure alerts for CPU, memory, and network activity.
- Multi-channel notifications: Send alerts via email, SMS, Slack, and ServiceNow.
- Static & dynamic thresholds: Set fixed or adaptive thresholds based on historical data.
- Severity levels: Classify alerts to prioritize critical issues effectively.
These features help IT teams detect anomalies early, prevent downtime, and maintain operational efficiency.
What are the differences between Applications Manager and other Docker monitoring tools?
+
Here are the key differences between Applications Manager and other Docker monitoring tools:
Feature | Applications Manager | Other Tools (Prometheus, cAdvisor, etc.) |
Ease of Use | User-friendly UI, pre-built dashboards | Requires configuration |
Full-stack Monitoring | Monitors applications, servers, and containers | Mostly container-focused |
Auto-discovery | Detects containers automatically | Manual setup required |
Alerting & Reports | Built-in alerts, AI-powered insights | Needs additional setup |
Cloud & On-premise | Supports both environments | Some tools are cloud-native only |
Integration | Works with Kubernetes, cloud, logs, APM | Prometheus requires exporters |
Applications Manager Comparative Overview:
ManageEngine Applications Manager distinguishes itself by providing a comprehensive, user-friendly, and intelligent monitoring solution that simplifies Docker monitoring and enhances overall IT observability.
What are the best practices for monitoring docker containers in 2025?
+
To maintain optimal container performance and reliability in 2025, consider the following Docker monitoring best practices:
- Adopt full-stack monitoring: Monitor both container and host system metrics for a comprehensive view of the environment.
- Implement automated alerting: Use dynamic thresholds and automated alerts to detect anomalies early.
- Leverage centralized dashboards: Use unified dashboards to correlate metrics across containers, hosts, and applications.
- Focus on key metrics: Prioritize essential metrics like CPU, memory, and network I/O to avoid data overload.
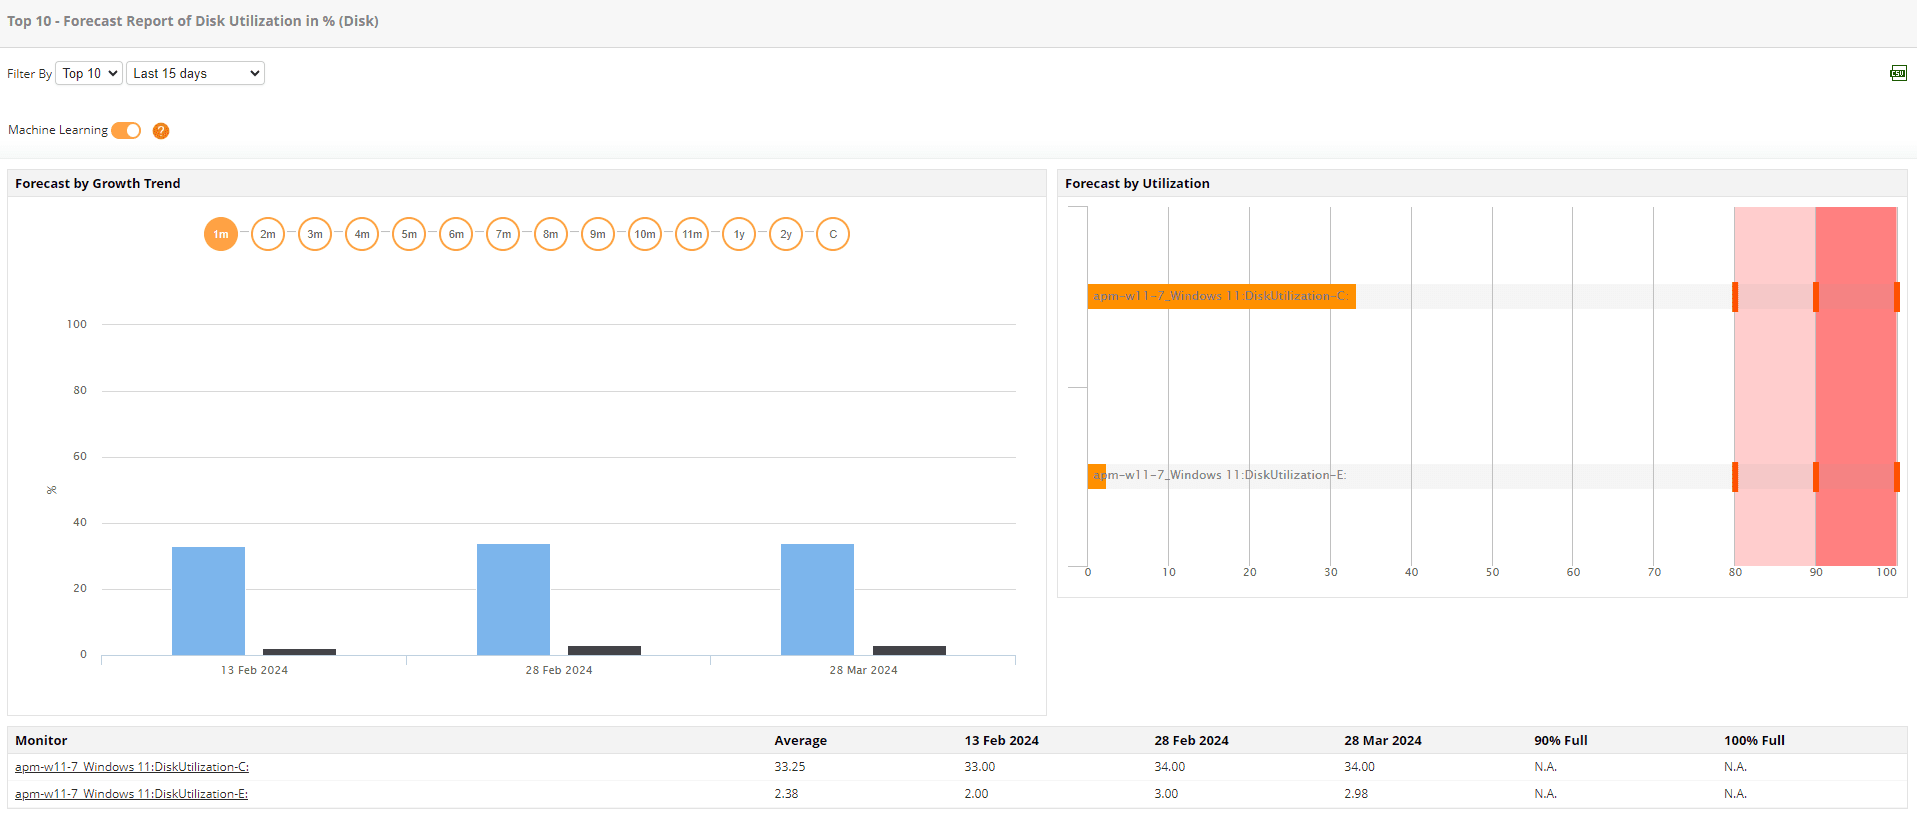
- Optimize resource allocation: Use historical data to right-size resources and avoid over-provisioning.
- Ensure security monitoring: Monitor for unauthorized access and compliance breaches within container environments.
- Regularly update monitoring tools: Keep monitoring solutions up-to-date to leverage the latest features and integrations.
By following these best practices, organizations can ensure consistent performance, minimize downtime, and maximize the efficiency of their containerized environments.