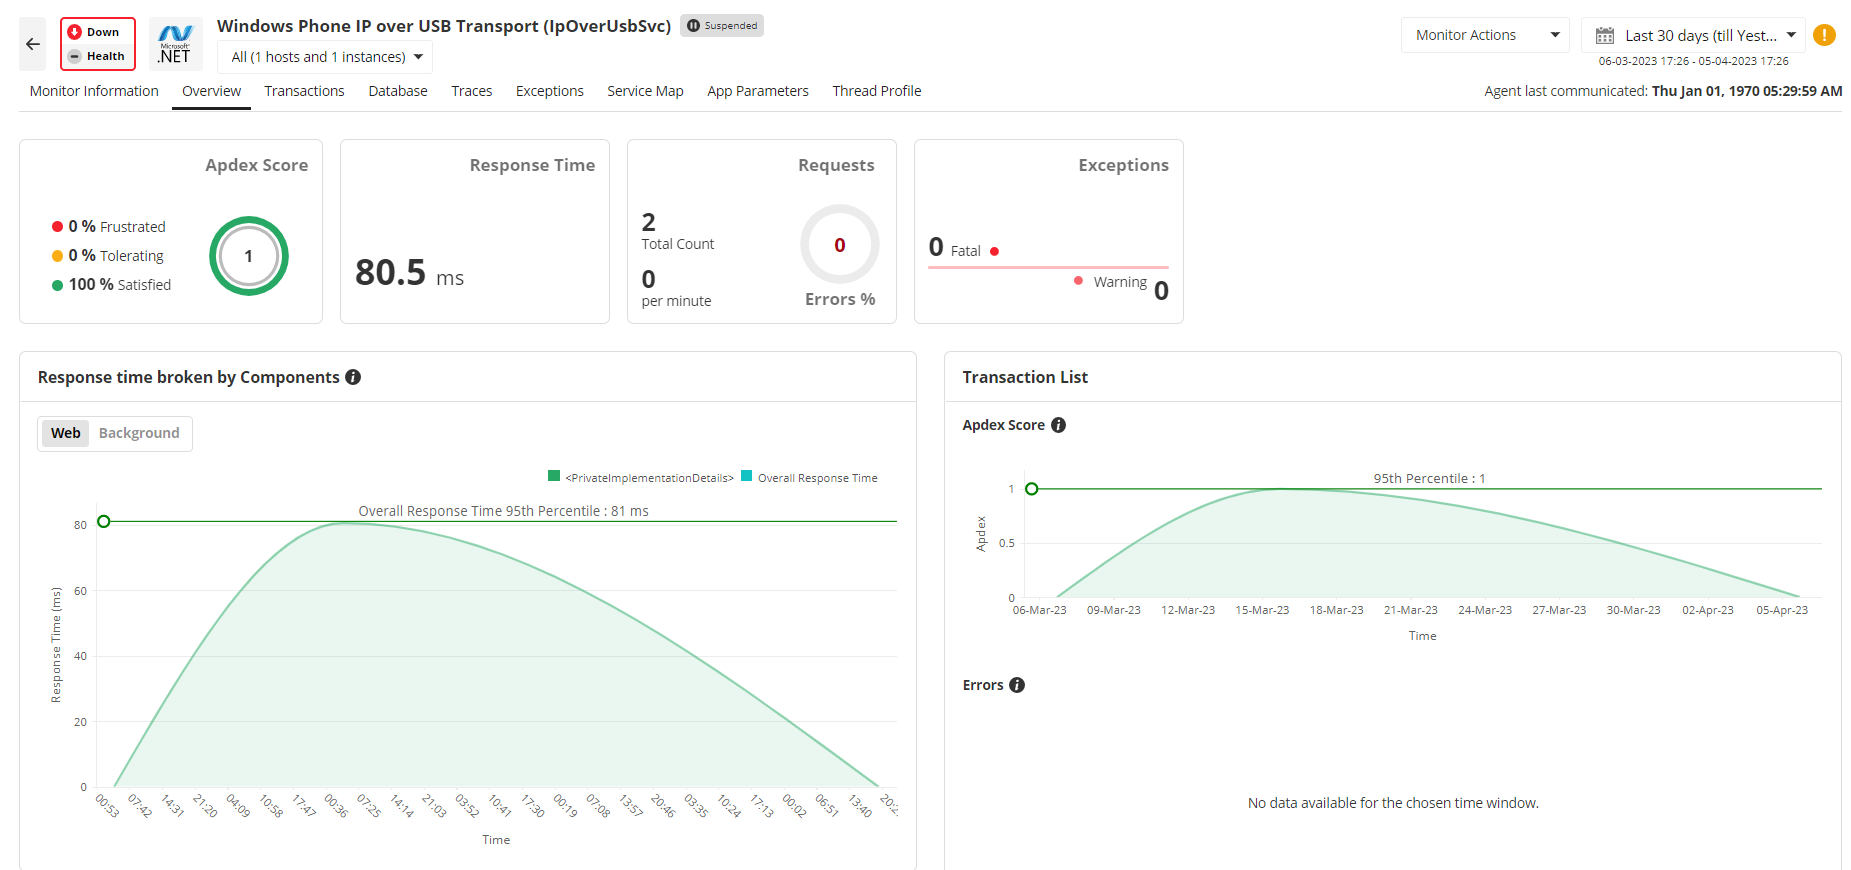
With Applications Manager's .NET application performance monitoring, track the performance of complex .NET web transactions from the end user to the database level. Get deep visibility into .NET application performance and troubleshoot issues quickly before your end users are affected. Employing the services of a .NET monitoring tool like Applications Manager helps you gain visibility into your .NET application through proactive tracking of critical application metrics to understand the level at which they are operating. The application monitoring solution has a dedicated APM Insight dashboard where you can keep track of your .NET applications for performance analysis and optimization.
With Applications Manager's .NET application monitoring you can:
With end-to-end visibility into all tiers of your .NET web transactions, you get insight into key performance metrics starting from CLR performance to URLs to SQL queries. Applications Manager's .NET performance monitoring gives you round-the-clock proactive monitoring that detects performance issues of .NET transactions, enabling your application teams to resolve problems before end-users are impacted.
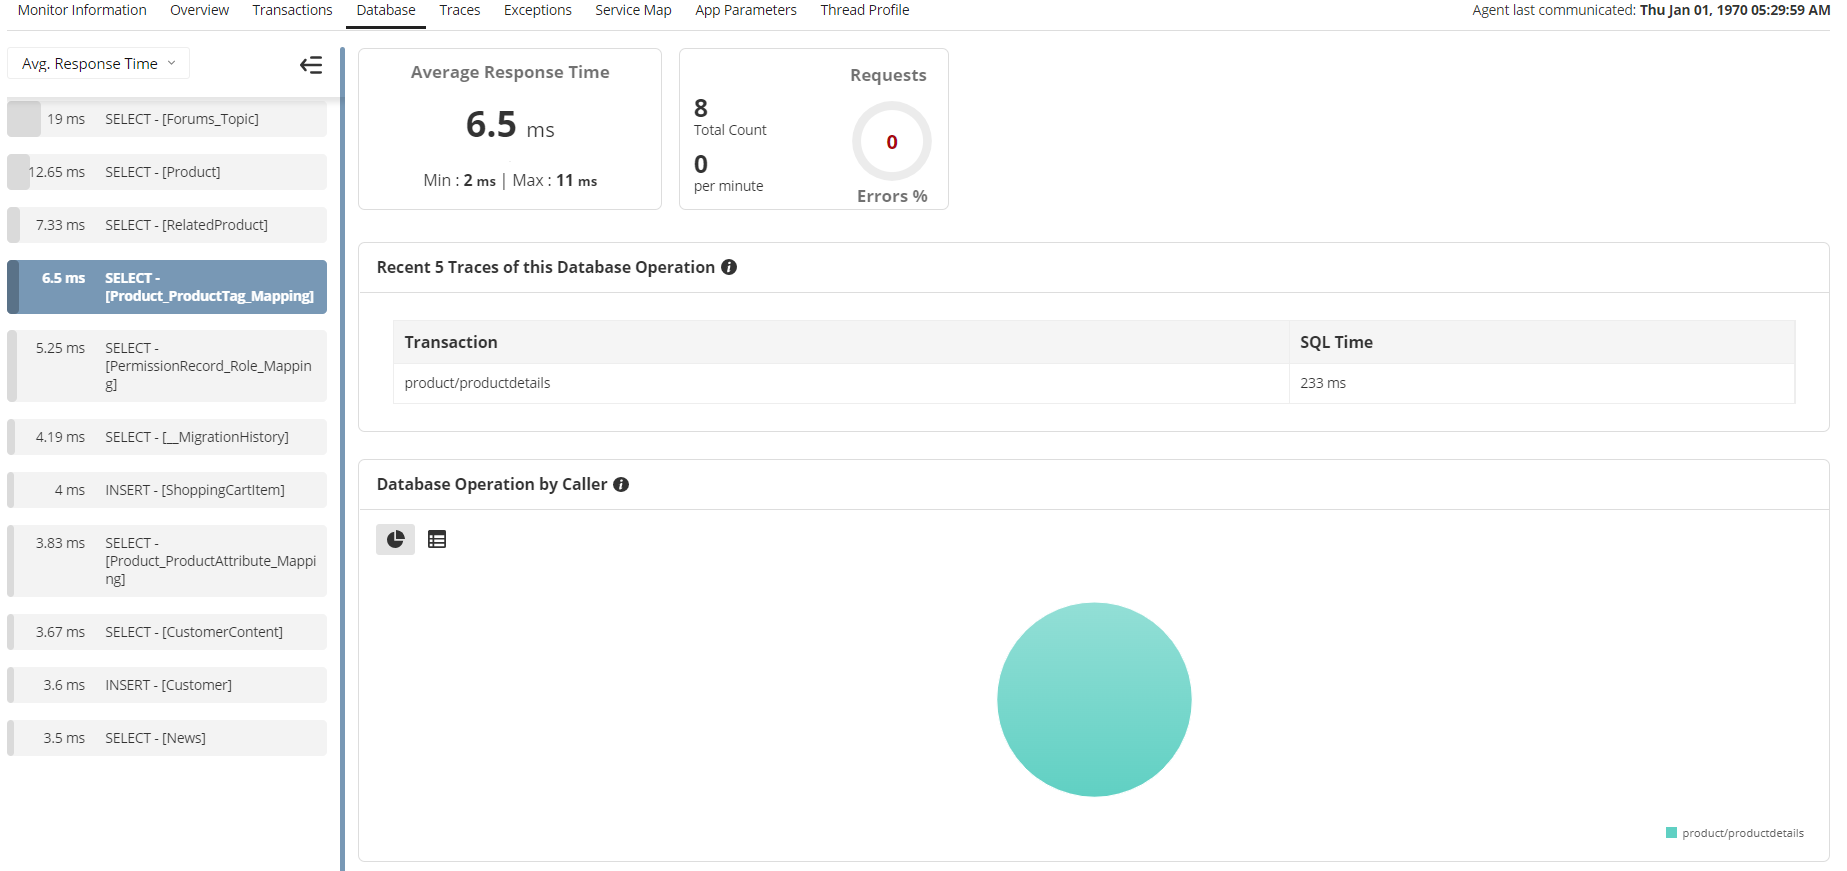
Maintaining complete visibility into the performance of business-critical databases can be a real challenge - especially when faced with a performance slowdown. Keep ahead of database issues with APM Insight. Monitor .NET applications to identify the slow database calls, database usage and overall performance of the database with detailed graphical and tabular representations of core performance metrics.
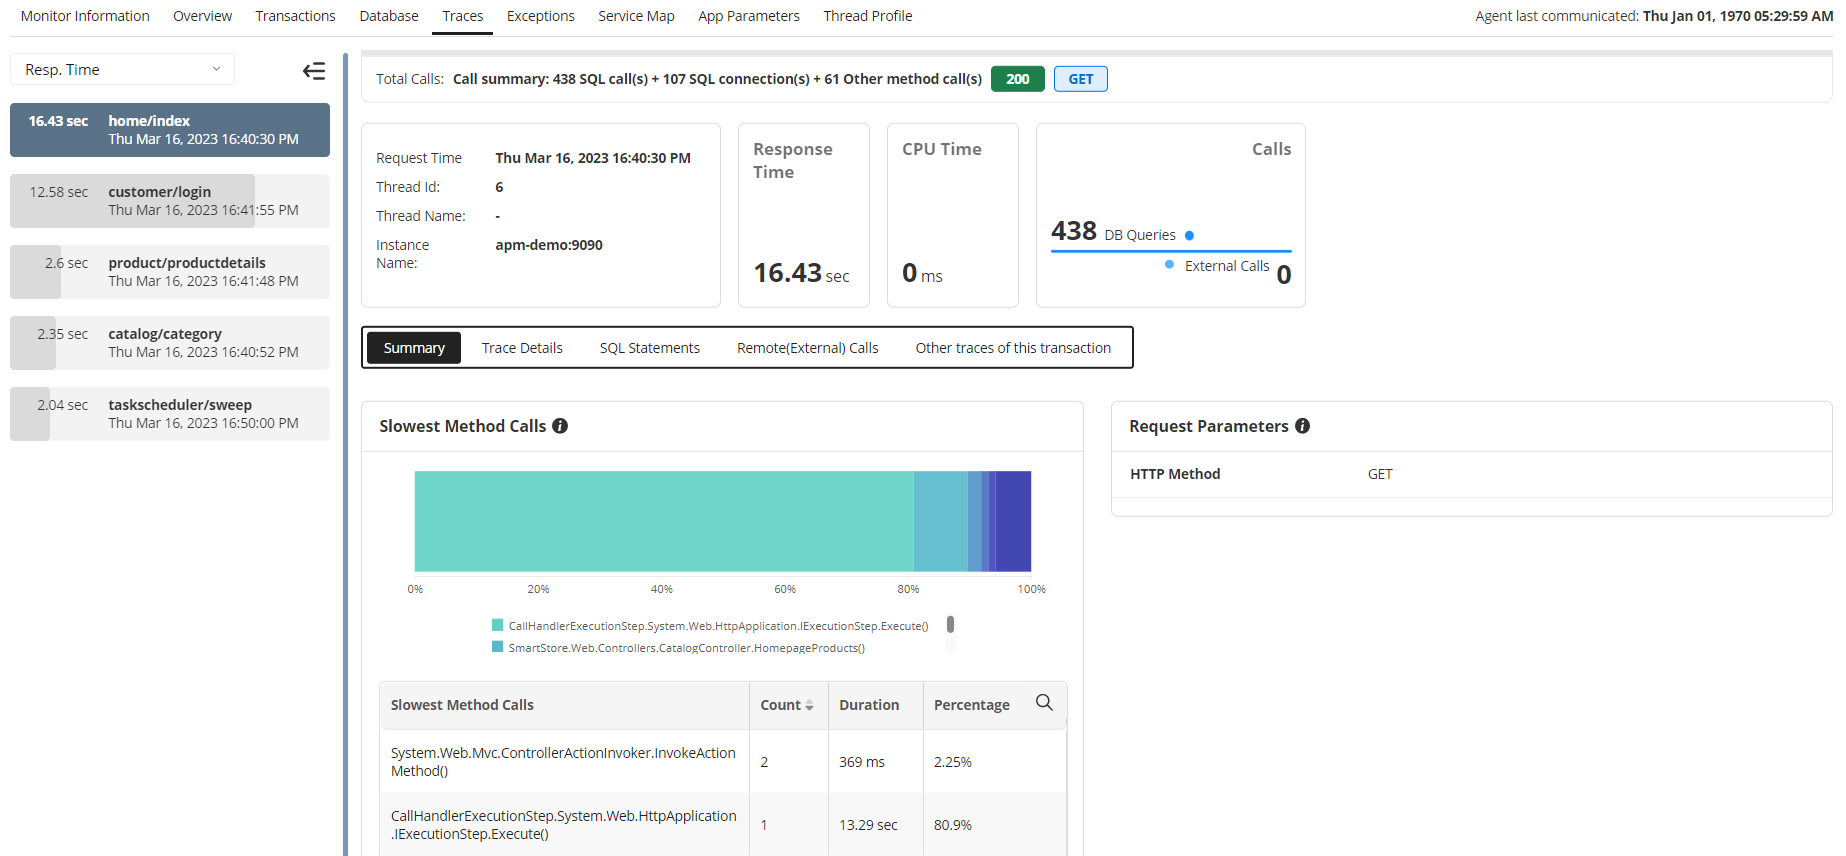
APM Insight lets you trace the execution details for URLs. The trace will chart the sequence of internal invocations (methods) of the URL. By monitoring .NET applications, you can now dig down into transactions to view exceptions stack traces and SQL queries for slow or failed requests.
If your application is running in a microservices environment, you can make use of our distributed tracing capabilities to track calls made from one service to another across various platforms and languages. In the event of an error, .NET application monitoring tools like Applications Manager helps you quickly understand which service is impacted allowing you to collaborate with the respective team to fix it.
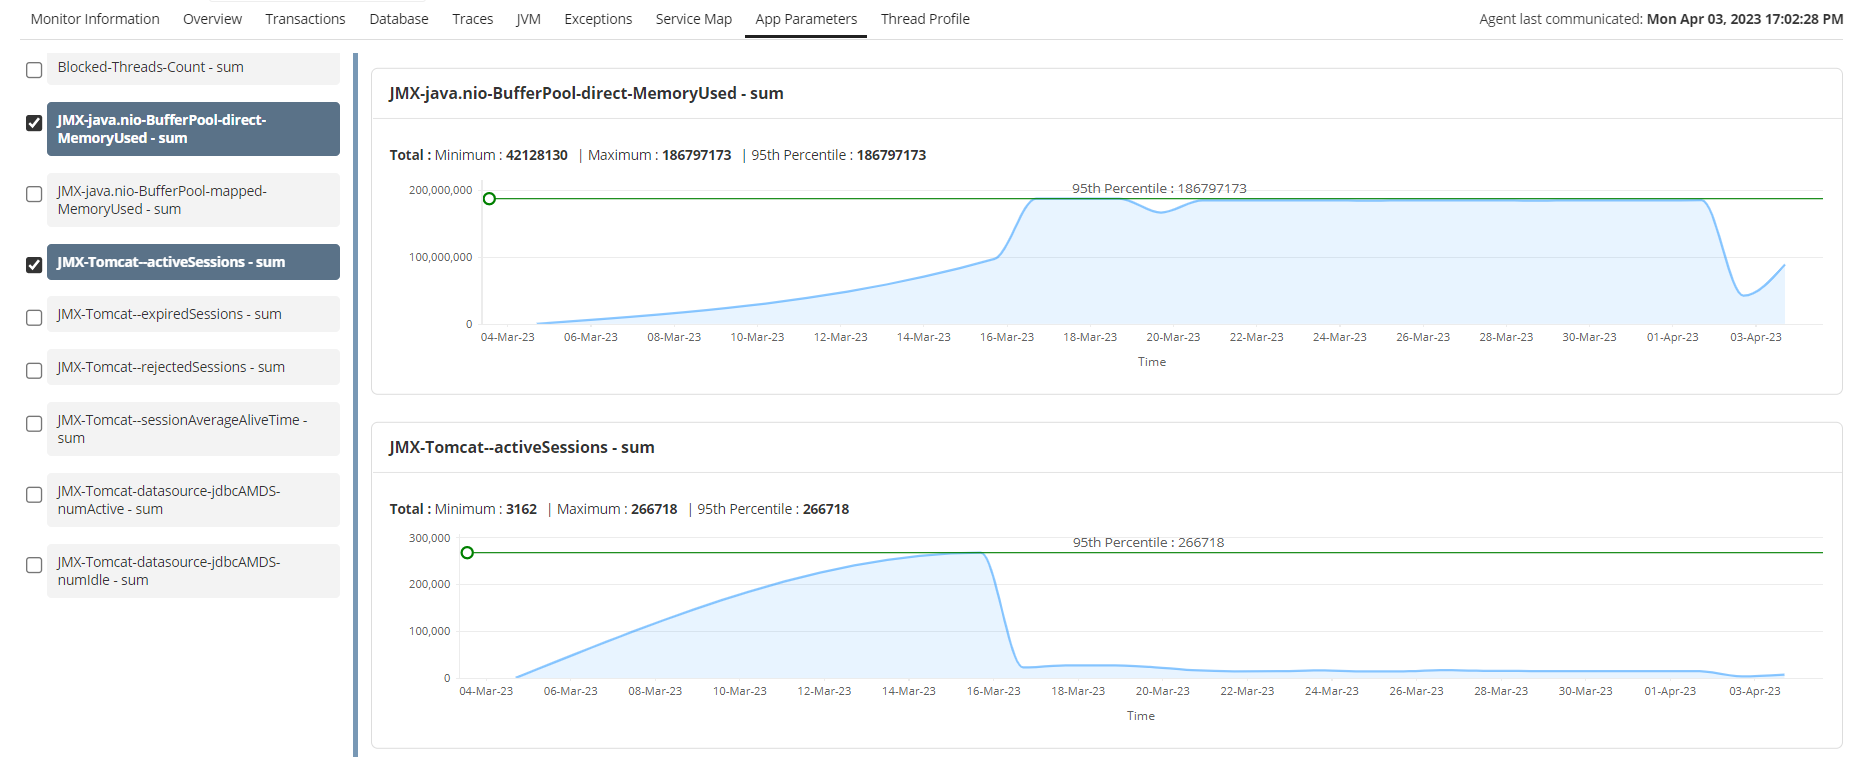
APM Insight's .NET application performance monitoring tool allows you to configure custom app parameters for your application which can be tracked during runtime. This helps you to determine the hit frequency of specific code blocks, helping you identify parts of your application code that might need optimization.
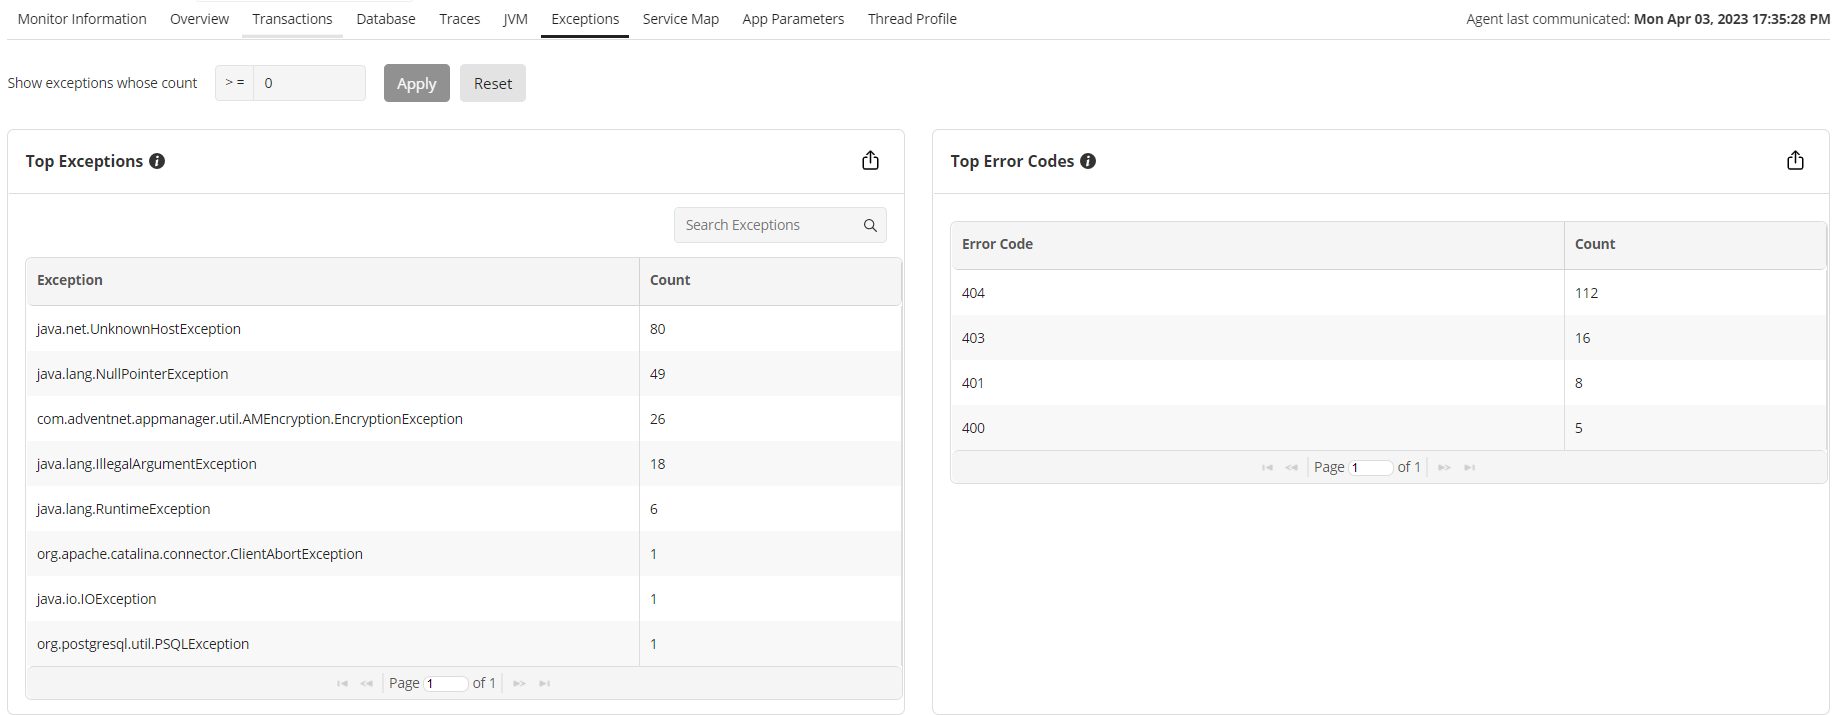
Identifying and monitoring the exceptions that occur in your application can give you visibility into application problems. With APM Insight's application performance monitoring, you can track and trace an issue within your .NET enviornment to identify the root cause, helping you to resolve it before it affects the end users. APM Insight's Dot Net monitoring agent collects information about exceptions in various dimensions. Some of the information that can be viewed under the Exception Tab in APM Insight are Top Exceptions, Error Codes, Count, etc.
Applications Manager extends visibility into your .NET Core environment by integrating with the Dot Net Core monitoring feature. This unlocks the potential to peer into your .NET infrastructure and how your application dependencies interact with each other.
Want to get a more hands-on experience into our .NET application monitoring tool? Download 30-day FREE trial now!
It allows us to track crucial metrics such as response times, resource utilization, error rates, and transaction performance. The real-time monitoring alerts promptly notify us of any issues or anomalies, enabling us to take immediate action.
Reviewer Role: Research and Development
Trusted by over 6000+ businesses globally