Performance issues solved by SQL monitoring
Monitoring SQL databases plays a crucial role in identifying and addressing performance issues regardless of whether your SQL database are hosted on premises, in the cloud, or both. Here are some common performance issues that can be detected through Applications Manager's SQL database monitoring capabilities:
Optimize slow queries with robust MSSQL monitoring
The SQL Server query rate determines how fast the associated application can make itself available to end users. Whenever there is a delay in querying, it directly affects the performance of the application processes. Slow queries can be due to several factors:
- Improper indexing
- Insufficient statement
- Bad query plan
- Long queue and wait time
- Inefficient caching
- Undesired resource usage
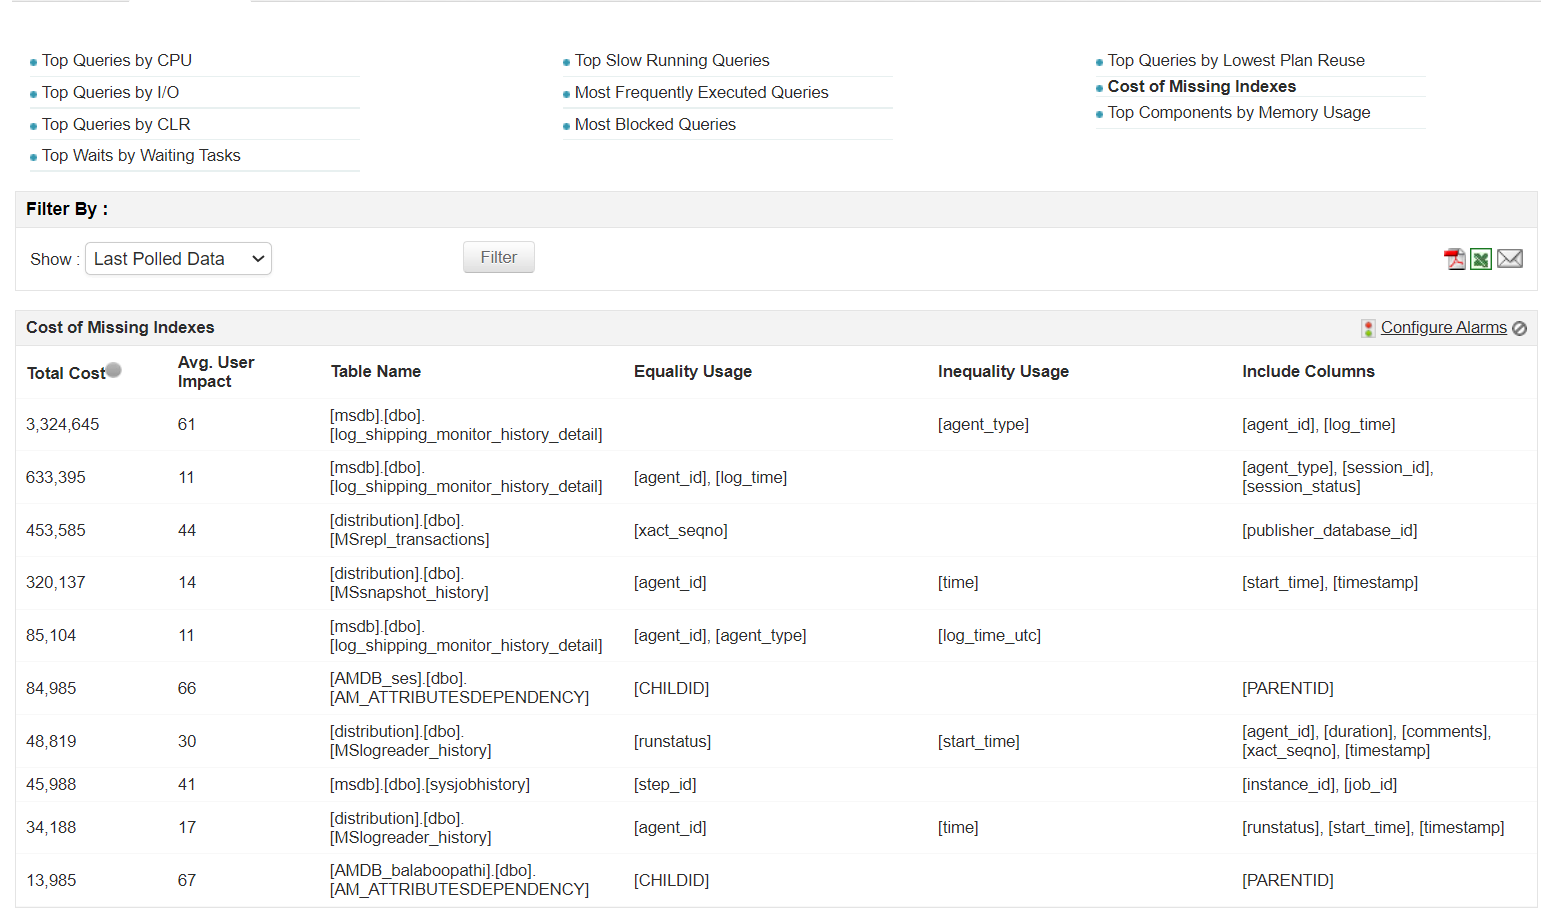
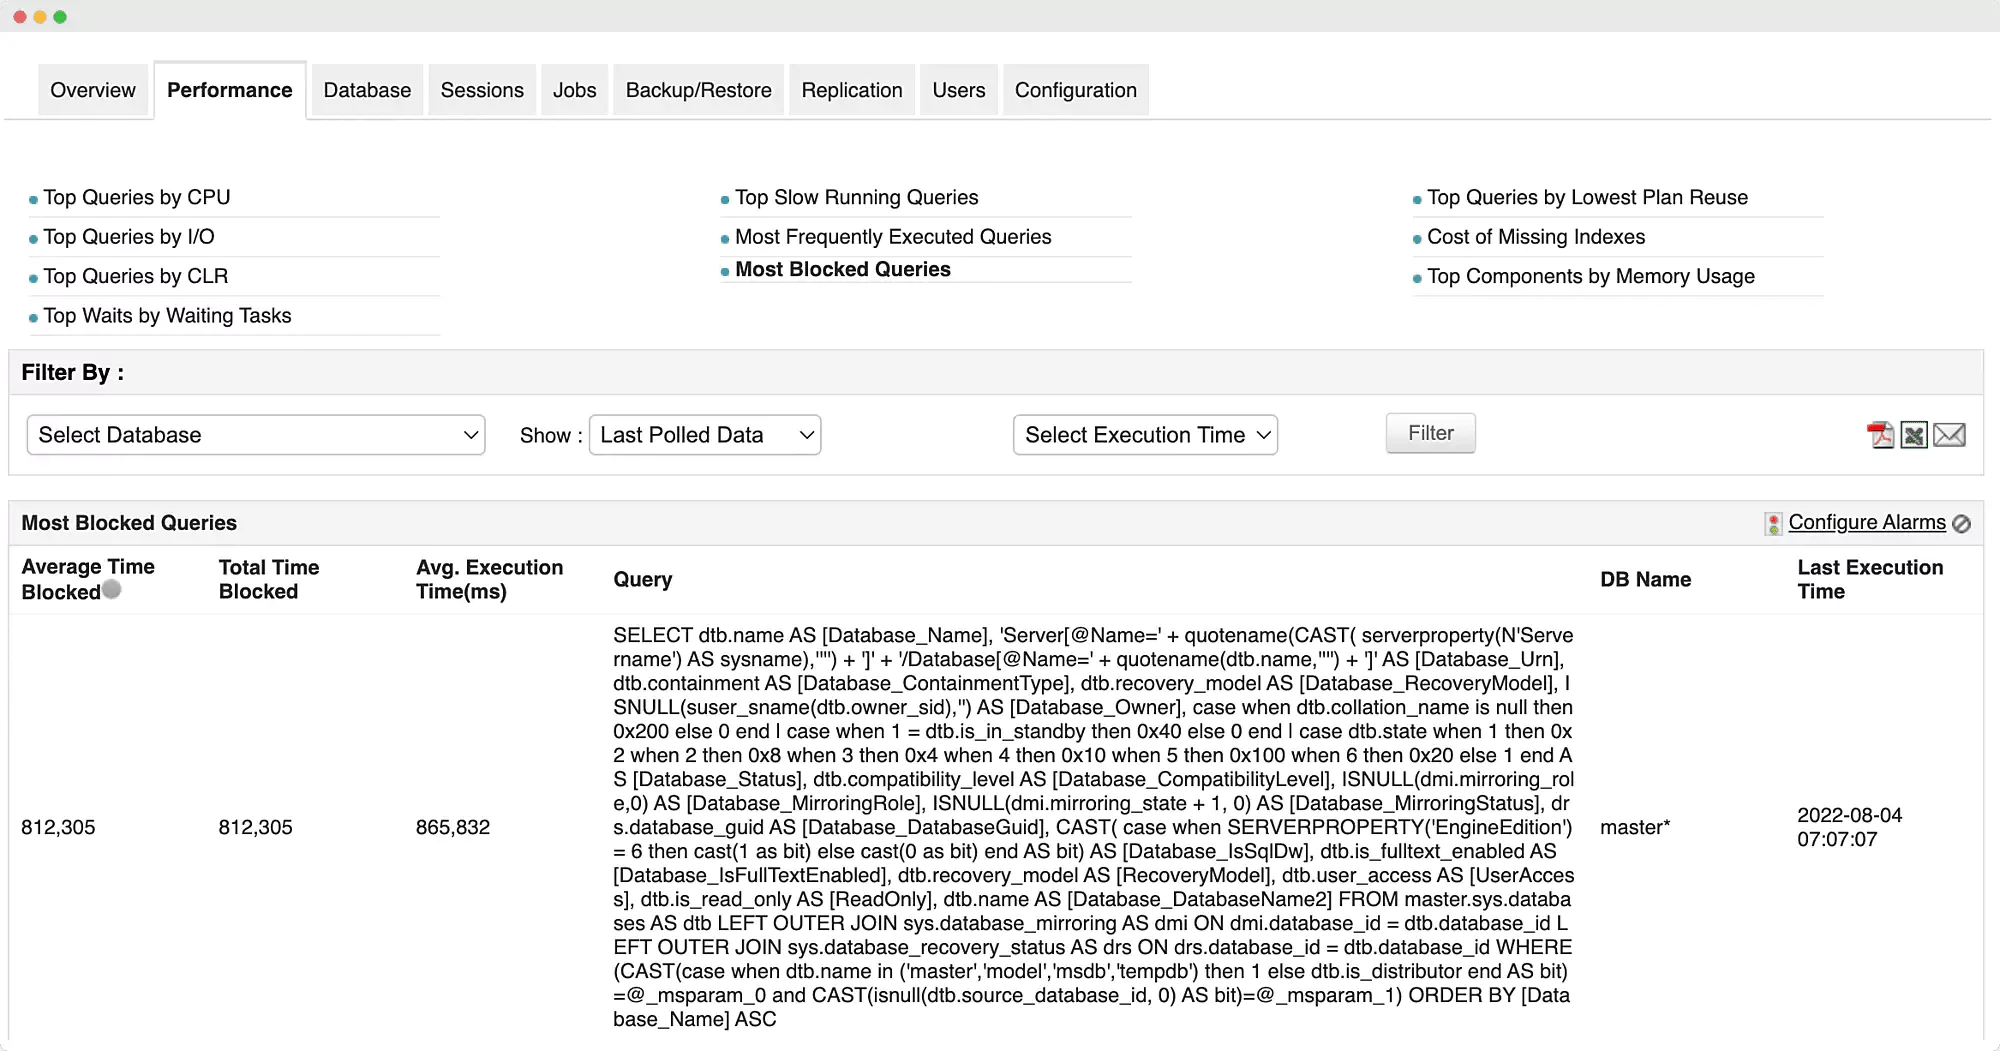
With Applications Manager's MSSQL performance monitoring capabilities you can monitor MSSQL database and optimize SQL queries to function at their maximum efficiency. With detailed reports on performance indicators, like blocked queries, most frequently executed queries, and slow queries, you can identify and resolve anomalies efficiently. Effective MSSQL monitoring ensures that hidden database bottlenecks are exposed immediately. Monitoring MSSQL metrics, like CPU utilization, wait time, query plan usage, and memory usage statistics, from a single screen helps you correlate performance interdependencies and quickly locate the root cause of poor query performance.

In addition, our SQL monitoring tool also provides a user impact score to help you understand a missing index's impact on server performance and pinpoint opportunities for improvement.
Prevent delayed response times using key SQL performance metrics
SQL Server is one of the most widely used relational database management systems due its multi-functionality and the plethora of features it incorporates to support software applications. However, this poses a challenge when it comes to identifying what's causing performance degradation, as there can be many potential contributing factors. Some factors that lead to poor SQL database performance are:
- Low cache hit ratio
- High wait time
- Low job execution frequency
- Inefficient buffer manager
- High lock request rate
- Inefficient scan and access method
- High log flush wait time
- Poor SQL configurations
With Applications Manager's real-time SQL server monitoring features, you can track each KPI, like jobs, sessions, backups, replications, locks, and latches, and receive instant alerts in case of a threshold breach or anomaly. The graphical and tabulated analyses of the performance of key components help you identify and resolve slow algorithms and processes. With our Microsoft SQL monitoring capabilities, you can monitor scan methods and keep an eye on the cache system, ensuring a hit rate of at least 90% for high performance. You'll be informed on the performance of the memory and disk statistics to make sure your SQL Server environment is well maintained to avoid any performance downtime.
In addition to weeding out the components responsible for delayed response time, our SQL monitoring software has a panel that enables you to manually configure each resource to get the best performance output.
Track memory consumption and prevent SQL Server overloads
Constant data growth within SQL Server poses a huge threat, often resulting in memory overload and preventing new data from being written onto the disk. Monitoring SQL database-specific metrics, like cache, replication, query, buffer, and backup, can help you understand the server's memory allocation and consumption for each cluster that is deployed and active. Applications Manager's ML-based adaptive thresholds keep up with the dynamic resource consumption trends, offering alerts at three severity levels to ensure timely fixes. This smart alerting system enables you to automate responsive actions for threshold breaches, reducing alert noise.
Resolve MSSQL Server connectivity issues
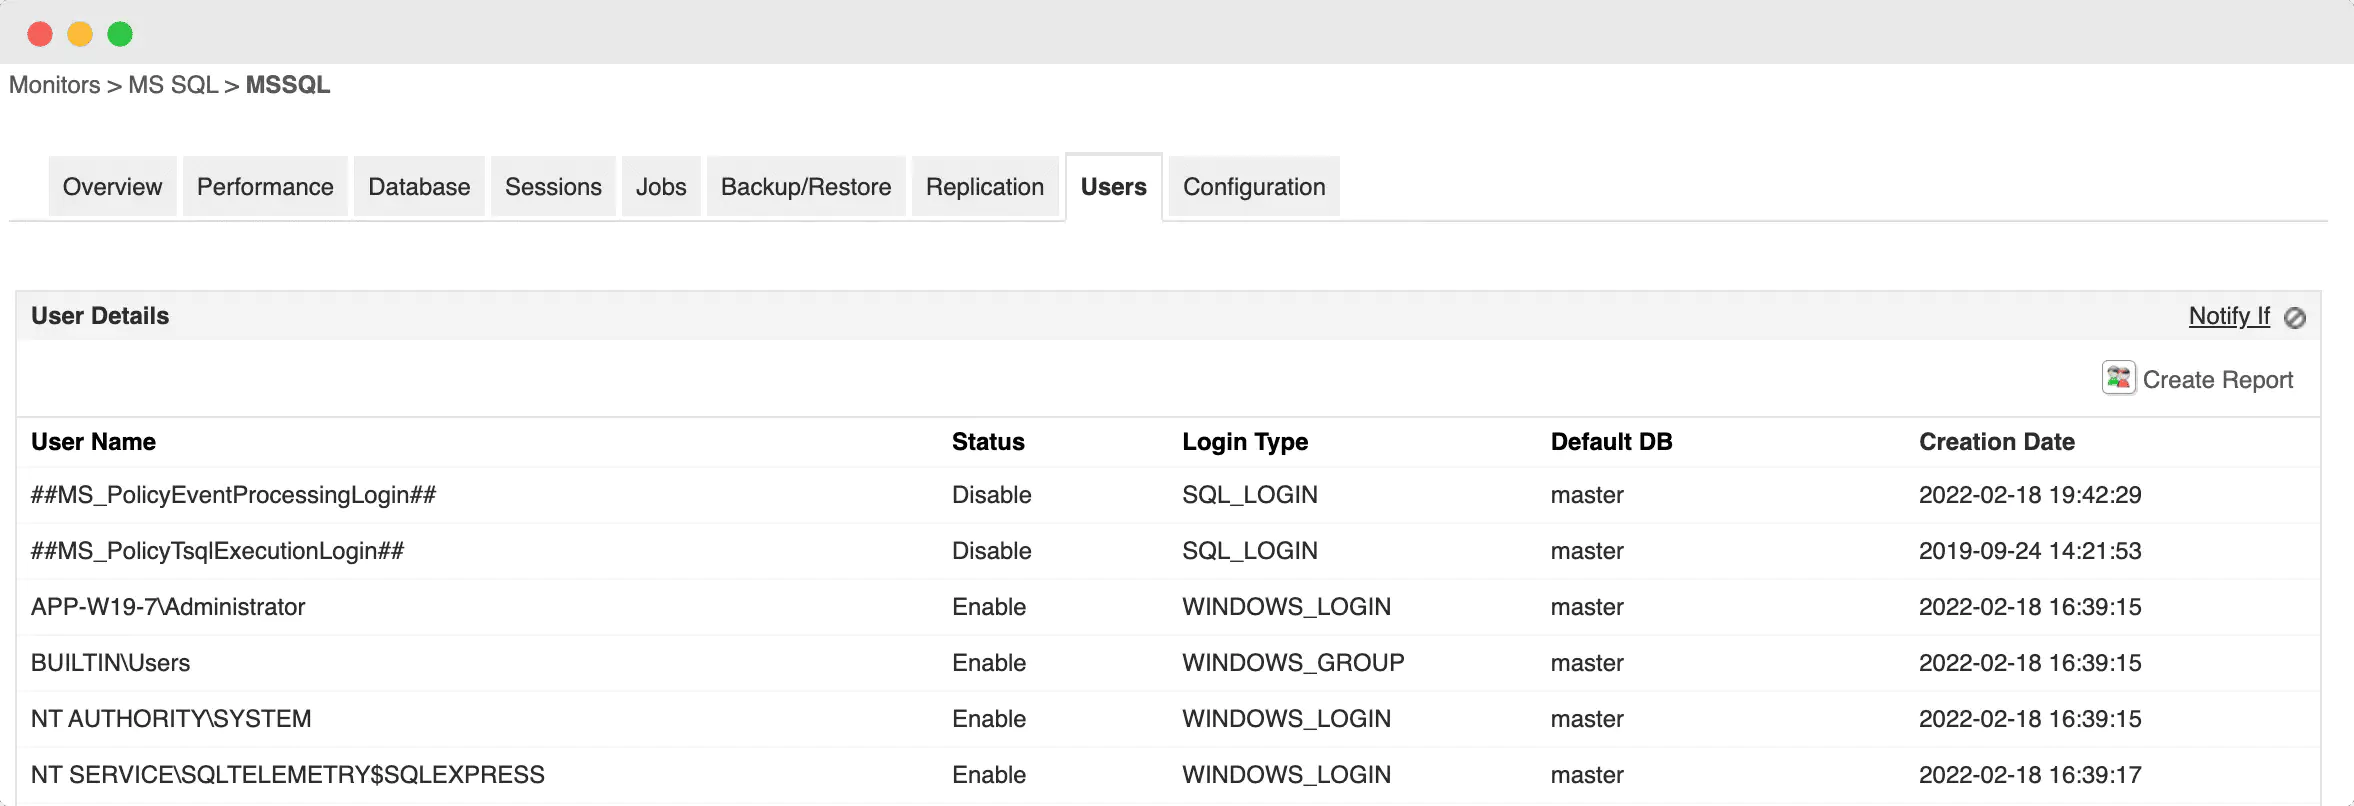
MSSQL users often face connectivity issues during logins. In most cases, this is due to an access restriction from an already existing connection. This can cause an overload of active sessions connected to the database, preventing new logins from accessing the specific SQL Server.
Applications Manager's SQL performance monitoring tool provides an outstanding activity monitoring interface that can track every single login and its status. The SQL activity monitor also offers a clear view of SQL monitoring metrics, like cluster health, nodes deployed, sessions, jobs, replicas, files, availability groups, and backups.
Proactively monitor your SQL servers
- Track critical KPIs like SQL queries, indexes, locks, jobs, and more with ease.
- Identify problems and automate responsive actions.
- Leverage forecast reports to anticipate & manage dynamic consumption trends.
Manage SQL Server deadlocks and blocking scenarios proactively
In MSSQL Servers, deadlocks are events that take place whenever multiple transactions are queued up at the same time to prevent a conflict in data being written. Blocks occur when a single lock is requested by more than one active session to avoid concurrent usage of a resource. These are the events that make the SQL databases failsafe. But when numerous transactions and locks are frequently blocked, the wait time can slow MSSQL performance.

Applications Manager's MSSQL monitoring offers elaborate insights about deadlock rate, block time, and queries that are being declined of locks or other resources, and average execution time for each SQL database. The SQL performance monitor helps you understand the execution anomalies and fix them before the overall performance of the SQL Server is affected.
Ensure high SQL Server availability across deployments
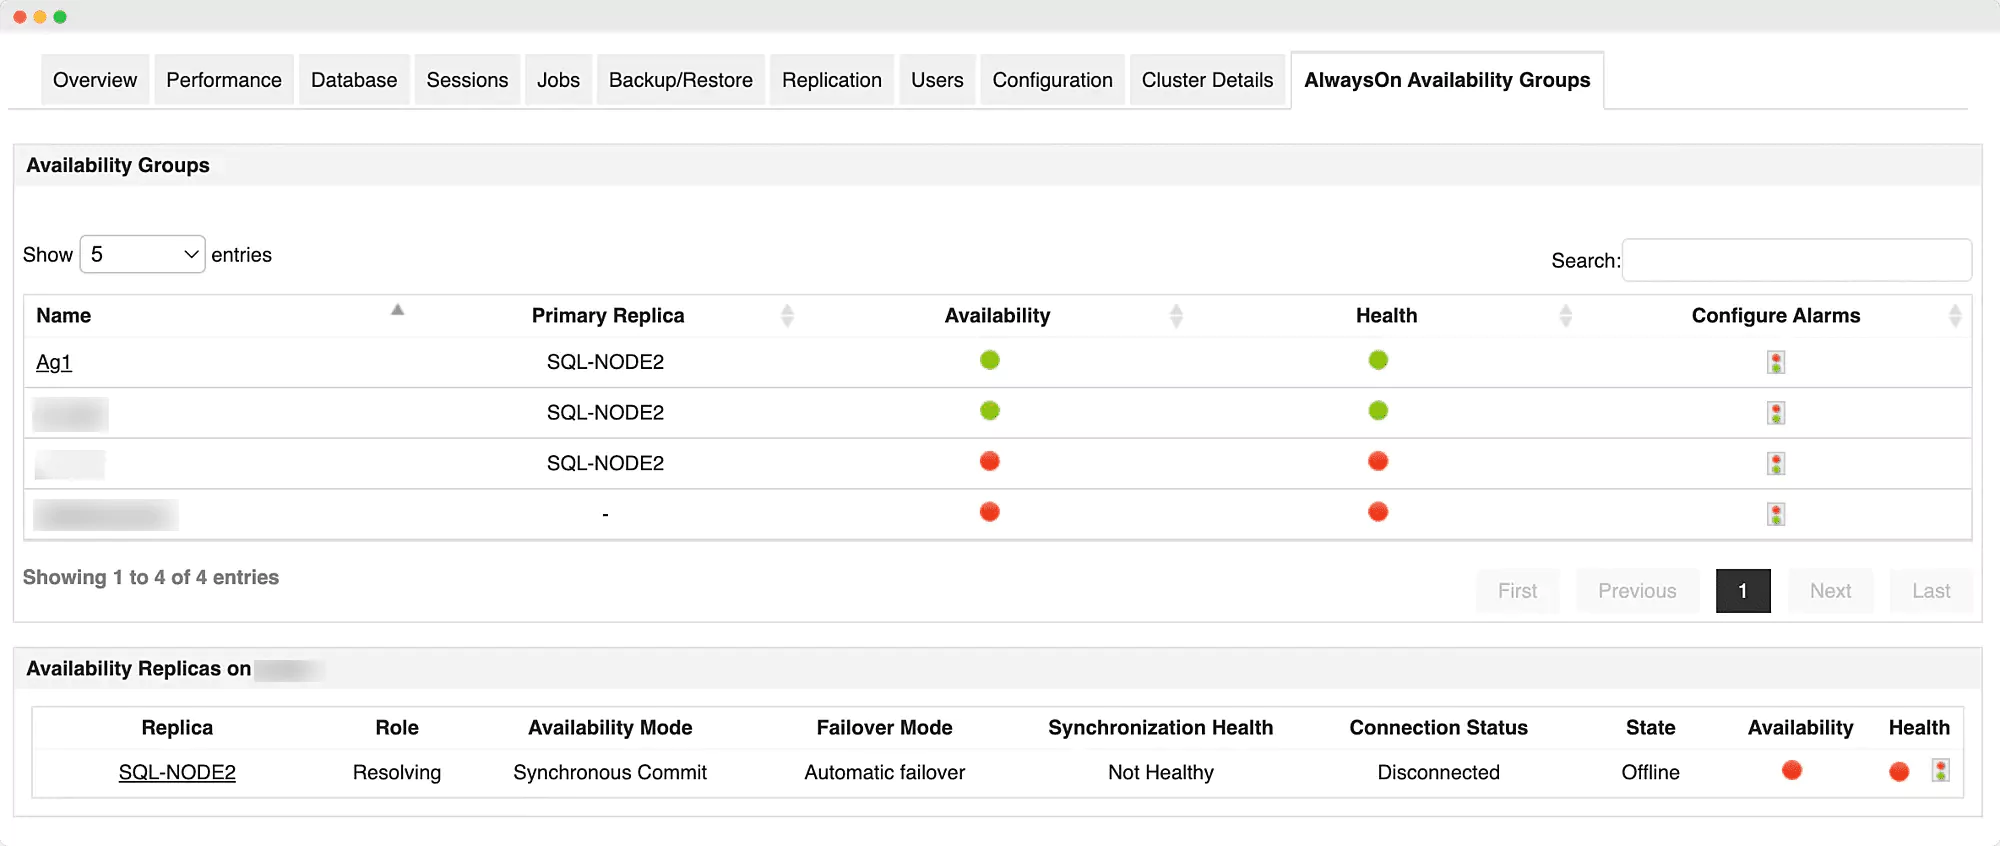
In a disparate architecture like that of an SQL database, a simple glitch could take the whole server down. To avoid such failures and improve availability, secondary backups or replica databases take over. Additionally, the AlwaysOn Availability Group function in SQL Server helps you increase the overall availability of the database network. Such vast infrastructure and secondary backups and replicas, along with the humongous data storage systems, can make it difficult for you to keep up with database performance trends and anomalies in the MSSQL ecosystem.

To provide visibility into the entire database cluster, SQL database monitoring tools like Applications Manager have dedicated panels for each memory subset. Applications Manager's MSSQL monitoring keeps track of the backup's expiry information, as well as stores and retrieves locations, since discrepancies could lead to backup data failure. Similarly, it also checks the synchronization mode of replicas, their data delivery speed, and readiness in case of a failover. Monitoring your SQL Server environment using tools like Applications Manager makes it possible to keep a close watch on log shipping for ensuring prompt replication of data into the standby server without triggering error warnings.
Benefits of monitoring SQL server with Applications Manager
- Identify problematic queries: Detect slow-running or inefficient queries that impact MSSQL database performance, and get insights into execution plans, wait times, and resource consumption to optimize query performance.
- Forecast data growth: Analyze historical trends and storage utilization patterns to predict future database growth, helping you plan capacity effectively and avoid sudden storage shortages.
- Manage the status of databases from a single console: Gain a unified view of all your SQL Server instances, monitor uptime and availability, and quickly identify performance bottlenecks from a centralized dashboard.
- Configure SQL server resources: Adjust CPU, memory, and storage allocations to optimize database performance, ensuring efficient resource utilization and preventing over- or under-provisioning.
- Enable/disable users remotely: Securely manage database user access from anywhere, allowing administrators to grant or revoke permissions as needed to enhance security and control.
- Monitor disaster recovery solutions: Track the health and synchronization status of SQL Server backup and replication setups to ensure data integrity and business continuity in case of failures.


