Podman (short for pod manager) is an open-source container management solution developed by Red Hat that allows you to build, run, and manage containers, images, volumes and pods on a system without needing a background service. Known for its daemonless architecture, it allows containers to run without requiring administrator (root) access to manage container lifecycles, making applications more secure, resilient, and predictable, especially in production and enterprise environments.
Applications Manager's support for Podman monitoring bridges the observability gap by automatically collecting, correlating, and visualizing Podman metrics instantly without compromising Podman’s security model. It helps to manage rootless containers safely by finding out who is using what and enables you catch problems early, avoid downtime, and keep applications running smoothly without surprises.
Applications Manager: The robust Podman monitoring solution you need
Applications Manager enables you to track the performance of your Podman instances by obtaining detailed insights into the following components:
- Podman performance monitoring
- Deep container insights
- Pod status summary
- Image storage tracking
- Container application monitoring
- Kubernetes performance analysis
Track the performance of your Podman infrastructure
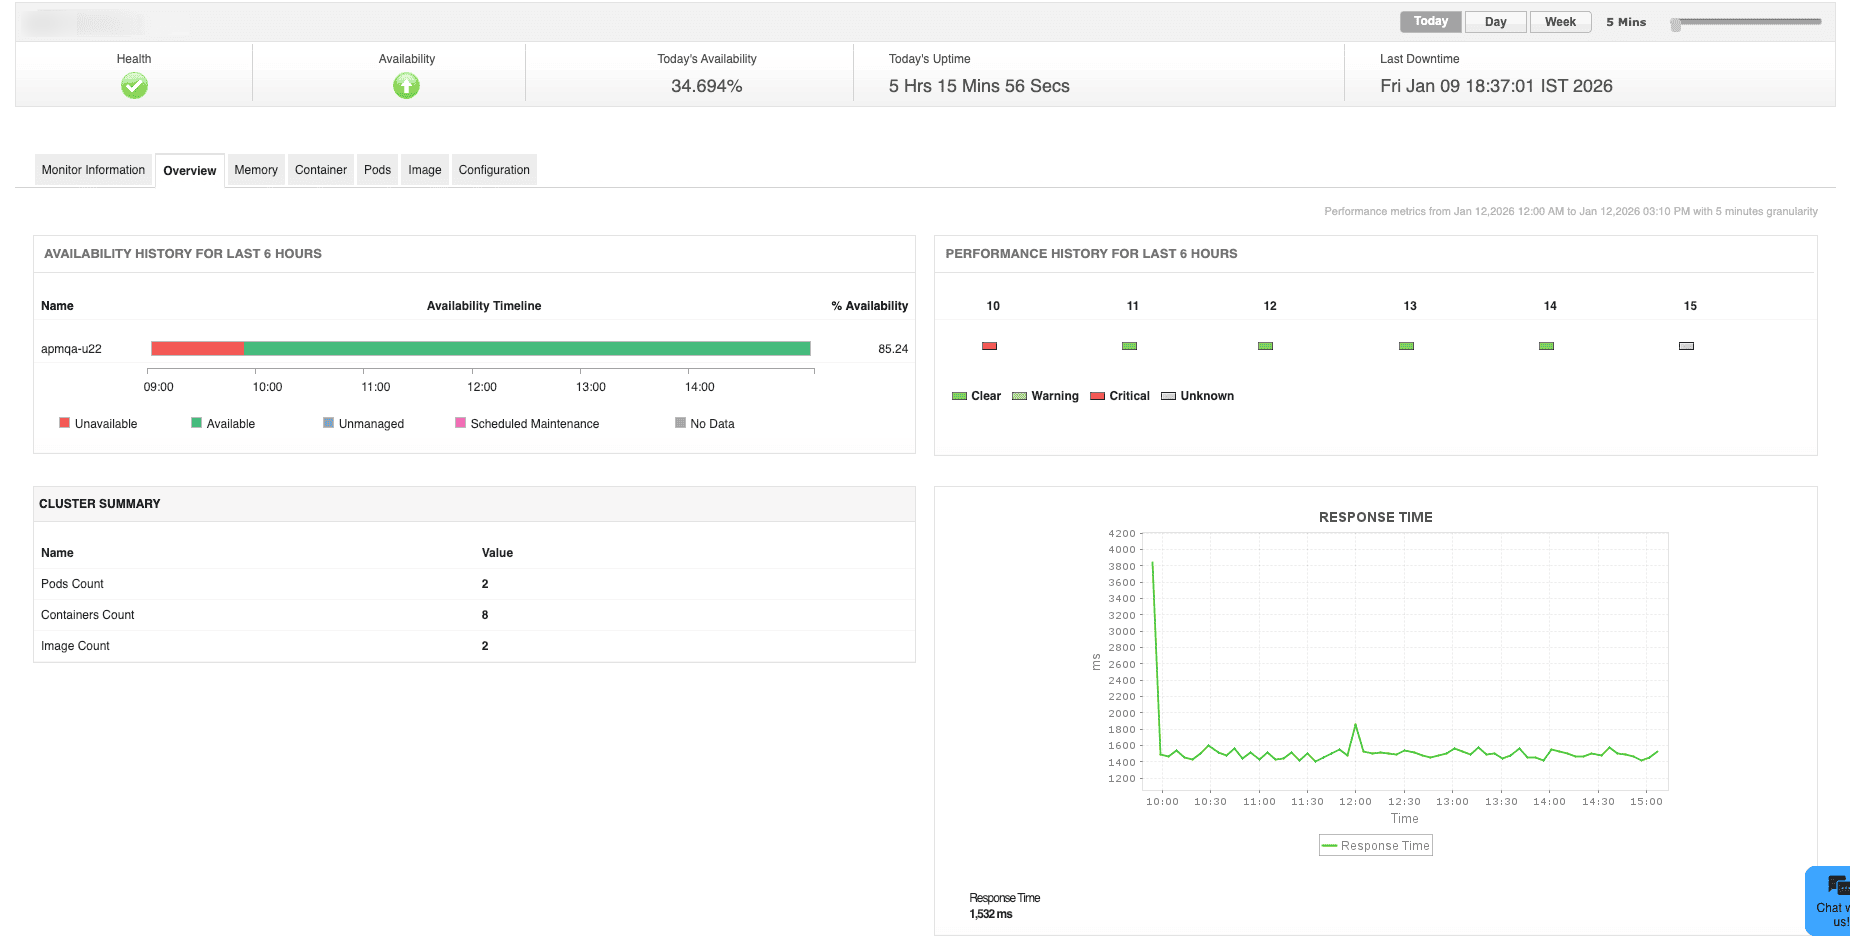
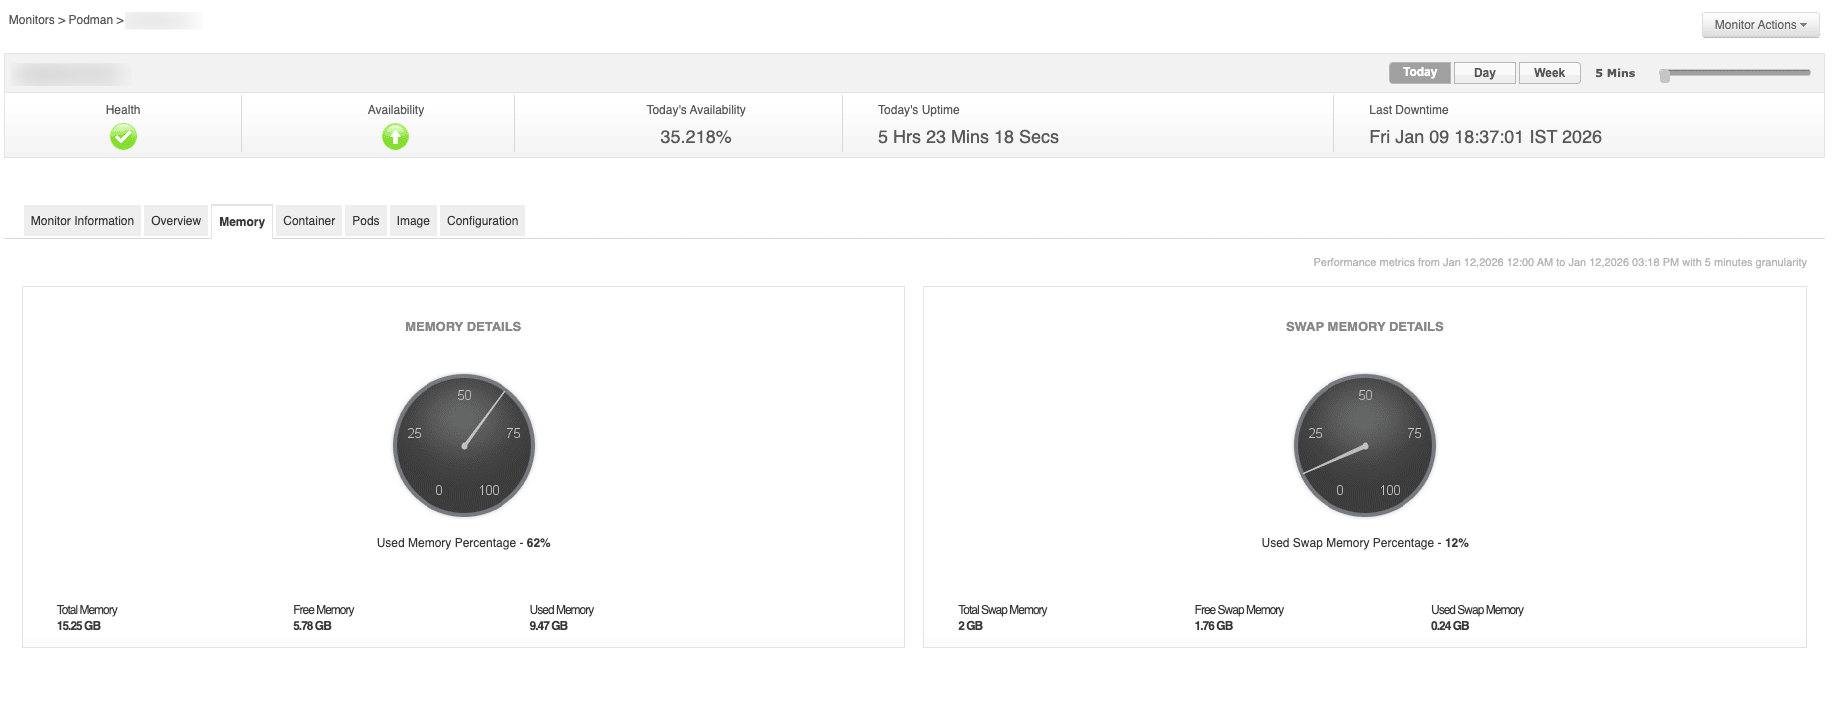
Obtain a comprehensive overview into the availability, health, and performance of your Podman environment in real-time. Keep a close watch on the critical KPIs of your Podman containers such as response time and memory utilization to ensure they are up and running without any interruptions. Gain detailed visibility into the total number of pod, container, and images that are present in your Podman environment along with their respective status split up in a single view.
Analyze the container workloads of your Podman environment
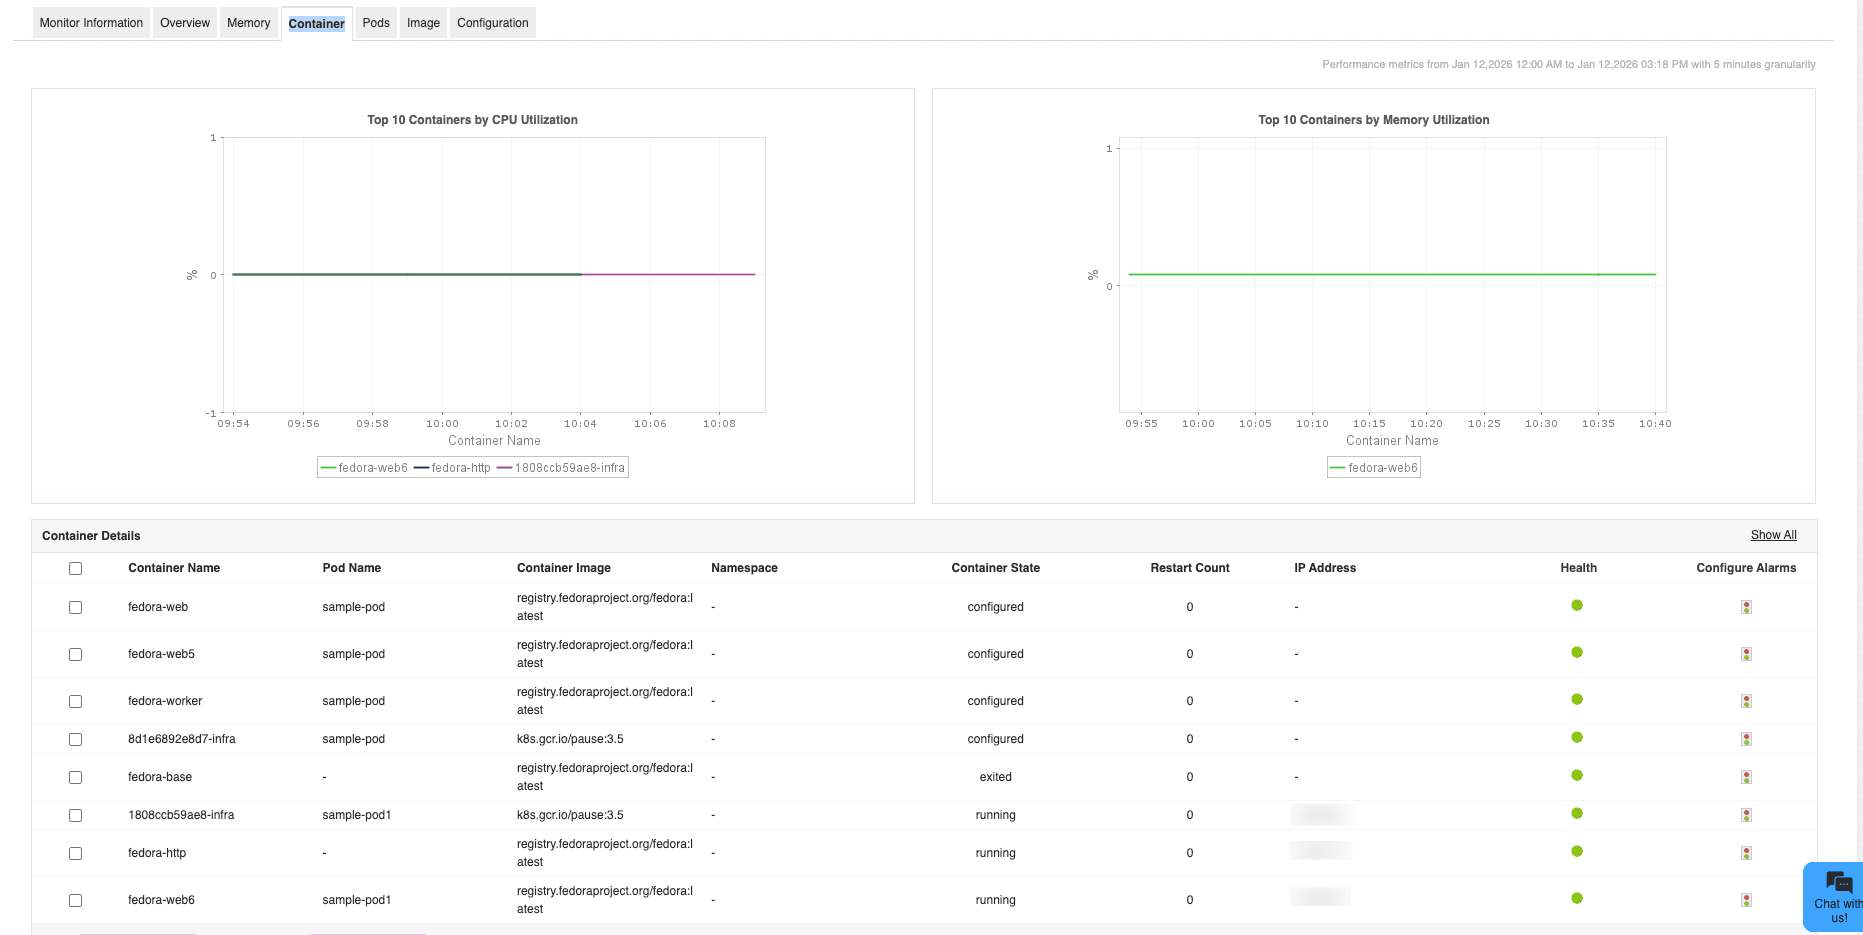
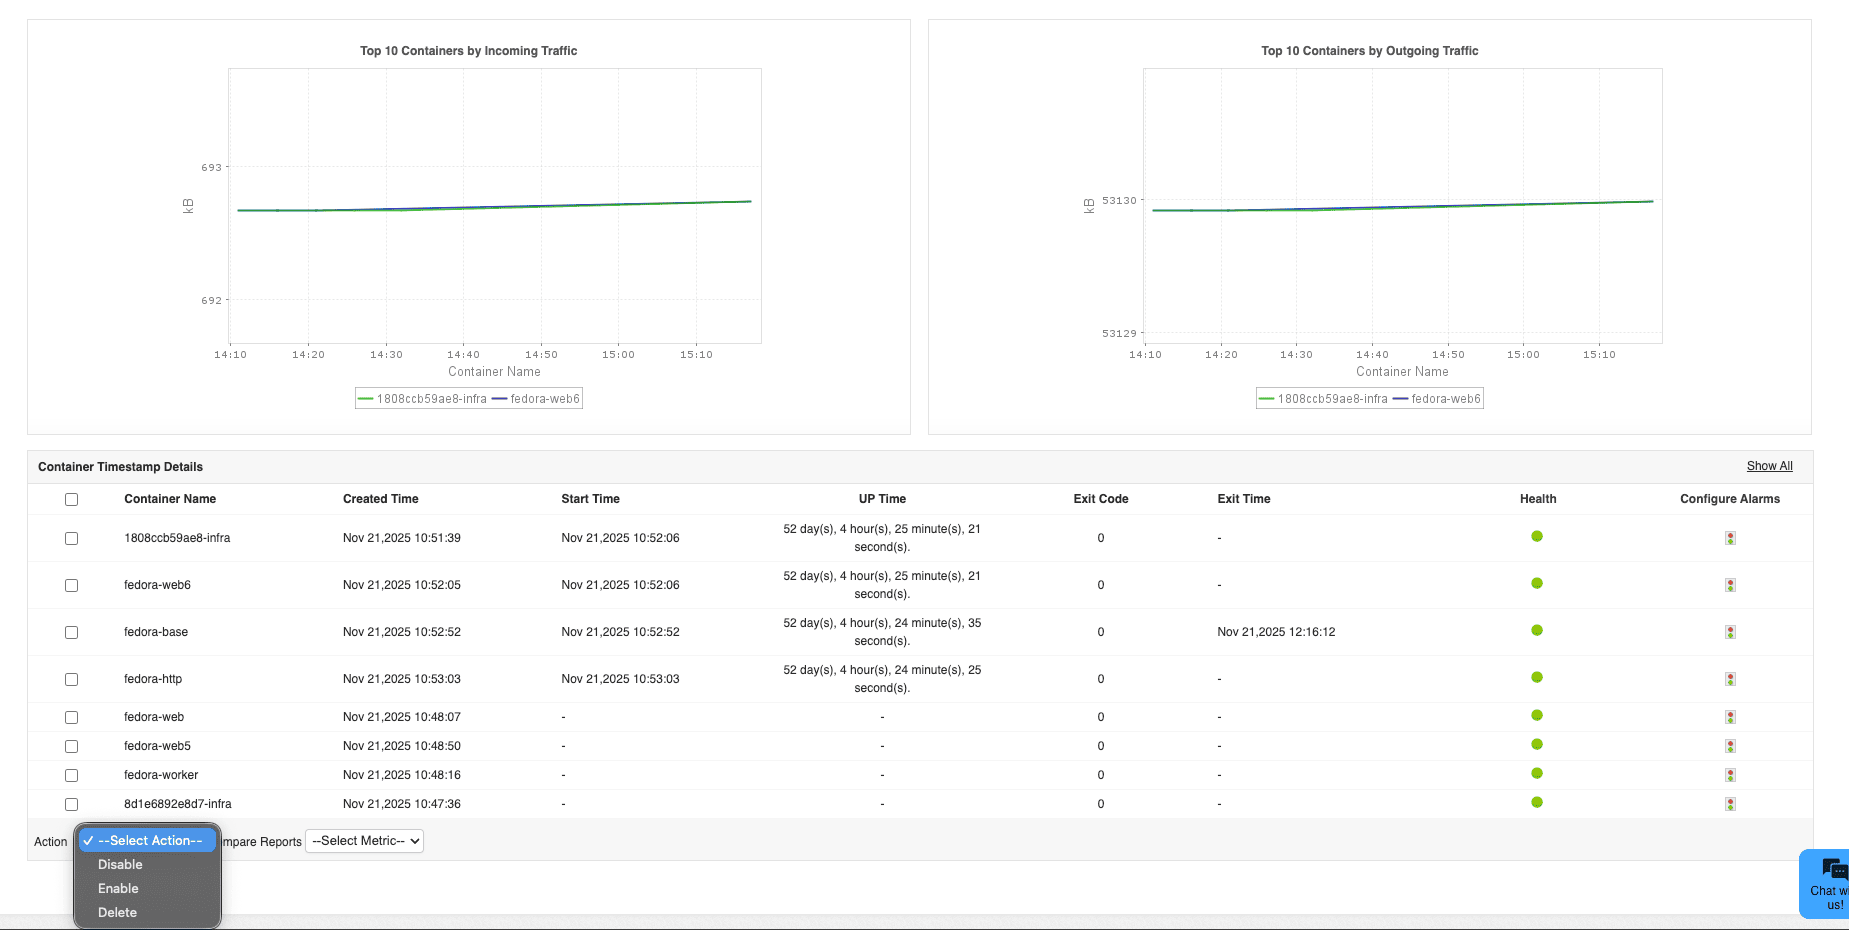
Gain in-depth insights into the health, availability, and performance of your containers running in your Podman environment in real-time. Find out how many containers are present individually or created under a pod based on their status and uptime to check whether your applications are actually available and quickly identify failed or unstable containers before they impact applications or users.
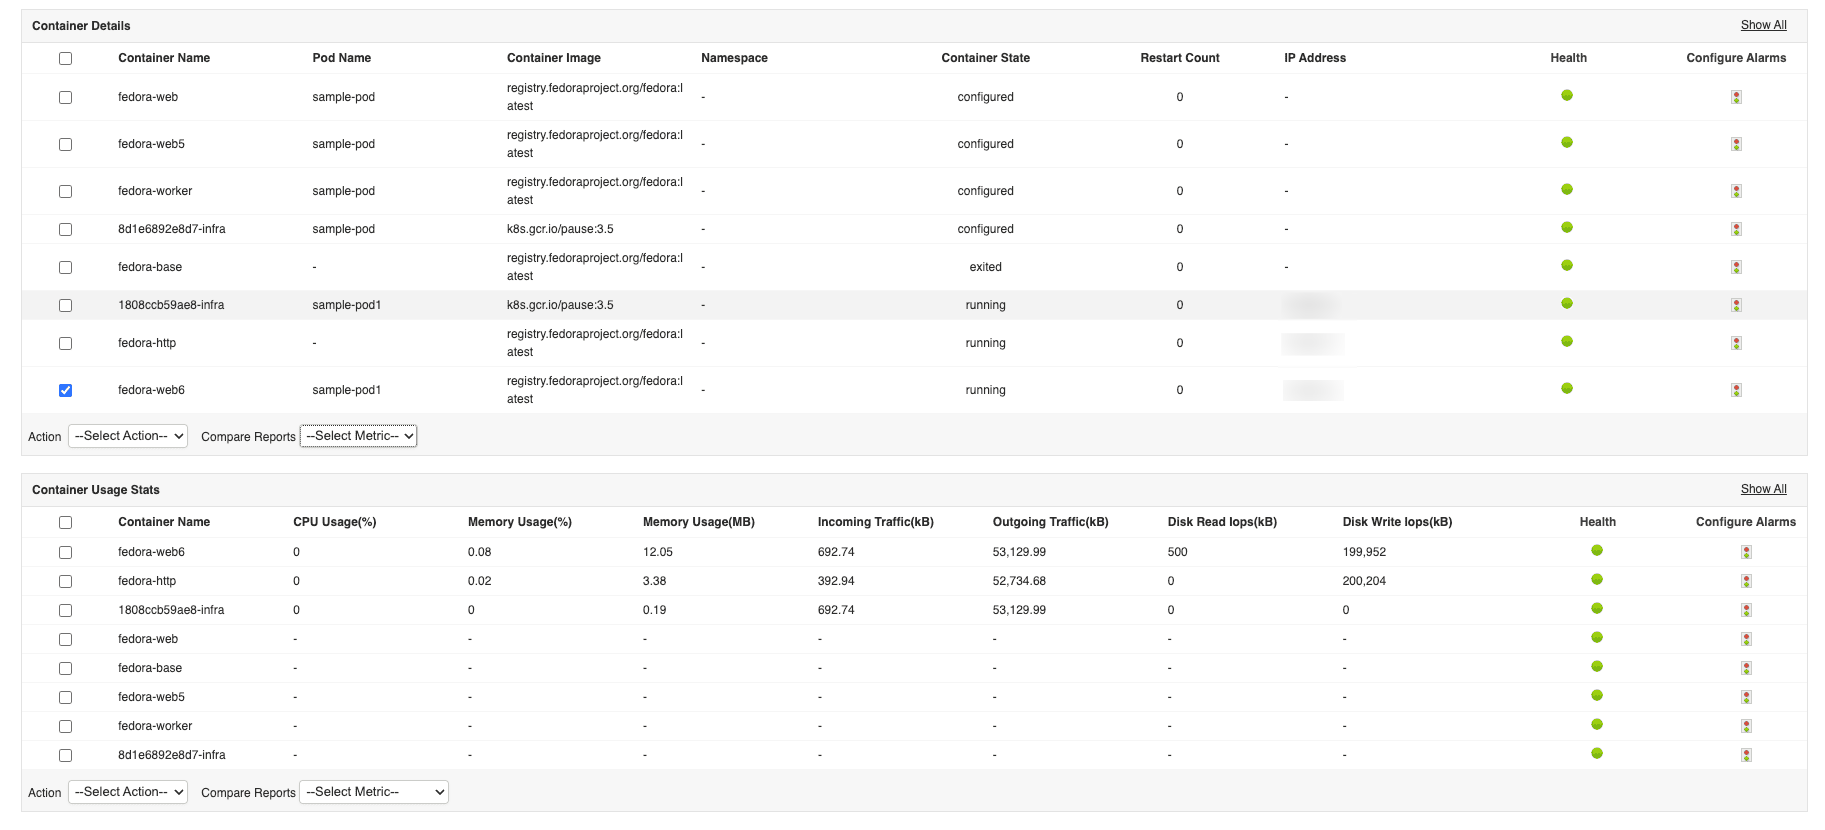
Examine how much resources are being consumed by the containers by keeping a close watch on key metrics such as CPU usage, memory usage, incoming/outgoing traffic, and disk read/write loops. This facilitates you to instantly detect:
- Performance bottlenecks
- Prevent out-of-memory errors
- Container crashes
- Disk exhaustion
- Identify unused or orphaned resources
- Ensure efficient utilization of your containers
Keep an eye on pod and container statistics
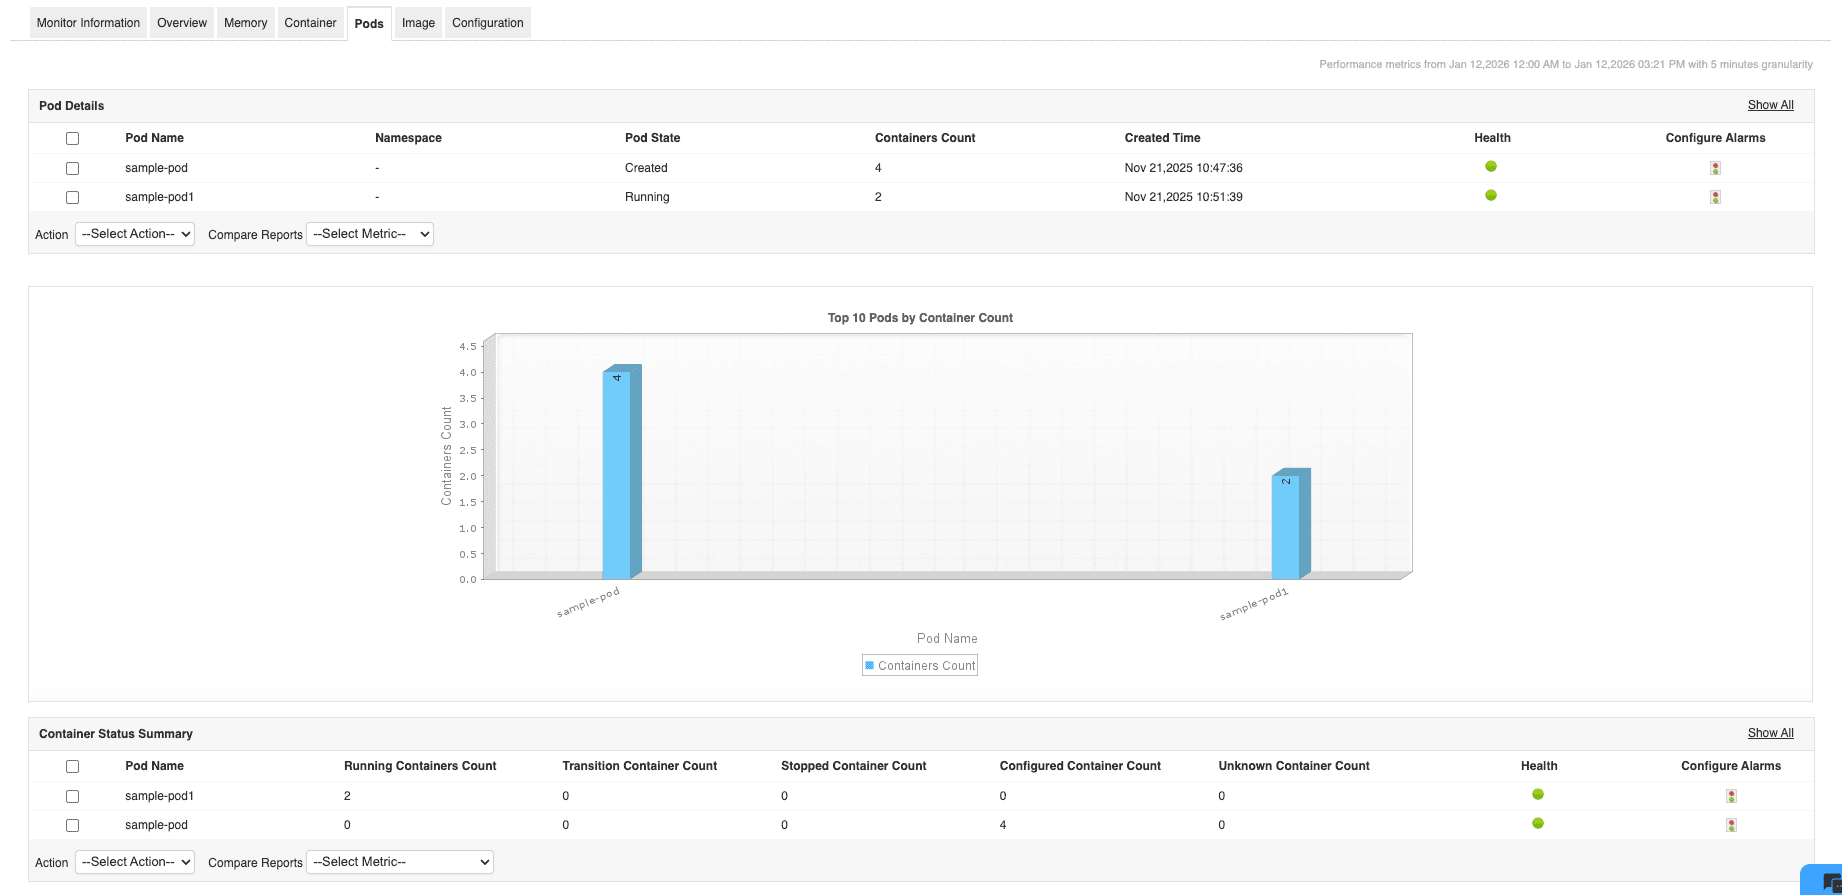
Get a quick overview into the pod and their corresponding container details available in your Podman environment with ease. Keep track of the pods that are present in your Podman environment along with the corresponding status and container count for each pod. Additionally, examine how many containers are present in your pods based on their respective statuses and get notified instantly in case of abnormal values in the status count.
Keep checks on image activity
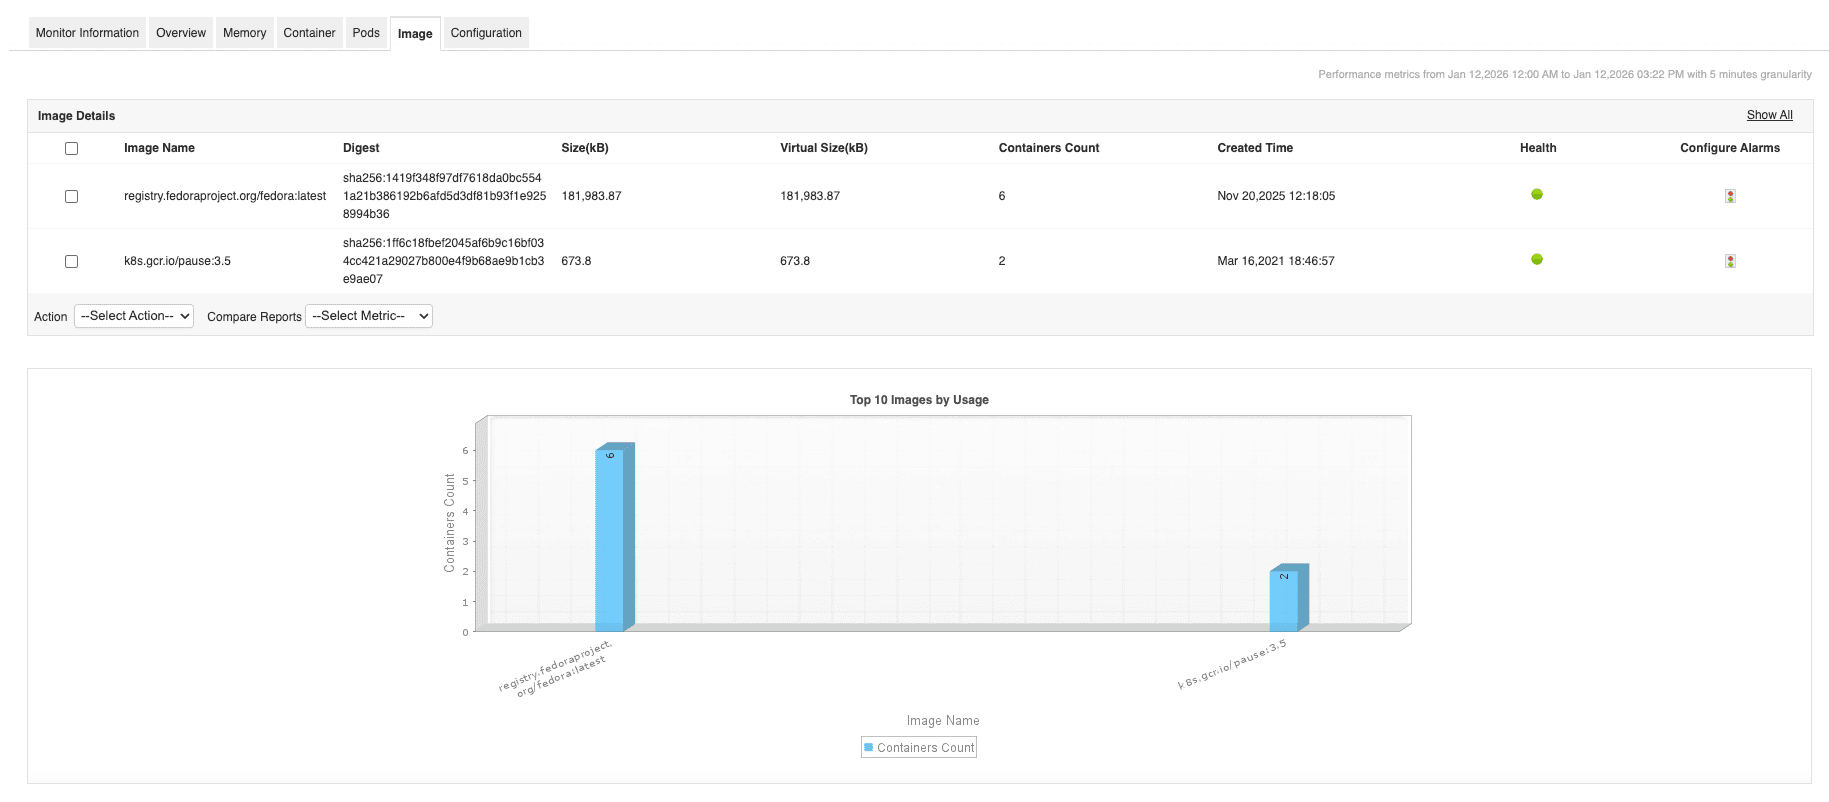
Get complete details into the container images that are available in your Podman environment. Examine the health of the images as well as the actual and virtual disk sizes consumed by the image layers to help you prevent storage leaks, and plan capacity correctly. Also keep a close watch on the number of containers that are created from these images irrespective of the container states to help you control storage usage and adjust them based on the disk sizes for optimal performance.
Monitor the performance of containerized applications
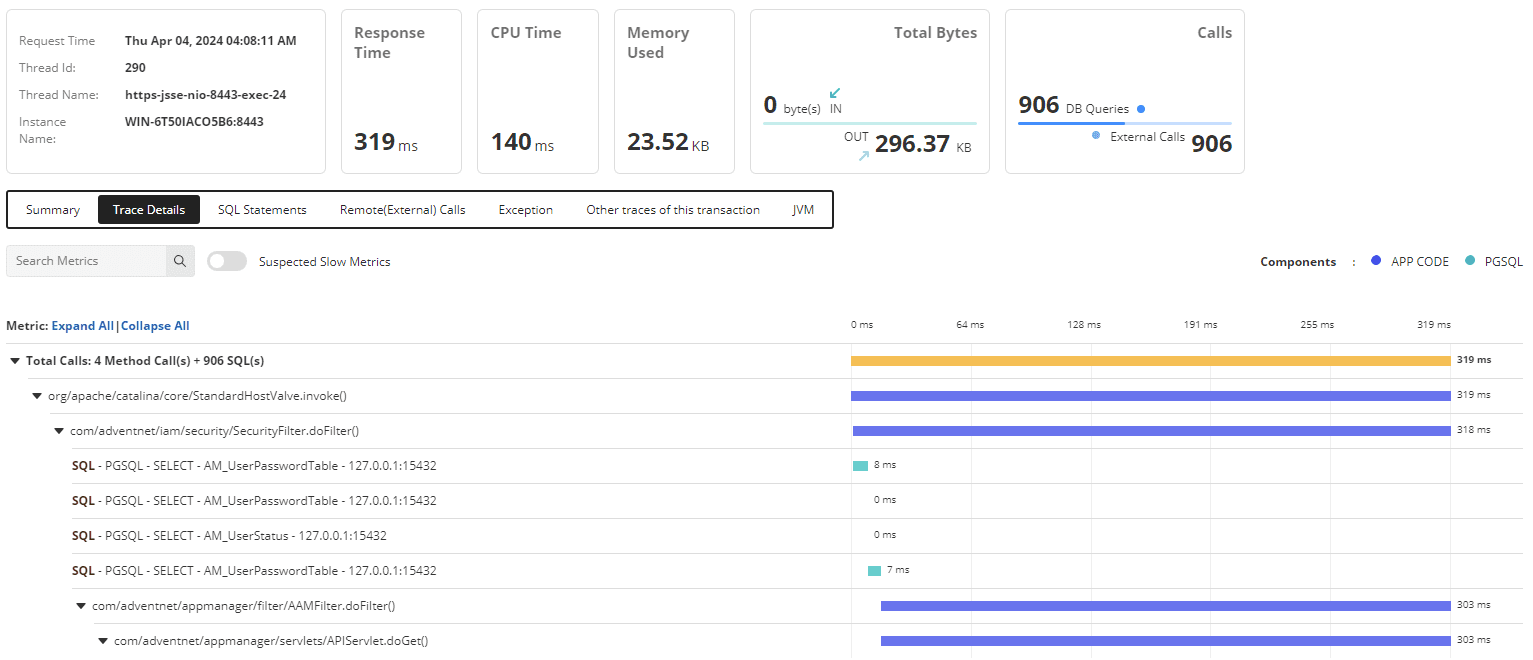
Get deep, code-level insights into apps running inside Podman containers. Watch and analyze every transaction in real time, with precise visibility into what’s happening at the code level—so you can pinpoint the exact source of performance issues, no matter where they start.
Learn more about application performance monitoring →
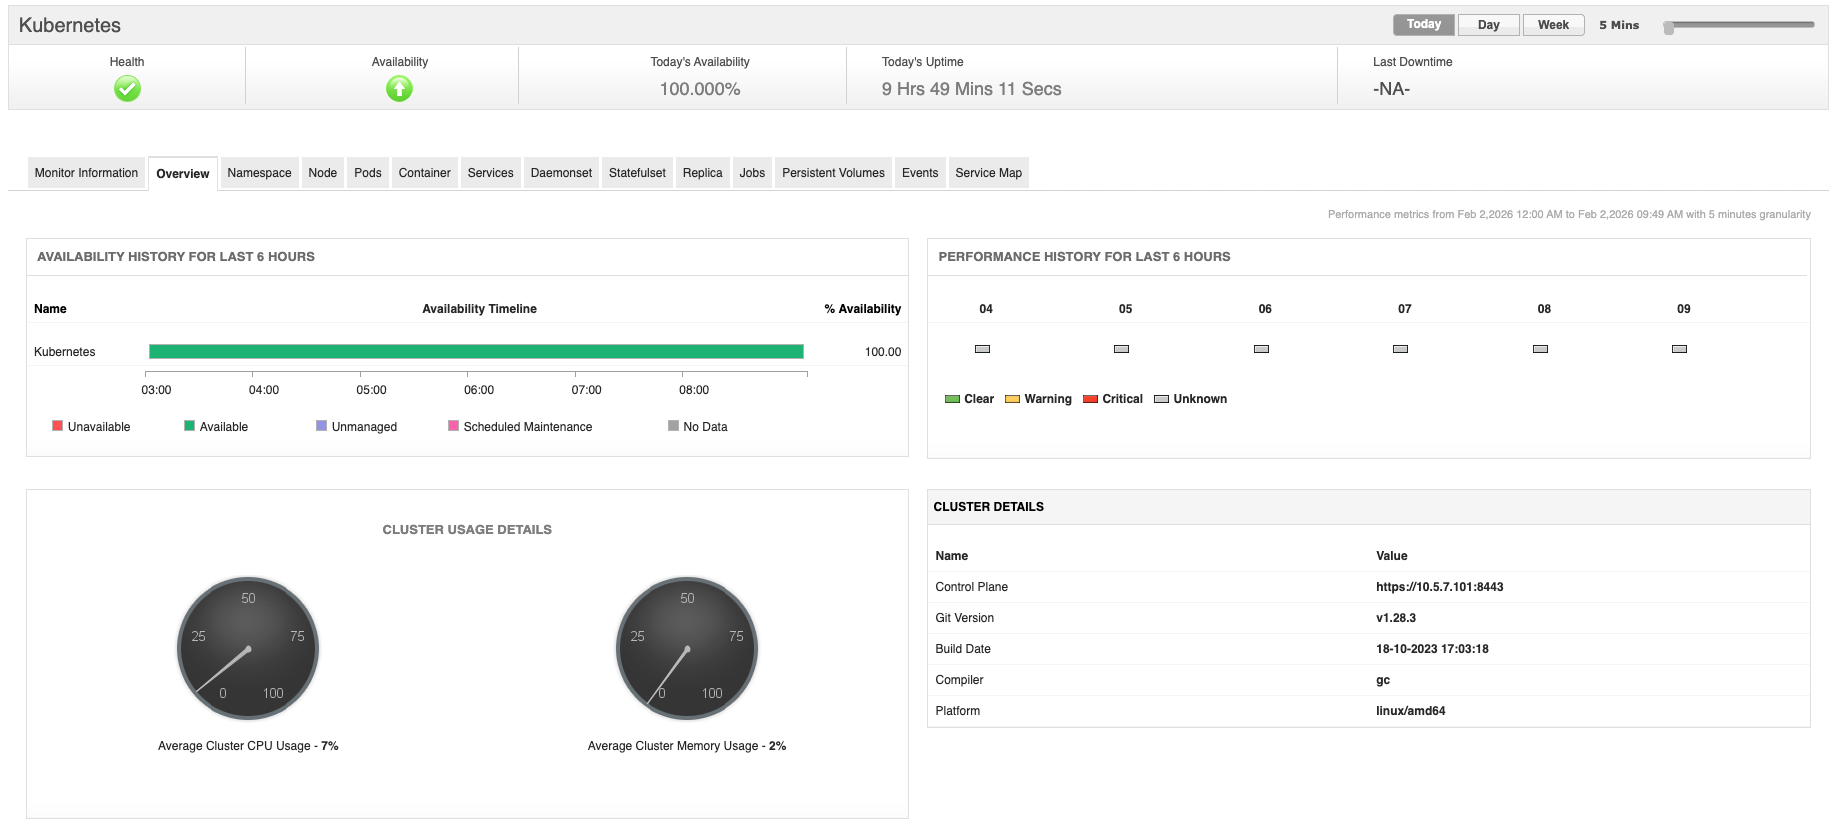
Keep track of your Kubernetes environments
Get a clear, detailed picture of your Kubernetes clusters' health and uptime, with powerful visibility into what's happening inside. Monitor container and pod performance in real time to catch issues before they cause crashes, memory overflows, slowdowns, or unexpected resource spikes. Automatically detect and map your clusters, showing how nodes, pods, and containers connect so you can spot problems fast and manage your clusters proactively—enabling fast fault detection and smarter, proactive cluster management.
Learn more about Kubernetes monitoring →
In addition to monitoring Podman containers, Applications Manager lets you track the health and performance of over 150+ infrastructure components—including databases, hosts, containers, middleware, and cloud services—along with full application performance and digital experience monitoring.
Common questions asked on Podman monitoring
What is Podman monitoring?
Podman monitoring is the process of tracking the health, performance, and resource usage of containers running with Podman. It helps teams gain visibility into container status, CPU and memory consumption, disk usage, image growth, and overall host stability.
How is Podman monitoring different from Docker monitoring?
While Docker relies on a central daemon, Podman is daemonless and often runs in rootless mode. Podman monitoring focuses on observing containers directly at the process and host level, with added emphasis on security, user-level resource usage, and systemd integration.
What metrics can I monitor with Applications Manager's Podman monitoring?
With Applications Manager, you can monitor container response time, memory usage, network I/O, actual and virtual disk size, container restarts, and host-level resource consumption. It also includes tracking stopped containers, unused images, and storage trends over time.
How does Applications Manager help manage disk usage in Podman?
Applications Manager helps you differentiate between virtual image size and actual disk usage, enabling teams to identify storage leaks, unused images, and containers consuming excessive disk space.
Is Applications Manager suitable for monitoring Podman deployments in production?
Absolutely. Applications Manager is designed for production-grade Podman monitoring, offering scalability, low overhead, and enterprise-ready observability.
