A tool that works for a small, stable cluster might fail when you add more topics or when multiple teams compete for resources. Choose a Kafka monitoring tool based on your daily operations, not abstract categories.
This article talks explains how to find the right Kafka monitoring tool, by looking past the list of features and focusing on how Kafka behaves in the real world.
Start with your production environment, not tool categories
A common mistake is starting with categories like "open source vs. paid" or "native vs. third-party." While these matter, they shouldn't be your first filter.
A more effective starting point for evaluating Kafka monitoring tools is understanding the nature of your Kafka environment:
- Size: How many brokers, topics, and partitions do you have?
- Traffic: Is it steady, or does it spike during certain times or batch jobs?
- Incidents: Do problems happen slowly, or do they hit as sudden backlogs?
- Ownership: Which team is the first to respond when things break?

Look for depth, not just a list of metrics
Most kafka monitoring tools show the same basic numbers. The real difference is how they present that data. Ask yourself:
- Can the tool show how producer speed, broker load, and consumer behavior affect each other?
- Does it explain why a metric changed, or just that it changed?
- Can you find the root cause without switching between different tools?
In production, Kafka issues are rarely simple. A spike in lag could be caused by slow processing, a sudden surge of data, or a full disk on a broker. Tools that connect these dots save you time.
Evaluate how consumer group lag is handled in practice
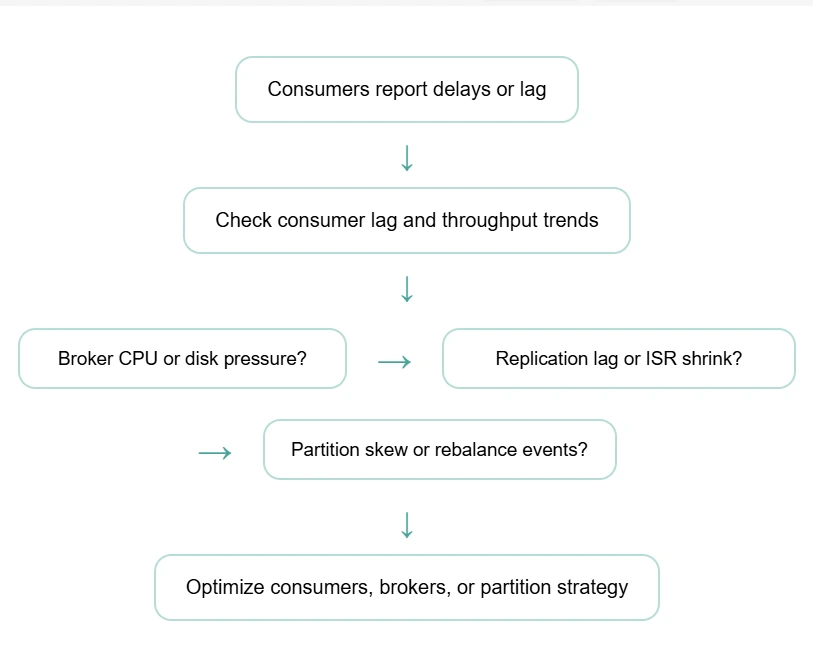
Consumer group lag is the most important signal in Kafka, and a key focus area for effective Kafka monitoring, but it is often misunderstood. Many tools show you a raw number but give no context. When evaluating a tool, check if:
- You can see lag trends over time.
- You can easily find which specific partition is causing the delay.
- You can tell if lag is caused by a traffic spike or a broken consumer.
In the real world, some lag is normal. You need a tool that warns you about real risks, not one that sends constant alerts that your team eventually ignores.
Learn the early signs of Kafka pipeline slowdowns here.
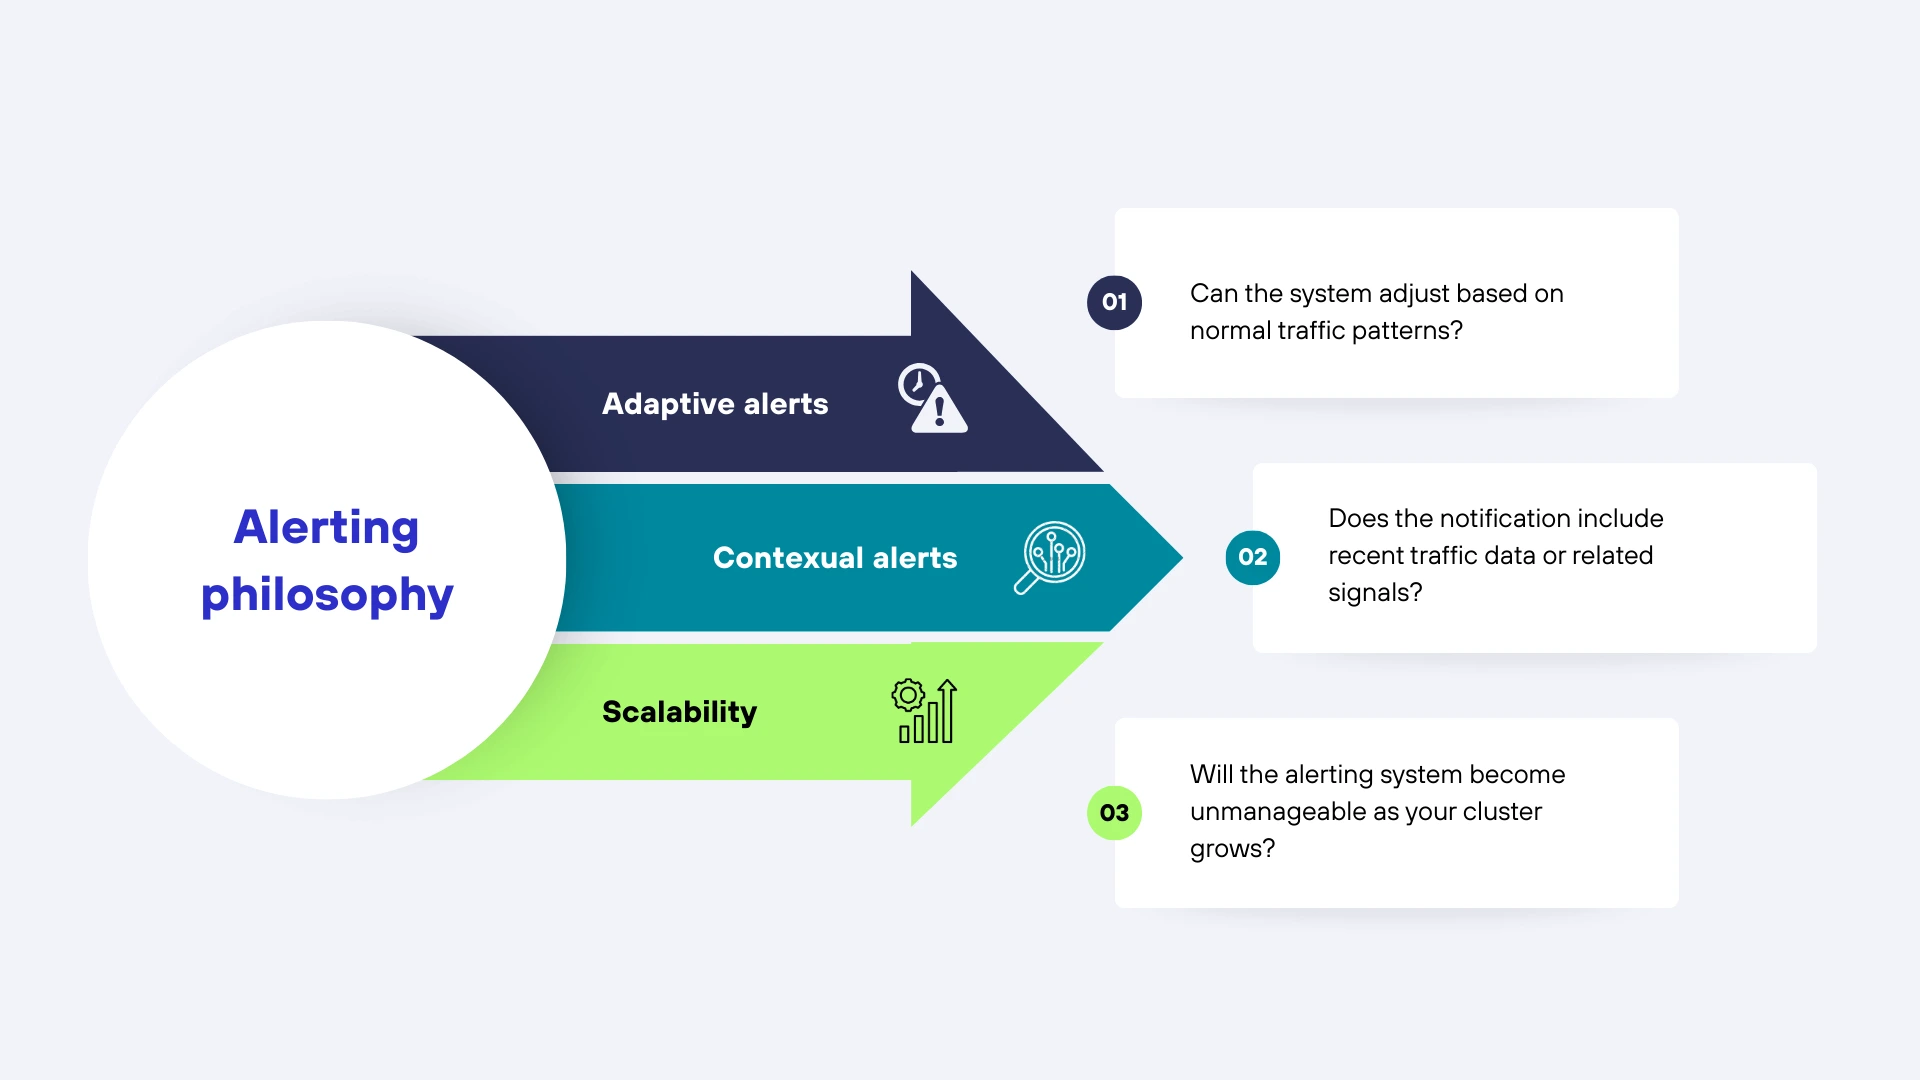
Focus on an "alerting philosophy"
Kafka is dynamic, which makes alerting one of the hardest parts of Kafka monitoring. Traffic changes and workloads shift. Alerting systems that use "static" (fixed) numbers often create too much noise. Look for a tool that offers:
- Adaptive alerts: Can the system adjust based on normal traffic patterns?
- Contextual alerts: Does the notification include recent traffic data or related signals?
- Scalability: Will the alerting system become unmanageable as your cluster grows?

"Alert fatigue" makes teams lose trust in their tools. A good solution helps you focus on real problems rather than flooding your inbox during normal shifts in traffic.
Check out the differences between Kafka monitoring signals and log data in this article.
Consider operational overhead and long-term ownership
Kafka monitoring tools are not just deployed. They are maintained, tuned, and adapted as Kafka environments evolve. This operational cost is often underestimated during evaluation.
Questions worth asking include:
- How much ongoing effort is required to maintain exporters or collectors?
- How often do dashboards and alerts need to be retuned?
- Who owns the tool once it is in place, platform teams or application teams?
- What breaks when Kafka versions or configurations change?
Some tools offer flexibility at the cost of constant maintenance. Others trade configurability for lower operational overhead. Neither approach is inherently better, but teams should be clear about the trade-off they are making. A tool that demands continuous tuning can become a burden in fast-moving environments.
Check how Kafka monitoring fits into the wider monitoring stack
Kafka rarely exists in isolation. Issues in Kafka often surface as application slowdowns, failed workflows, or delayed data processing downstream. Kafka monitoring tools that treat Kafka as a silo can make it harder to understand end-to-end impact.
When evaluating tools, consider:
- Can Kafka behavior be correlated with application performance?
- Is it possible to trace the impact of Kafka issues on downstream services?
- Does Kafka monitoring integrate cleanly with existing monitoring tools?
The goal is not to replace every monitoring system, but to reduce blind spots. Tools that allow teams to see Kafka in the context of the larger system help bridge the gap between infrastructure teams and application teams.
Recognize the signs that basic Kafka monitoring is no longer enough
Many teams begin with simple Kafka monitoring setups and outgrow them over time. Recognizing when this happens is an important part of evaluation.
Common signs include:
- Lag alerts trigger too late, after backlogs are already severe.
- Troubleshooting requires jumping between multiple tools and dashboards.
- Metrics are available, but relationships between them are unclear.
- Teams disagree on the root cause of recurring incidents.
When these patterns appear, the issue is often not Kafka itself, but the limits of the monitoring approach. Evaluating tools with these pain points in mind helps teams choose solutions that address real operational gaps rather than surface-level visibility.
A practical way to evaluate Kafka monitoring tools
Instead of comparing tools feature by feature, a more practical approach is to evaluate them against real incidents.
Start with a recent production issue and ask:
- Would this tool have detected the issue earlier?
- Would it have helped identify the cause faster?
- Would it have reduced the number of people involved in troubleshooting?
This incident-driven evaluation keeps the focus on outcomes rather than dashboards. It also makes it easier to assess whether a tool fits your environment and team structure.
Kafka monitoring with ManageEngine Applications Manager
Teams choosing Kafka monitoring tools for production look for early detection, fast diagnosis, and low overhead. ManageEngine Applications Manager delivers this with built-in capabilities that replace manual effort.
- Unified visibility: Track broker health, throughput, replication, and JVM behavior in one place.
- Deep lag details: Identify if consumer lag is caused by traffic spikes, processing delays, or resource limits.
- Zero maintenance: Eliminate custom scripts and exporters with out-of-the-box dashboards and alerts.
- Full-stack correlation: Link Kafka monitoring data with your applications and infrastructure to see how cluster issues affect your services.
By moving away from isolated metrics, your team can resolve incidents faster and spend less time managing the Kafka monitoring system itself.
Explore Kafka monitoring with Applications Manager.Try a 30-day, free trial now!

