- Latency and routing: A user in Singapore might experience higher latency than a user in New York due to the number of network hops.
- ISP performance: Sometimes the slowness isn't your code or the server. It is a specific regional ISP having connection issues.
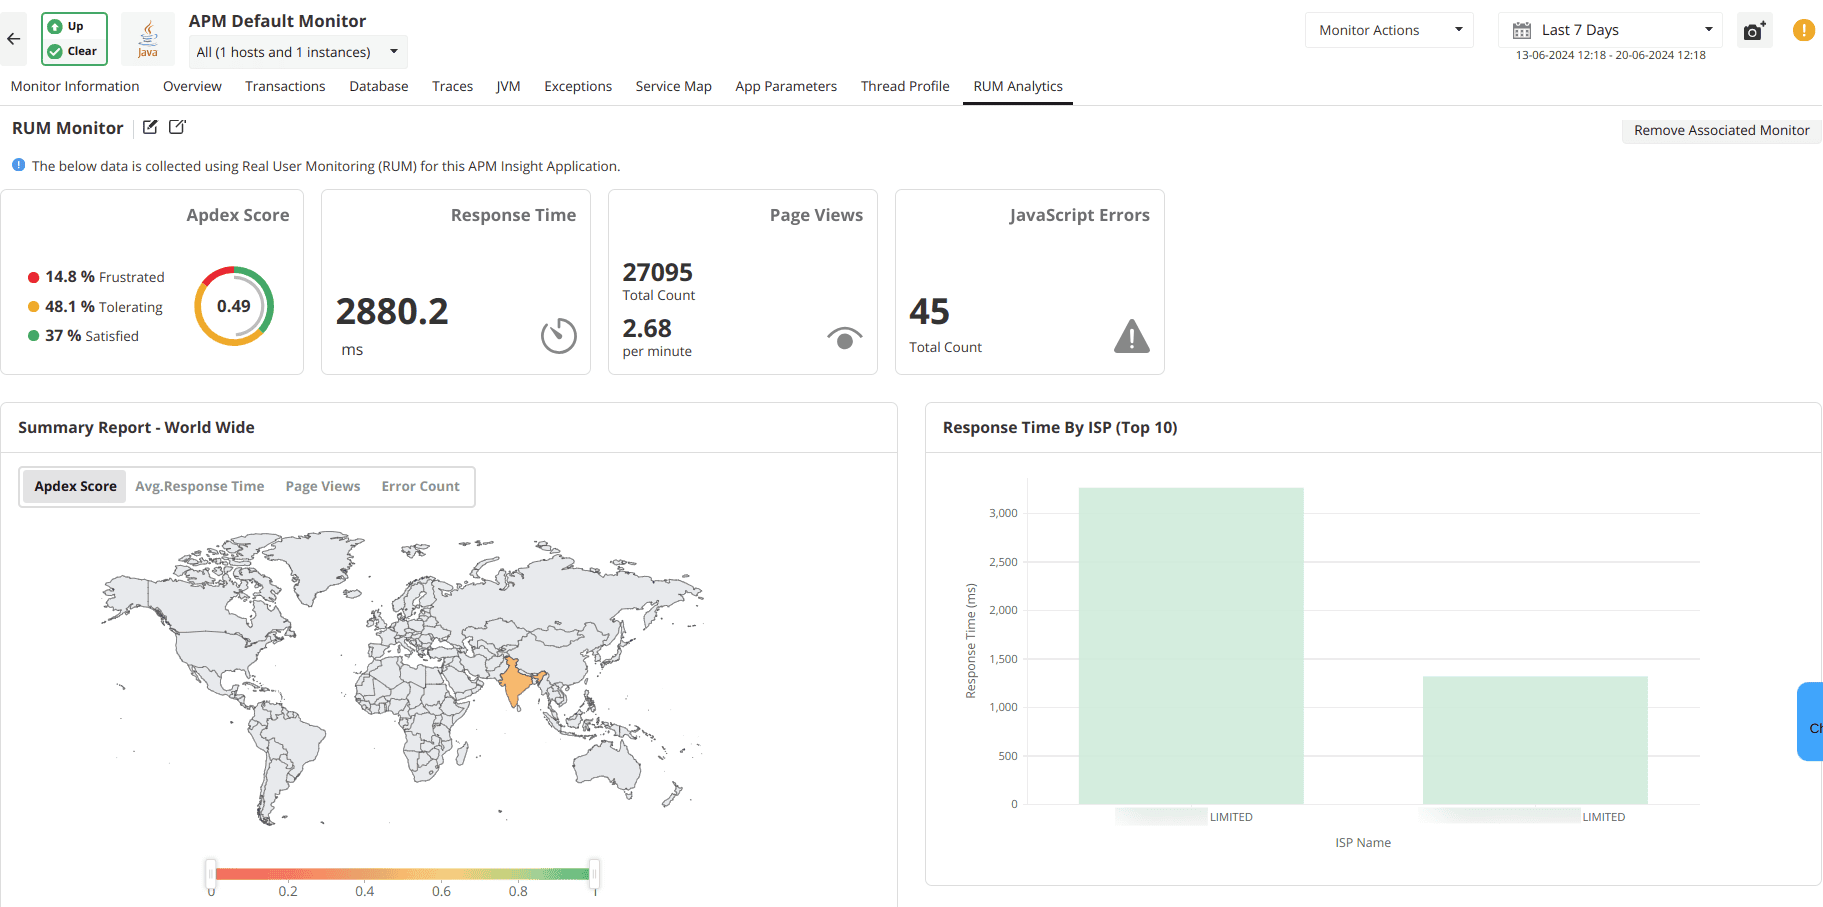
- Apdex by region: Applications Manager’s geographic dashboard allows you to view your Apdex score on a map. This lets you see if your satisfied users are clustered in one region while another region is frustrated.
Real User Monitoring (RUM) in ManageEngine Applications Manager provides this session-centric visibility. By capturing the combination of geography, browser behavior, device constraints, and page flow, it allows IT teams to move from reactive fixing to proactive experience management.
The anatomy of a session
A session is a complete user journey. When we monitor at the session level, we keep the continuity of the experience intact.
Traditional backend monitoring tells you if your server responded. Traditional front-end monitoring tells you if the page rendered. Session-level RUM tells you if the user achieved their goal. If a user visits five pages smoothly but the sixth page (the "Complete Purchase" button) hangs for 10 seconds, the previous five pages of good performance do not matter.
By tracking session duration and navigation flow, Applications Manager helps you see exactly where the friction occurs. You can identify if users are reloading the same page or leaving abruptly. You can correlate that behavior directly with technical performance metrics like Ajax latency or JavaScript execution time.
Breaking down the four dimensions of performance
To understand why a session failed, you have to look at the environment where it lived. Performance is rarely caused by a single variable.
1. Geographic and network realities
The physical distance between a user and your server remains a major hurdle in web performance.
2. The browser variable
Standardization in web development is better than it used to be but it is not perfect. Different browsers handle JavaScript and CSS rendering differently.
- Legacy support: If your team pushes a modern JavaScript update, it might run well on Chrome 120 but crash a session on an older version of Safari.
- Rendering engines: Session-level monitoring groups performance by browser. This allows you to see if a spike in load time is universal or isolated to a specific engine like WebKit or Gecko.
Device constraints
We often optimize for network speed but we forget about processing speed. A complex application requires significant client-side power.
- The mobile tax: A desktop computer has the power to parse 2MB of JavaScript quickly. A mid-range mobile phone might struggle. This leads to long tasks that freeze the user interface.
- Viewport and connectivity: Applications Manager segments data by device type and connection type. This reveals if your site is too heavy for mobile users who are operating on limited bandwidth.
4. Page context and resource loading
Not all pages are equal. A home page serves a different purpose than a search results page.
- Ajax and third-party bloat: Many modern apps pull data via Ajax. If your backend is fast but a third-party tracking script is blocking the main thread, the user thinks the site is broken.
- Throughput: Applications Manager tracks how many requests a page handles against how fast it responds. This helps you identify pages that break under high volume.
 Solution")
Practical industry applications
E-commerce: Protecting the conversion funnel
In retail, milliseconds equal money. If the "Add to Cart" action takes longer than two seconds, conversion rates drop. Using session-level RUM, an e-commerce team can see that users on mobile devices in Western Europe are abandoning their carts. The data reveals a JavaScript error triggered only on mobile browsers during the payment step. Without session context, this would look like a generic drop-off in Google Analytics. With RUM, it is a clear technical bug.
SaaS: Ensuring global consistency
SaaS providers often promise specific performance levels. When a major client in Australia complains that the dashboard is slow, the SaaS team needs to know if it is the whole app or just the Australian region. Applications Manager allows the team to filter sessions by that specific region and page. This provides the evidence needed to fix CDN routing or database queries for that segment.
Internal enterprise apps: Productivity monitoring
For internal tools, performance is a productivity metric. If employees spend 30 minutes a day waiting for pages to load, that is a massive cost to the company. IT teams can use ISP and Device views to determine if remote workers on home Wi-Fi are having a different experience than those in the office. This helps them find VPN bottlenecks or outdated hardware.
Closing the loop with JavaScript error tracking
One of the most useful features of session-level monitoring is the ability to see errors in context. A generic error log might tell you that a variable is undefined. That is helpful but it doesn't tell you the whole story.
RUM tells you this error happened to a user in Tokyo using Chrome 118 on Windows 11. It happened specifically when they tried to click the "Download PDF" button after waiting 4 seconds for an Ajax call to finish. That level of detail turns a long investigation into a quick fix.
From averages to answers
Session-level real user monitoring means understanding the user's actual experience. You stop seeing aggregate numbers and start seeing the application through specific user contexts regardless of location or device.
ManageEngine Applications Manager provides the framework to capture these different experiences and turn them into facts. By connecting geography, browser, device, and page performance, you stop guessing why users are leaving and start knowing how to make them stay.
Ready to move beyond averages? Explore ManageEngine Applications Manager's Real User Monitoring capabilities and see how session-level insights can transform your performance optimization strategy. Try a 30-day, free trial now!