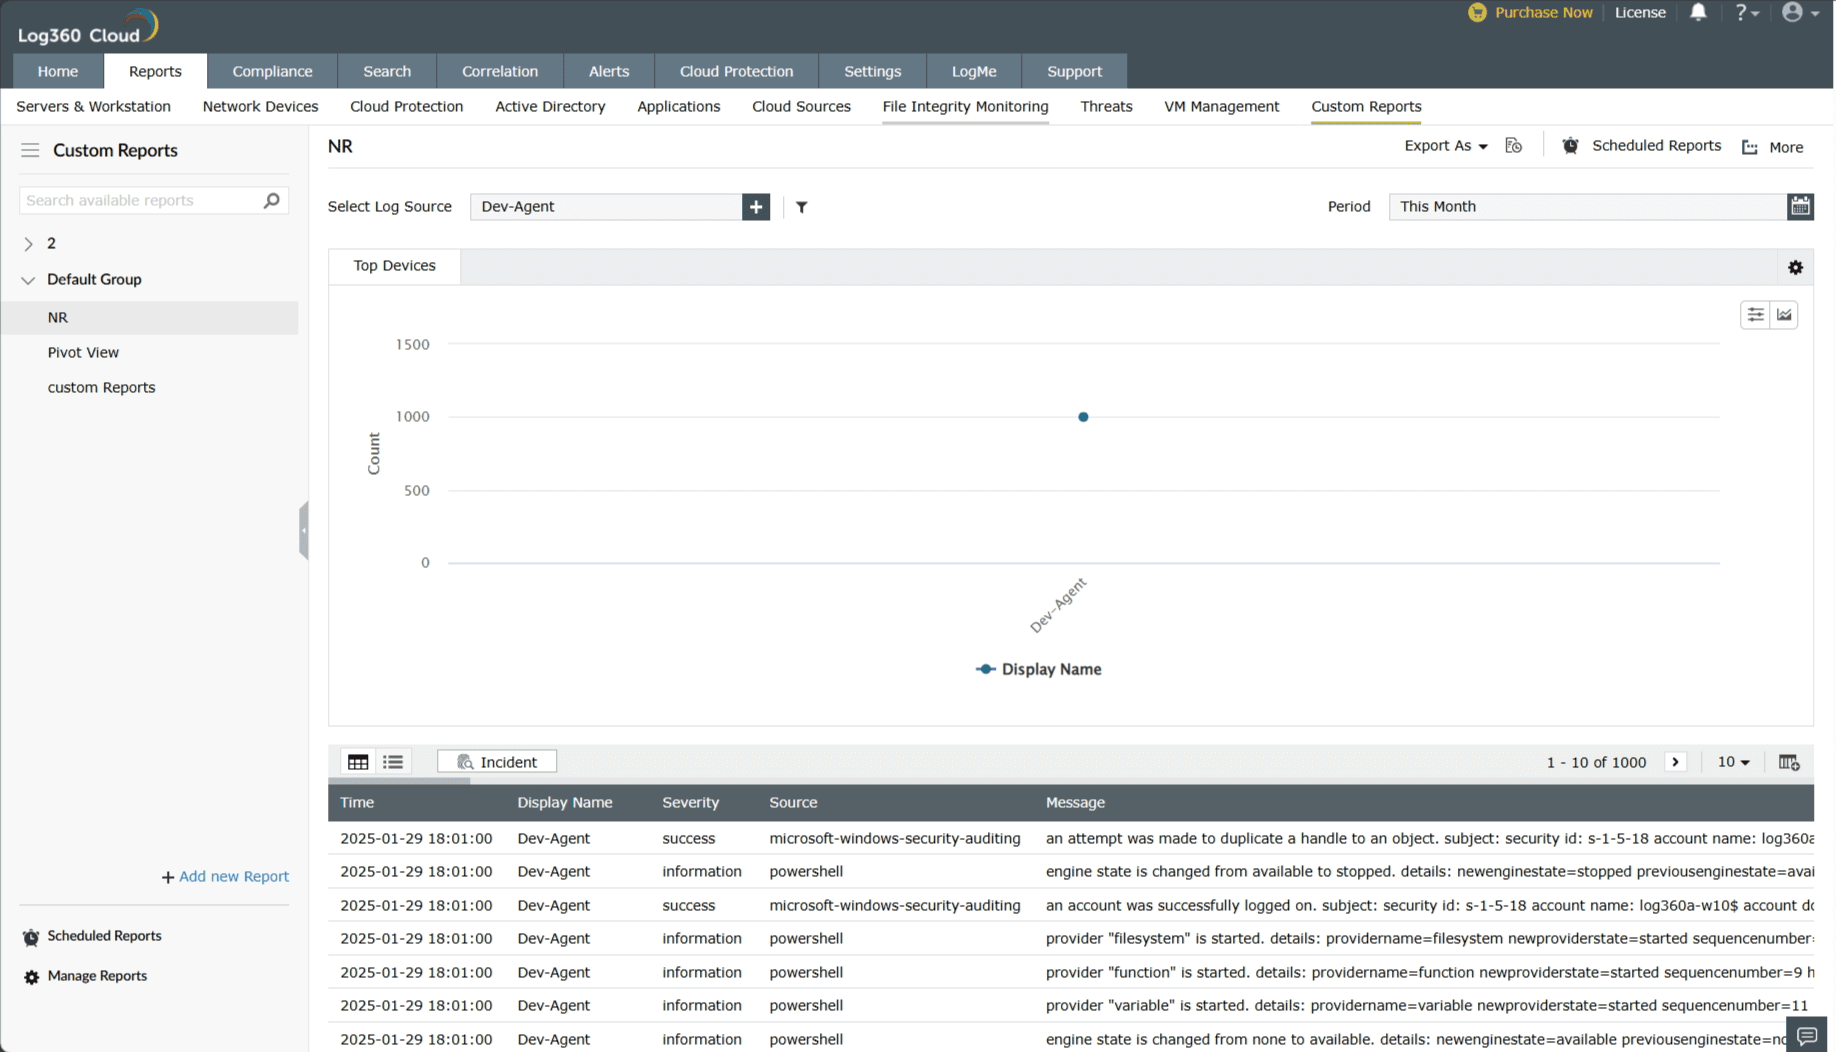
This view displays the data in the form of a simple table. You just need to frame the criteria for selecting logs for the report. You can generate different views of the same tabular view report. To create a new view, refer the Manage Report Views section.
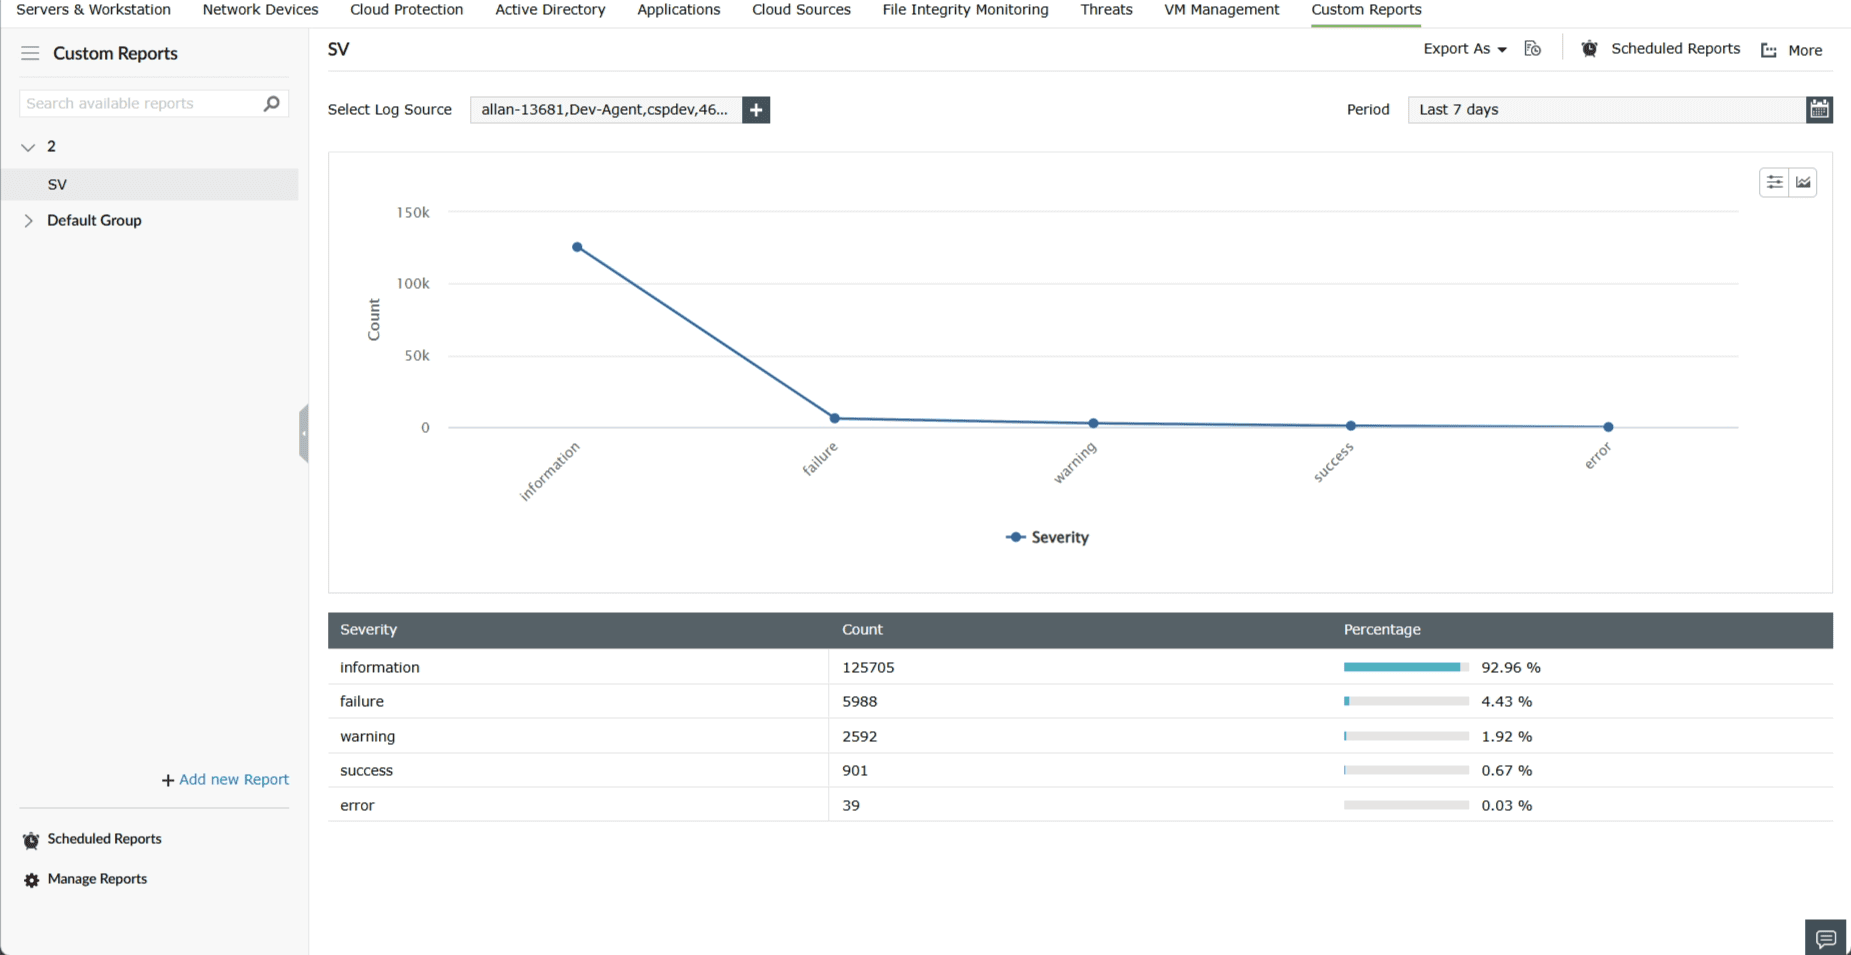
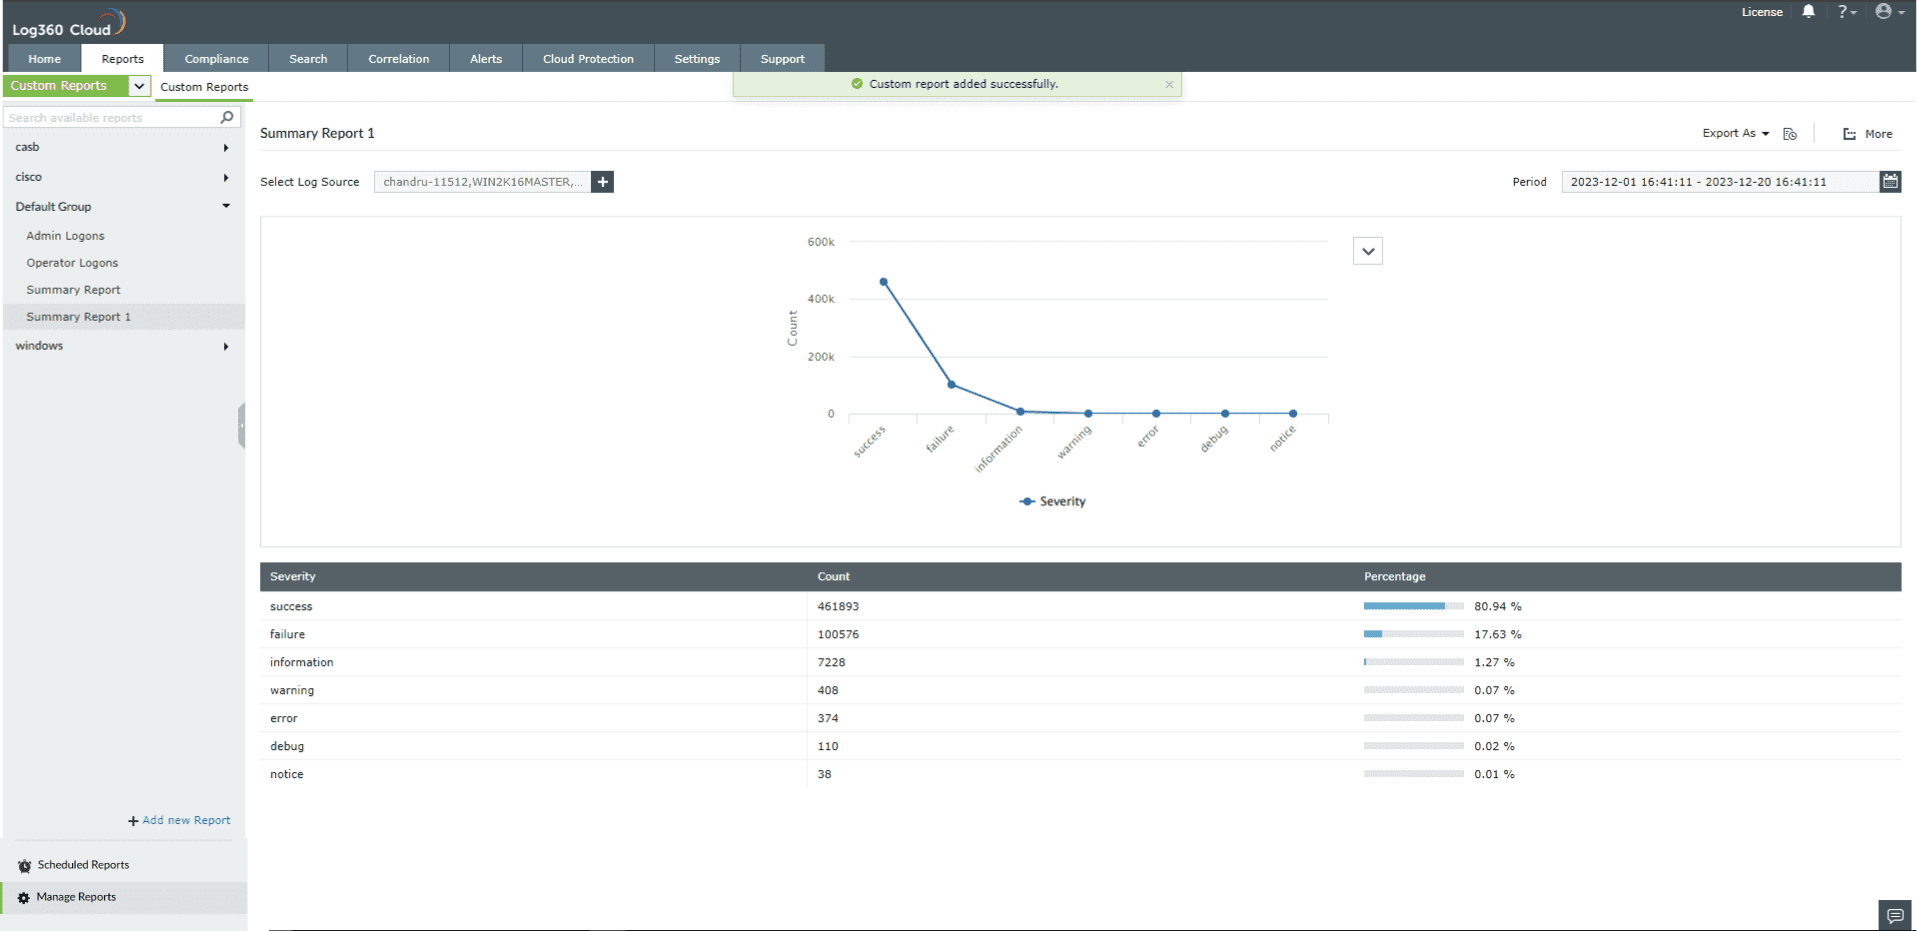
This view gives you a more granular representation of the log data. It allows you to select multiple criteria based on which data will be displayed. After framing the report criteria, you need to select the fields based on which the summary view report will be generated.
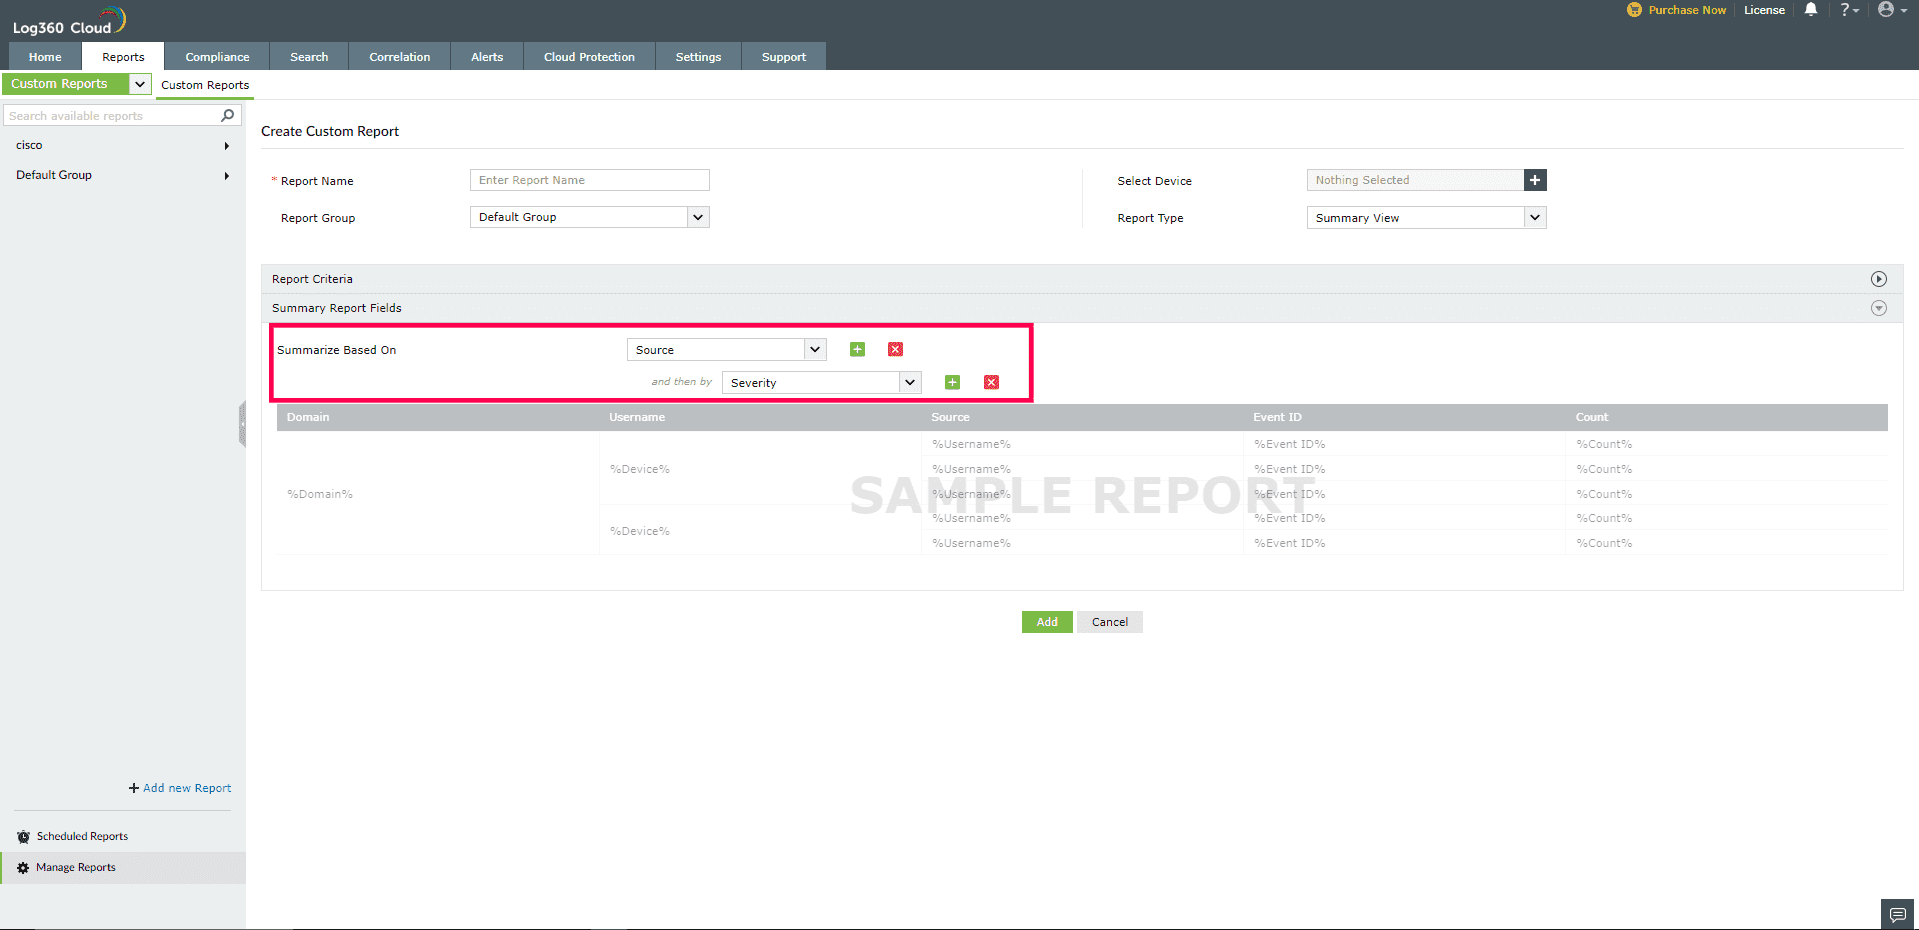
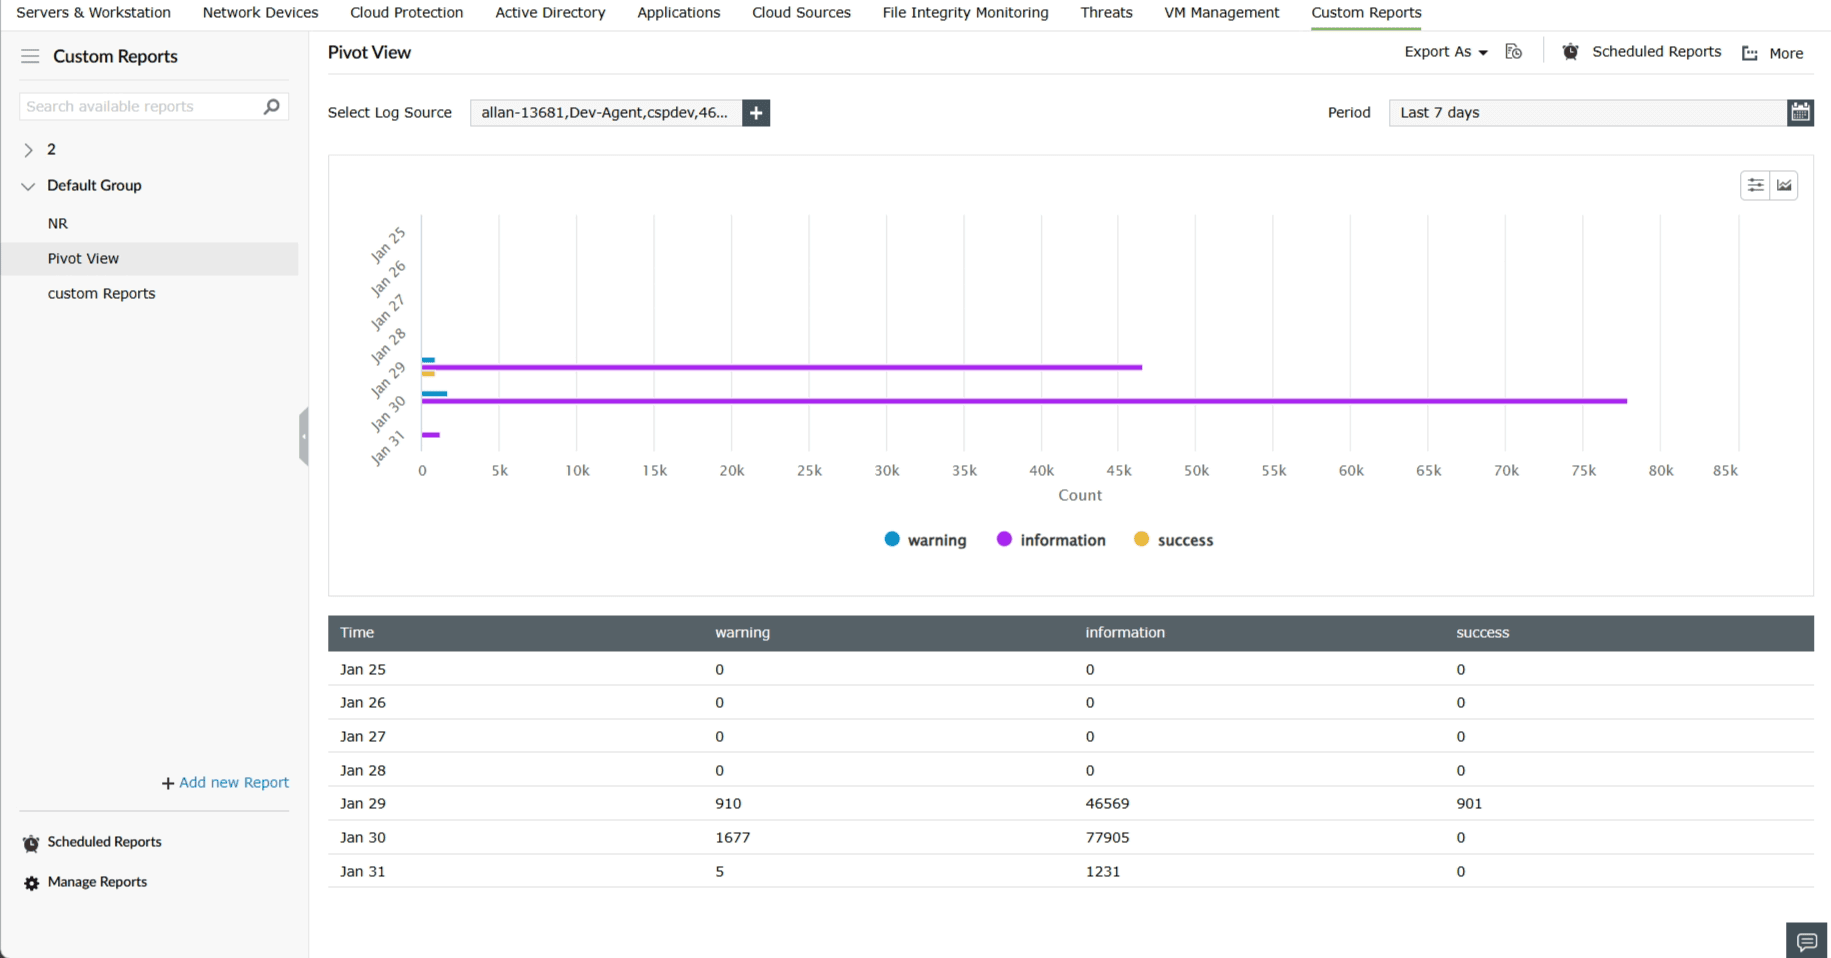
Note: When you apply one criteria, a graph will be generated. When you apply more than one criteria, a graph would not get generated, but the data would be displayed in a table.
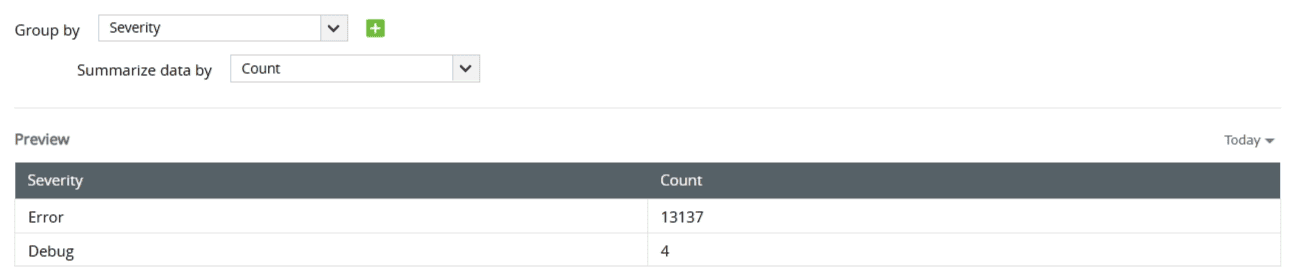
This view provides a more granular representation of the log data. You can group the data by one or more fields (using the Group by option) and summarize it (using the Summarize data by option) with count, sum, average, or other metrics.
This option is present in both the Summary and Pivot view configuration. You can summarize the data by the following metrics:
Count:
Shows the count of matching log entries within a specified group.
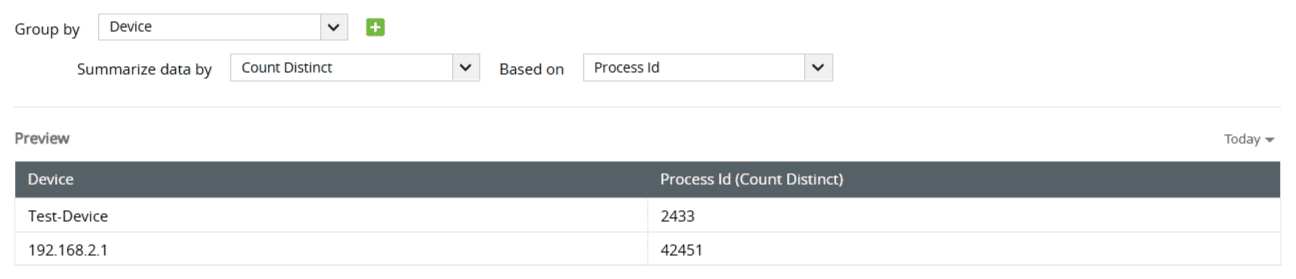
Count Distinct:
Shows the count of unique values based on a field.
Example: To determine the number of unique process IDs in a device.
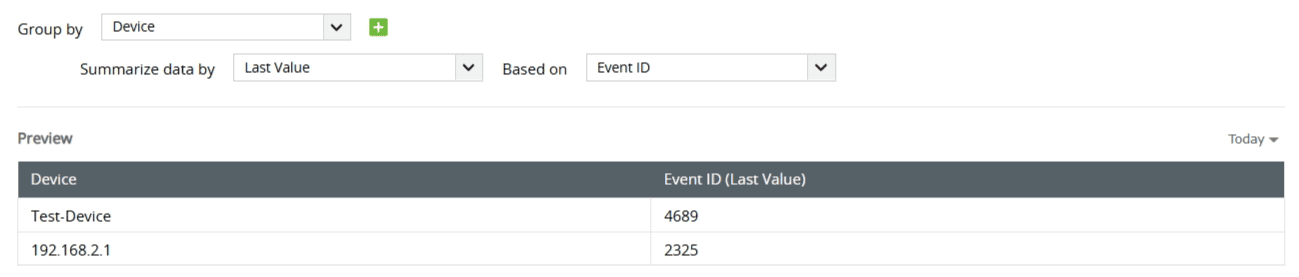
Last Value:
Displays the most recent value of a field within the selected time frame.
Example: To get the EventId of recent log of a device
First Value:
Similar to Last value, but instead of most recent value, it displays the initial value of a field within the selected time frame.
Note: A graph will not be generated for the First and Last values, but the corresponding data will appear in the table.
Sum:
Shows the total sum of values within a selected numeric field.
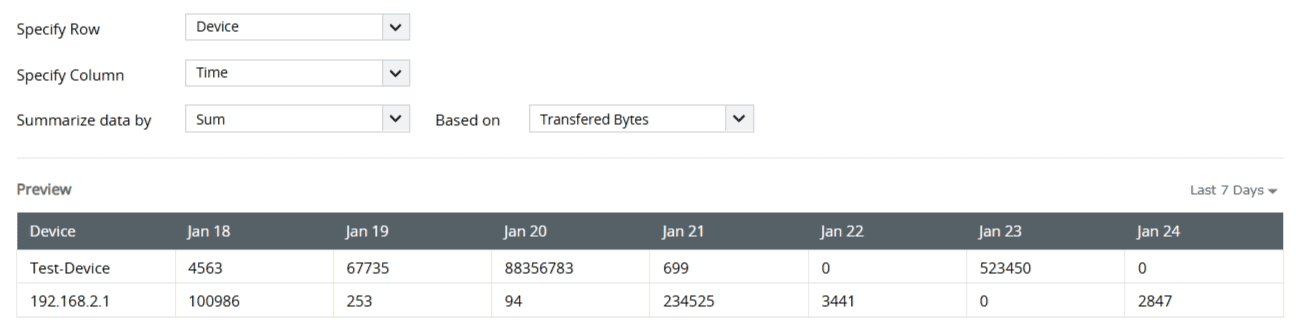
Example: To find the total number of bytes transferred across each day, grouped by device.
Average:
It shows the average value of a selected numeric field.
This view is useful when you have to monitor particular values of the field based on which the report is generated. After selecting the report criteria, you can select the field and the values in the field that you want to monitor. Each of those values will be displayed as separate columns with the 'count'.
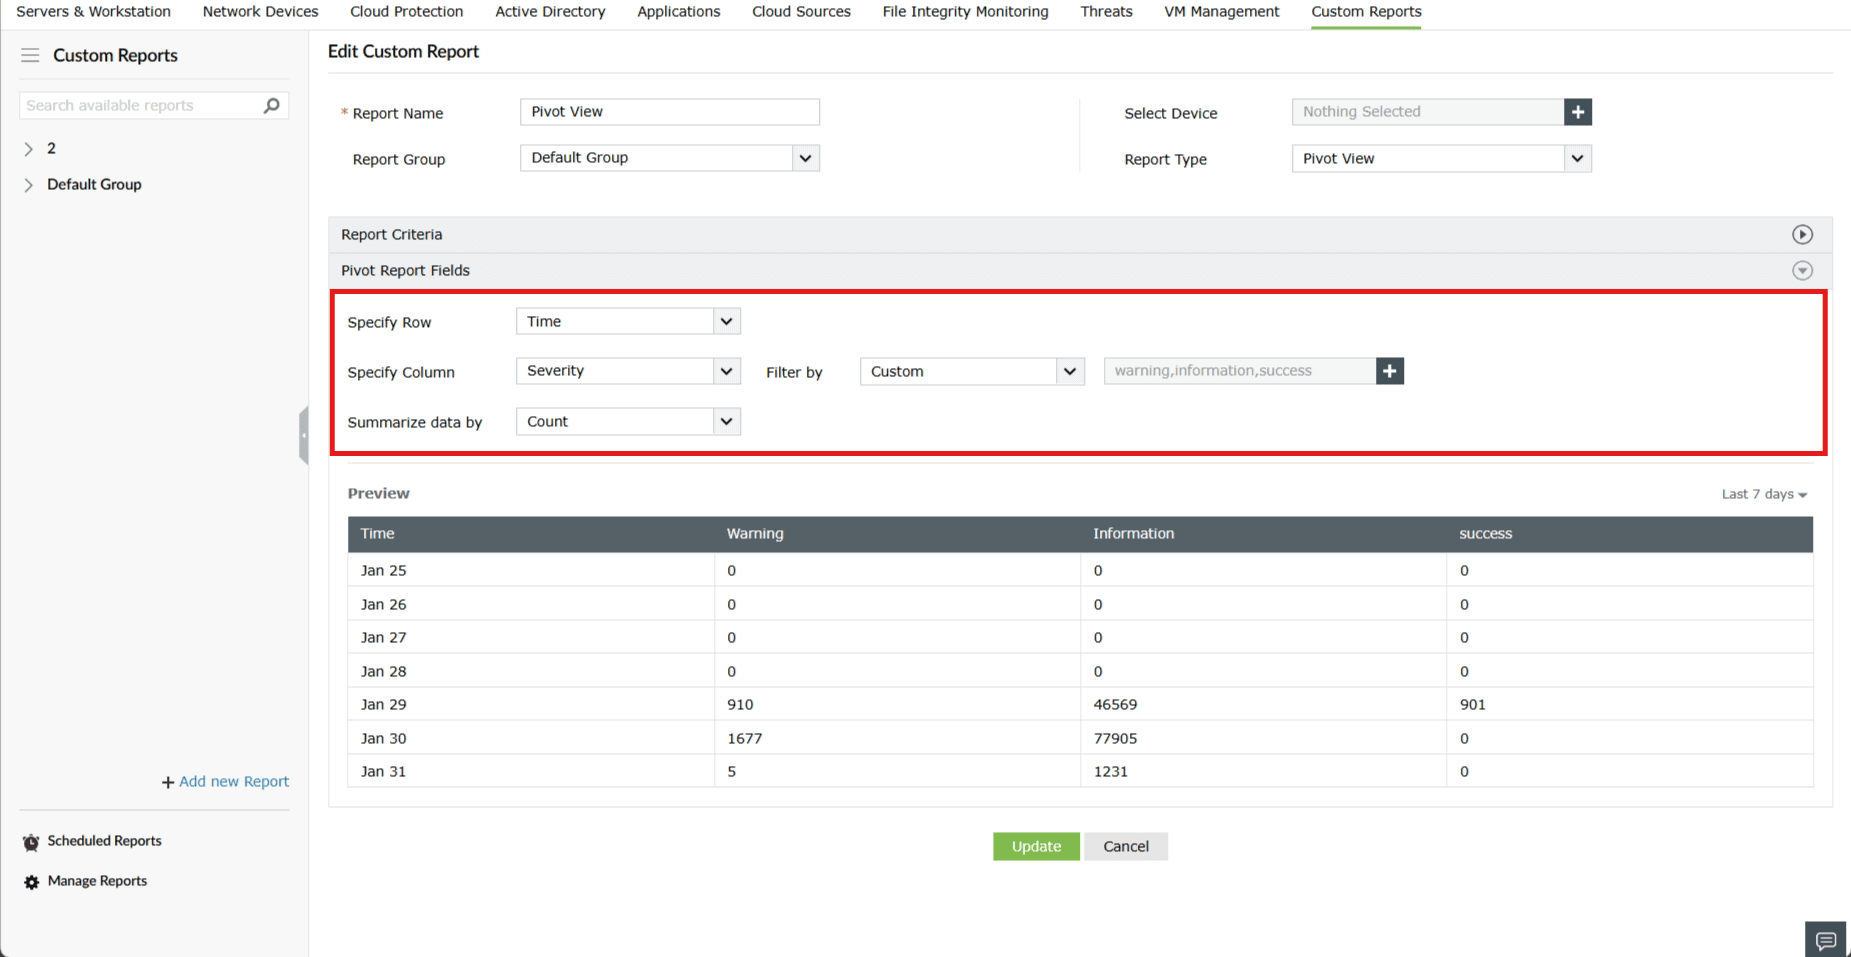
Note: A maximum of five values can be chosen for monitoring.
The Pivot View allows you to organize and summarize data in a tabular format using rows and columns. You can filter column field values by selecting up to five custom values or by choosing the top or least five values. This view is especially helpful for tracking specific data points, with each selected value displayed as a separate column, and the chosen metric shown under the Summarize Data by option.
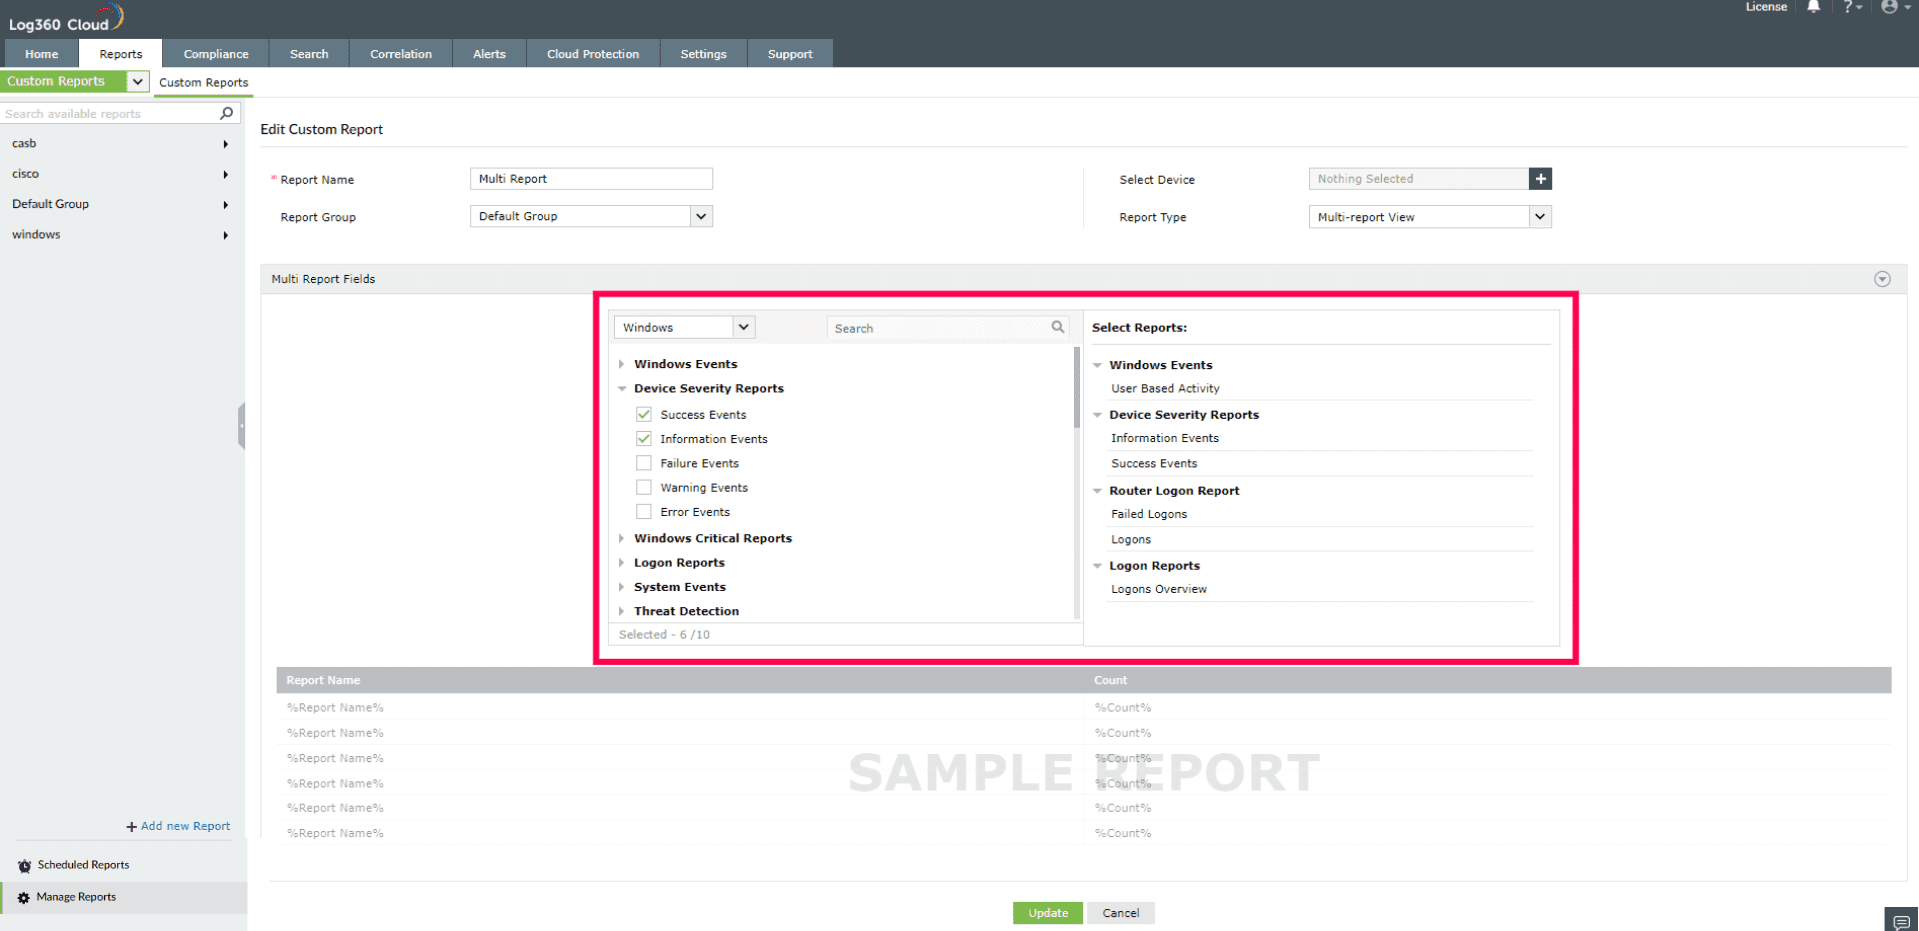
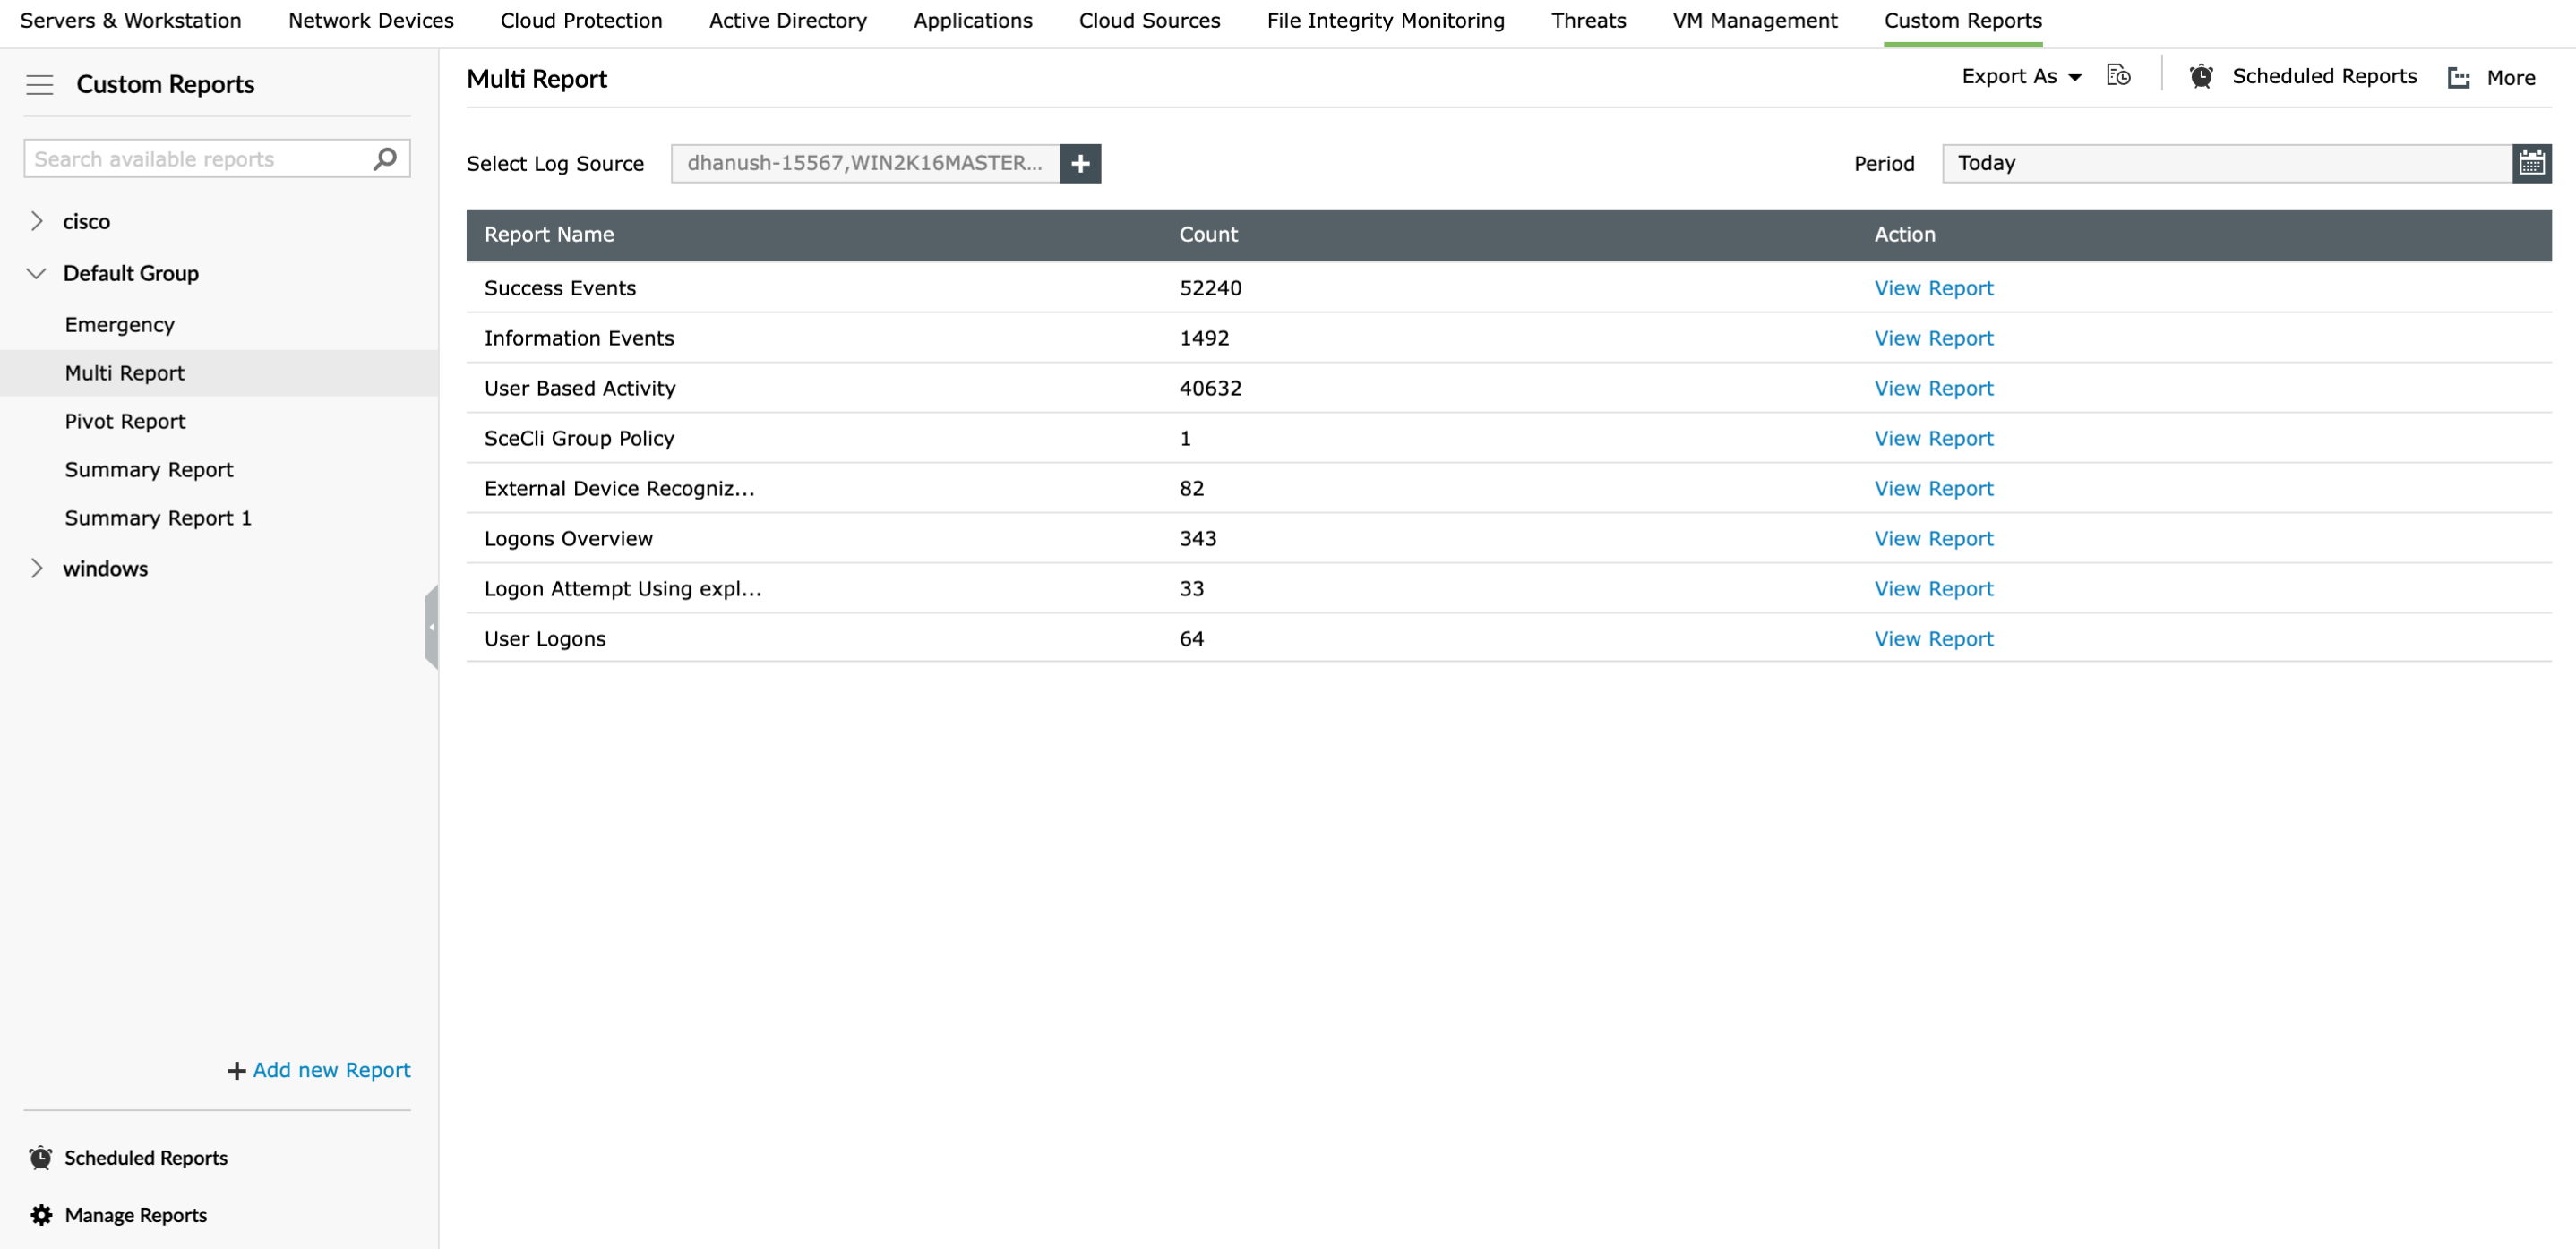
This view is useful to monitor numerous reports at one glance. It will give you a holistic view of the reports that you have added to the multi report view. In this view, each report has a View Report button that navigates to the original report.
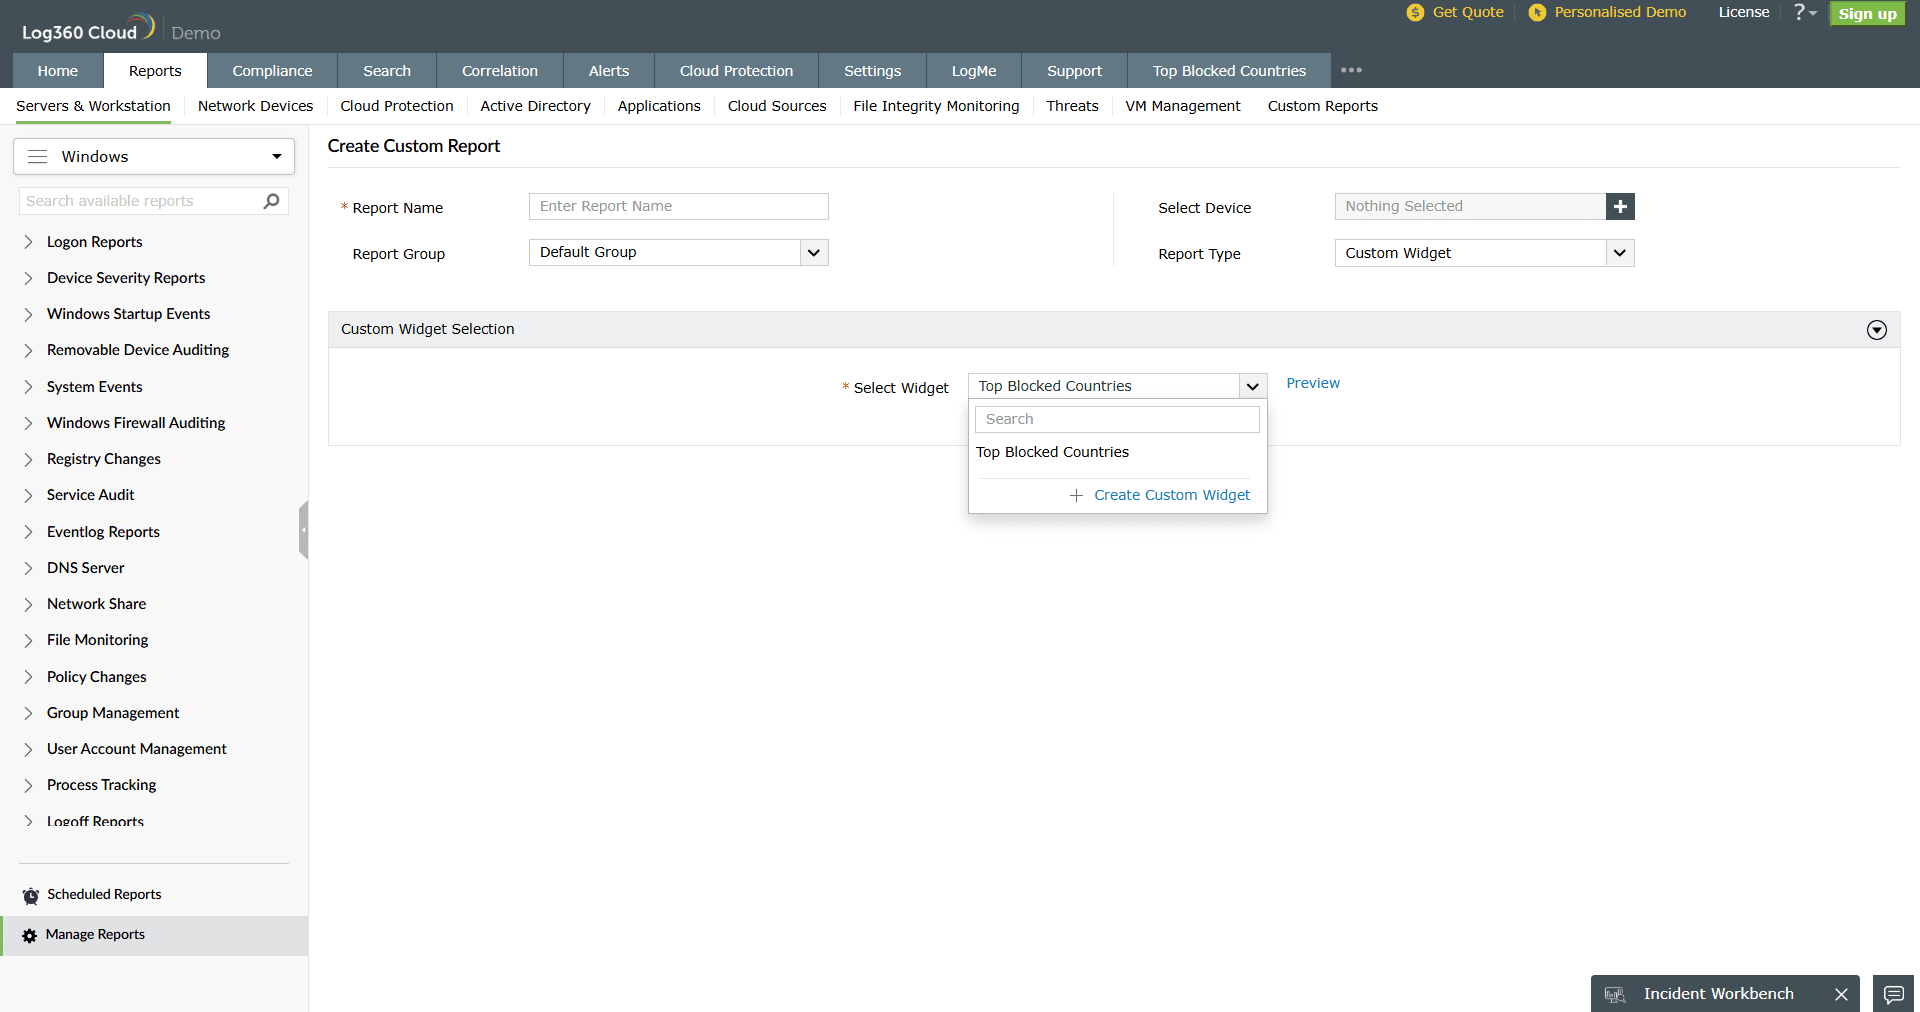
You can create a Custom Report based on the available custom widgets or create a custom widget and use it.