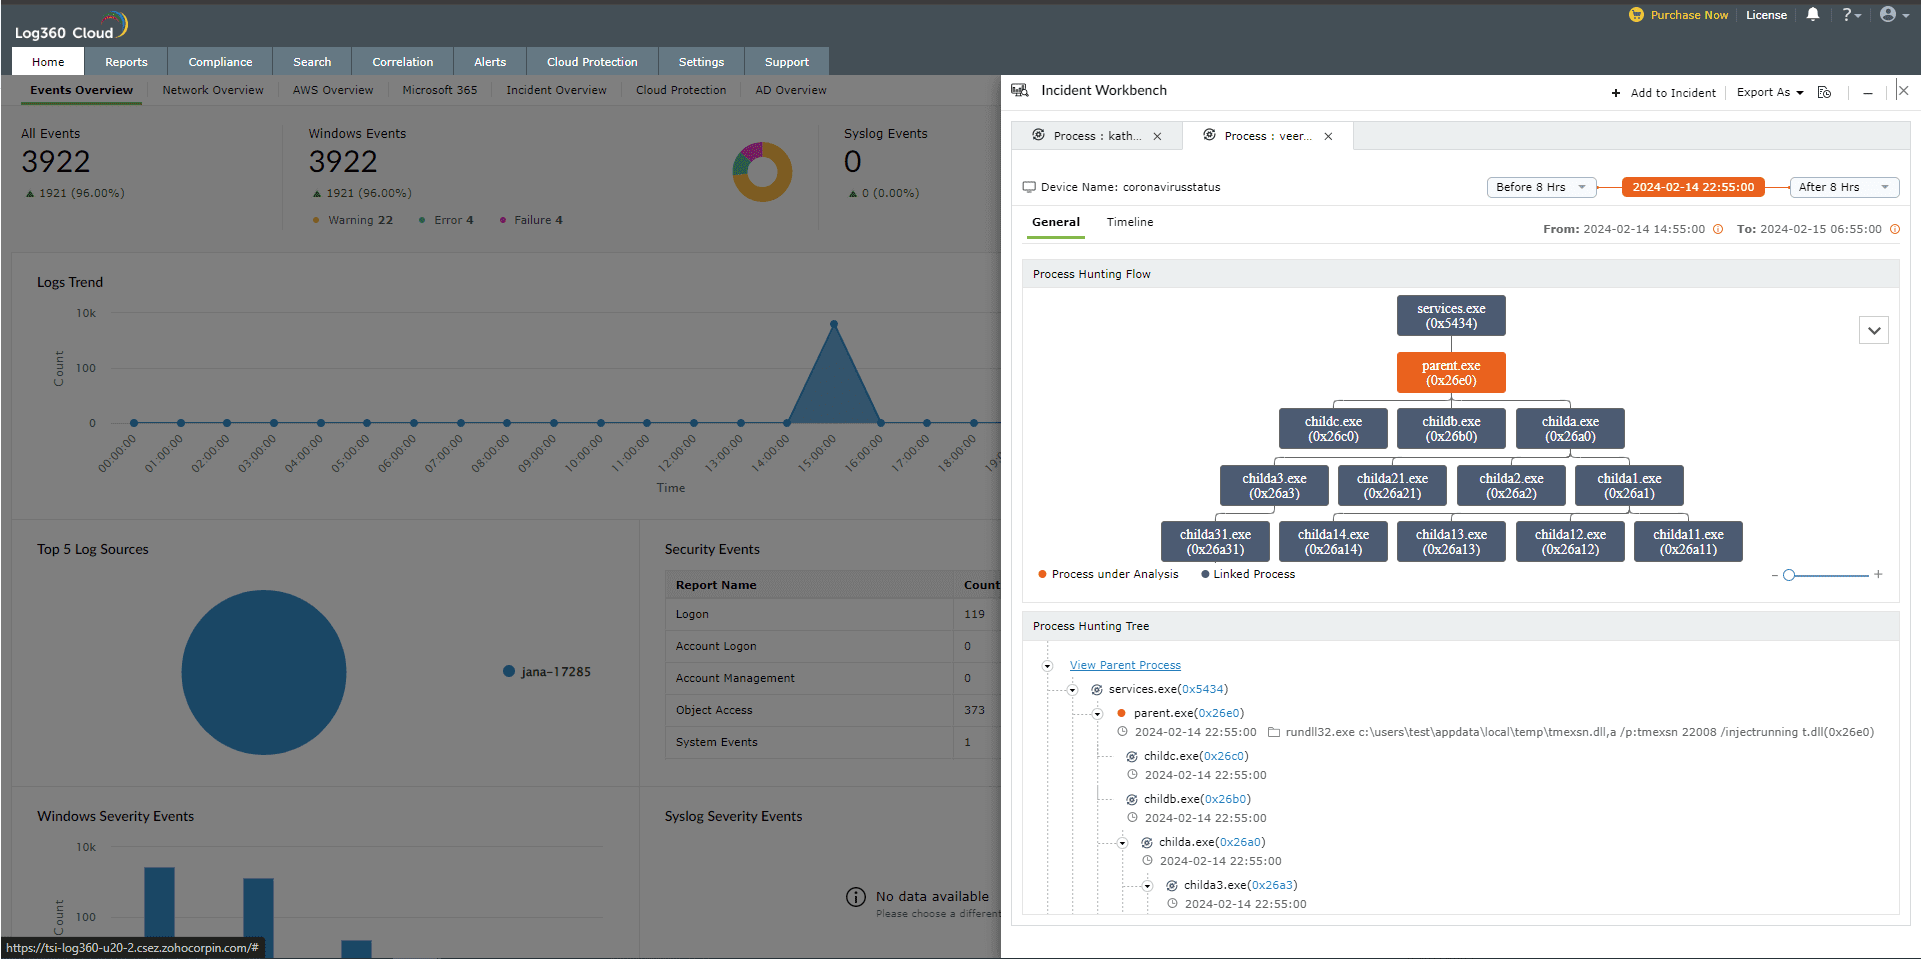
Process Analytics in Incident Workbench
The Process Analytics section of the Incident Workbench showcases process spawning with the parent child relationships and the process event details.
Note:
- Please refer to the Incident Workbench Overview page to learn about the feature, and check the Access page to learn how to invoke Incident Workbench from different dashboards of Log360 Cloud.
- To access the process hunting tree, you can click on any of the following fields that uniquely identify a process:
- Process Id
- Parent Process ID
- Process GUID
- Parent Process GUID
- Process Name
- Parent Process Name
- The process spawning will be available in graphical format for upto 50 child processes.
Process analytics views
Here are the different graphical formats available in the Incident workbench to analyze process flow:
- Hierarchical tree with respective parent and children of the process
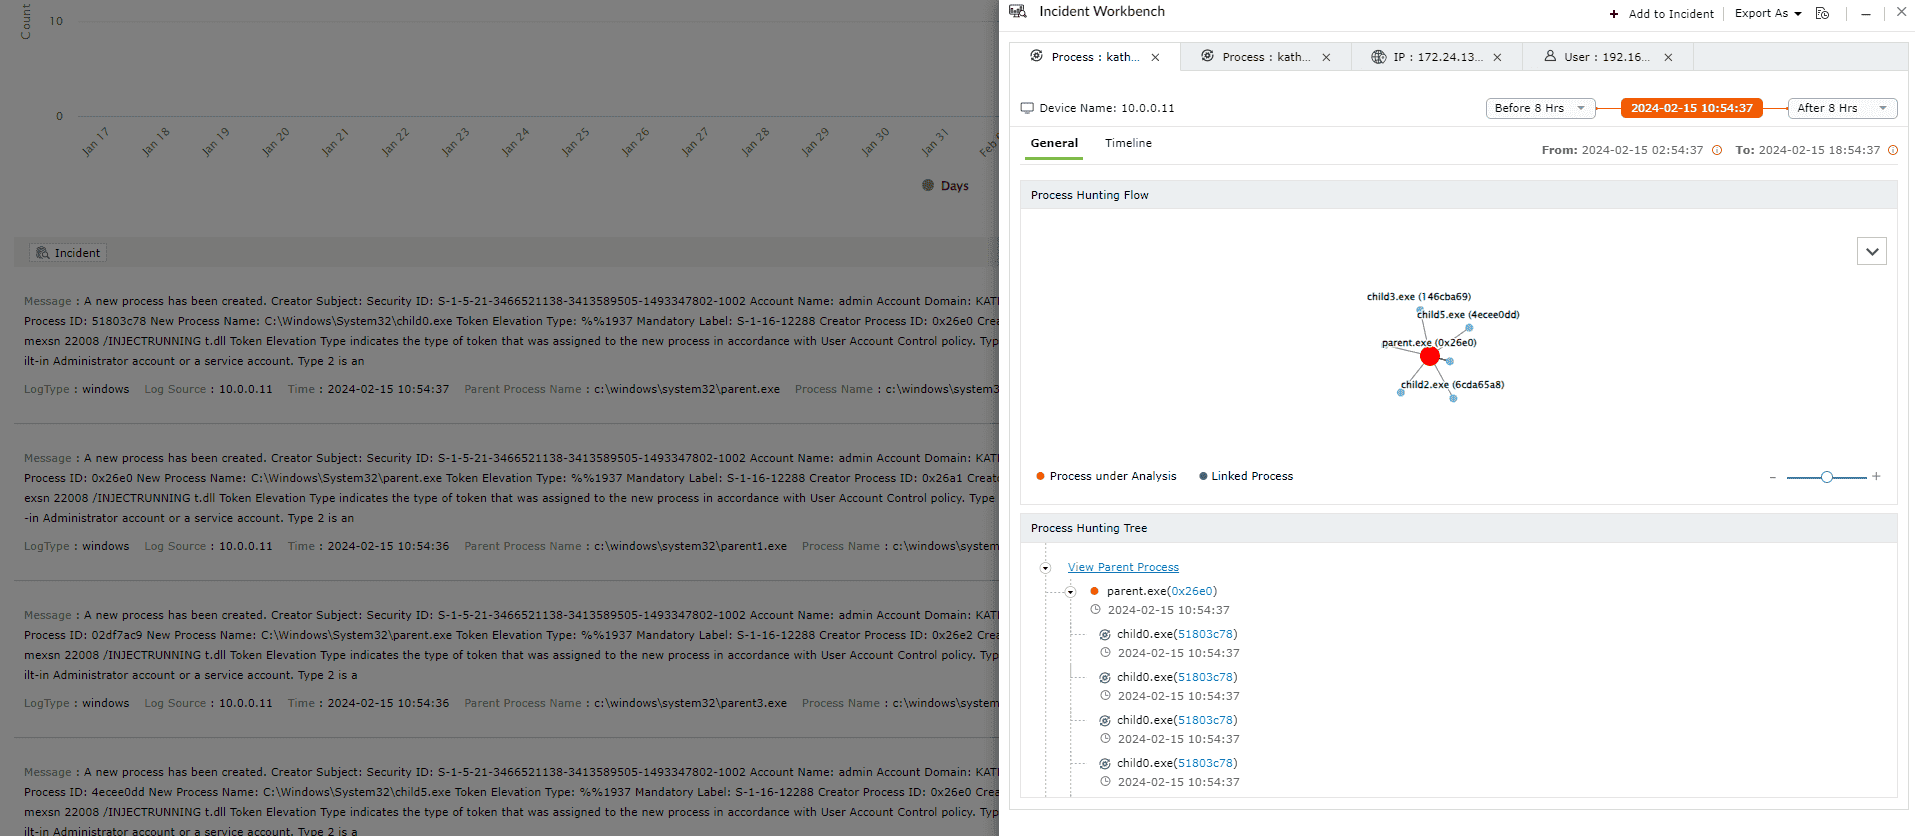
- Process cluster view
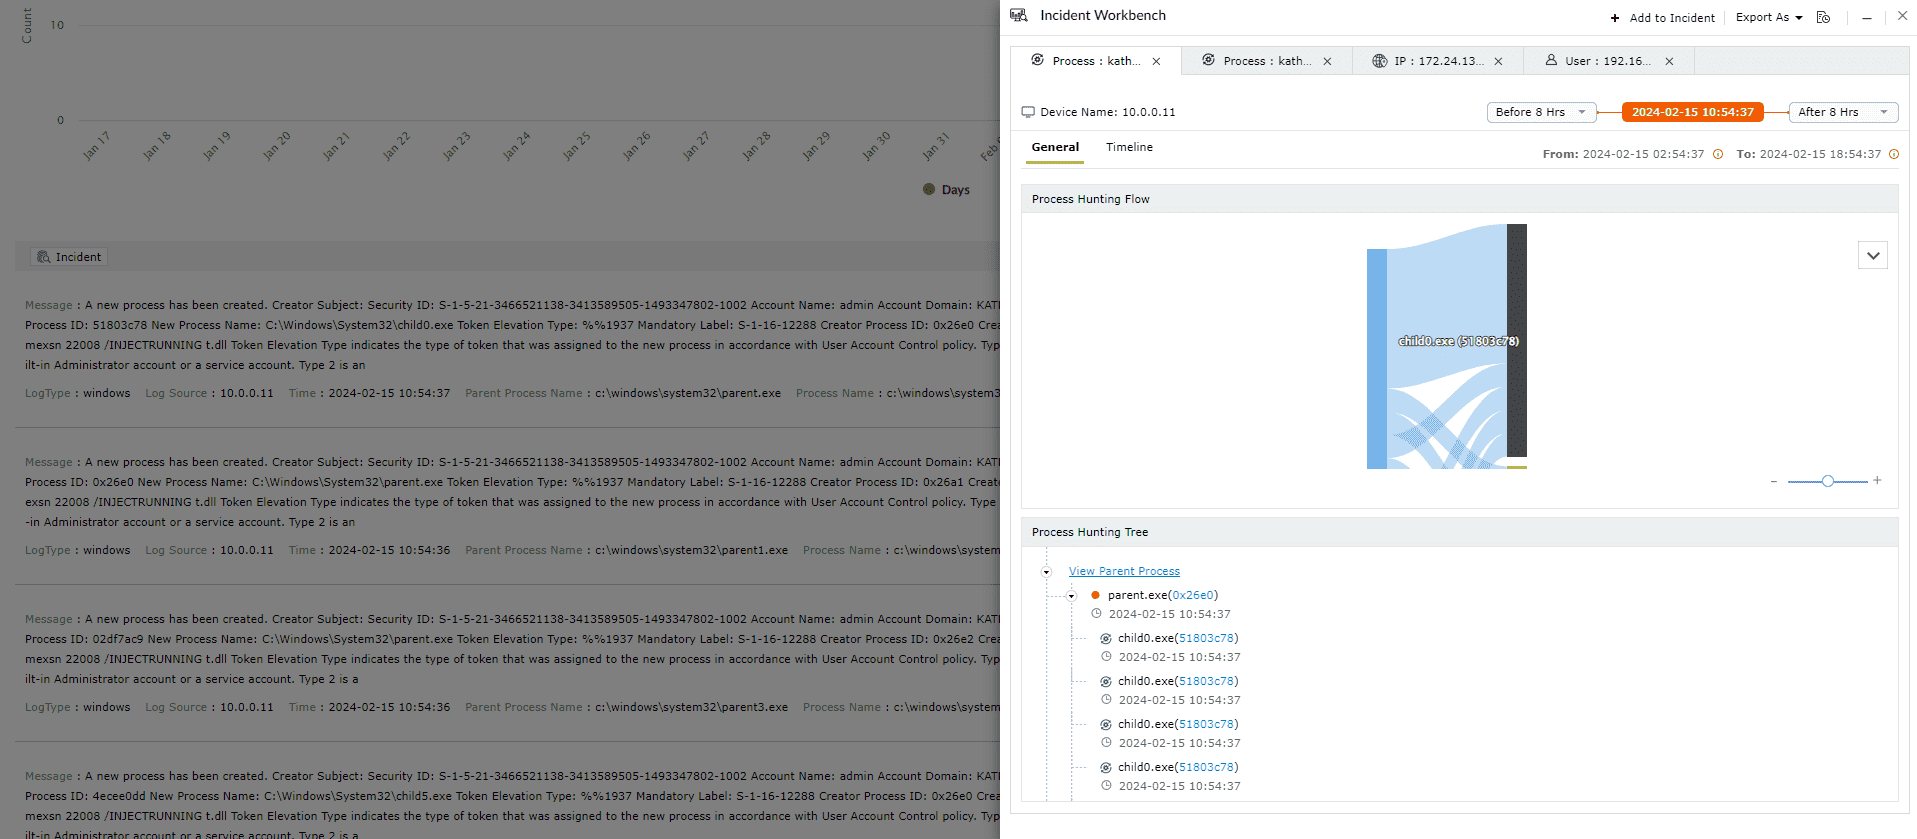
- Sankey Chart view with the process flow
The process analytics tab explained.
Process Analytics - Elements
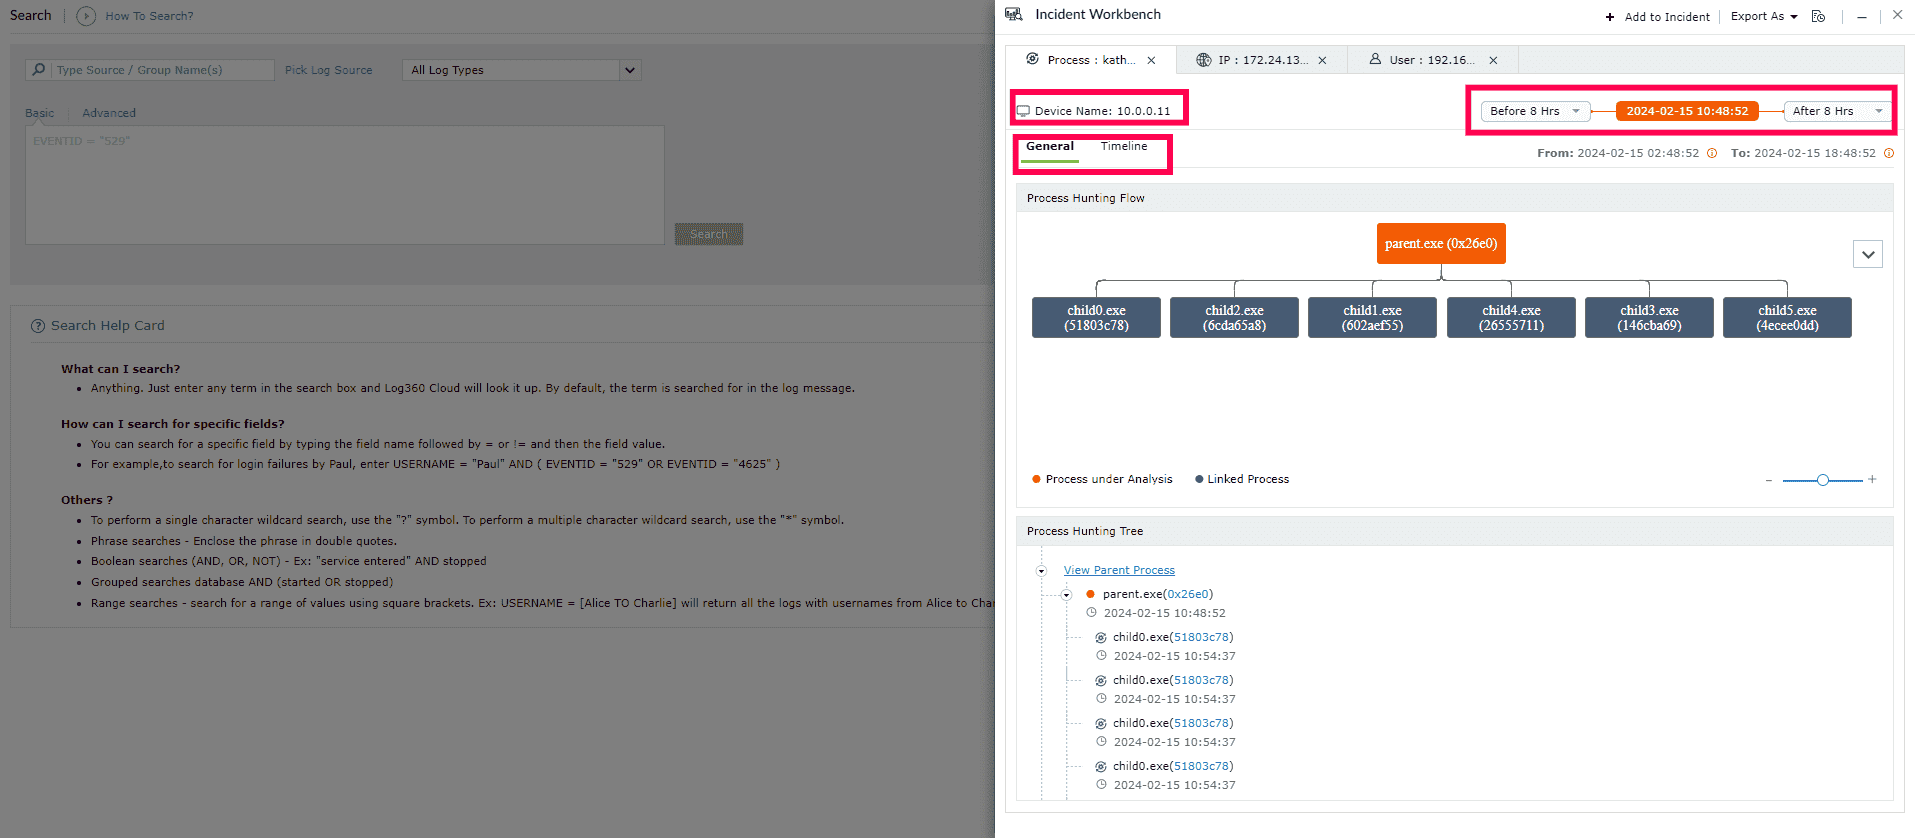
- Device Name: The device in which the process is active for the selected period.
- Timeline adjuster: Use the timeline adjuster in the top right corner to view the process activities upto 8 hours prior to and after the selected event.
- Views: Alternate between the General view and Timeline view. The General view has the graphical presentation of the process flow, and the Timeline view has the process history with list of events.
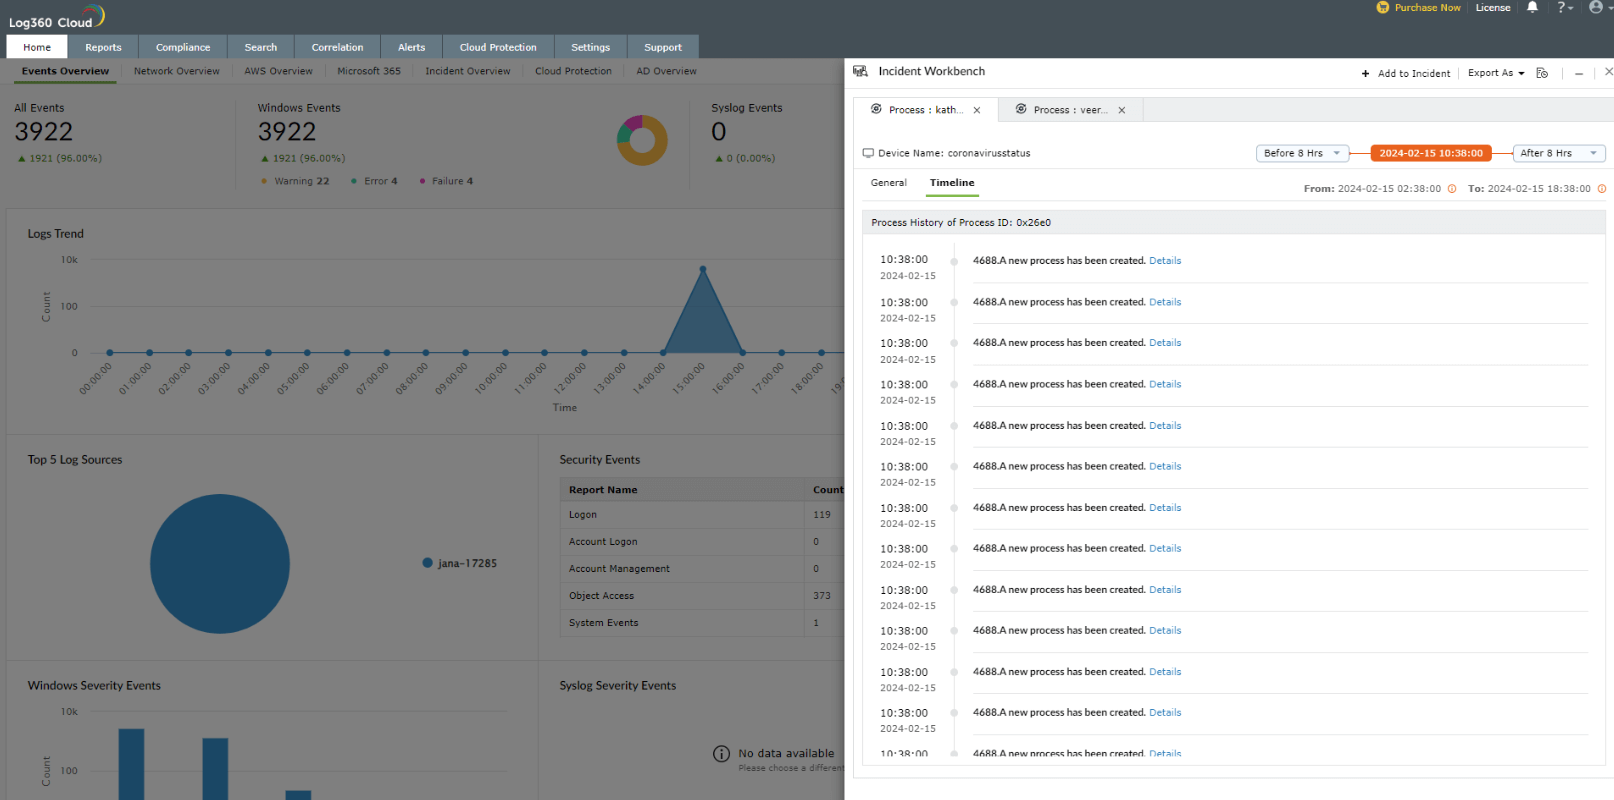
- Highlighted process: The Process being analyzed currently will be highlighted in orange and the rest of the linked processes will be in a different color.
- Graphical formats: Select the dropdown button next to the process tree to alternate between different graphical formats
Note: Minimize the tab to access the Incident Workbench while you traverse through different pages in Log360 Cloud. As long as you don't close the workbench, the analysis will be available even if you log out of Log360 Cloud and login again. You can also
save it to an existing incident or create a new one.