Frontend vs backend monitoring: What to track, why it matters, and how to fix it
Users don't care where your app broke—they just know it didn't work. The problem could be a sluggish React app or a failing API but all they care about would be that the task they were trying to complete didn't work. Good website monitoring must connect the dots, measuring the user experience in the browser and the health of the services behind it. True reliability requires monitoring that colligates the user's experience in the browser, which is the Frontend stage with the health of your services, which is the Backend orchestra.
This comprehensive guide details what signals to track on both the frontend and backend, why this split is essential, and provides concrete steps for instrumentation and incident response.
Why split monitoring: The stage vs. the orchestra
Imagine your application as a theatrical production. The Frontend is the stage, actors, and lights with the visible elements like page loads, animations, and the JavaScript running in the user's browser. The Backend is the orchestra which encompasses the unseen but critical infrastructure of APIs, databases, caches, and queues.
If either part fails, the show i.e app or site suffers. However, the symptoms are different, requiring distinct monitoring strategies to diagnose problems quickly:
- Frontend monitoring measures what the user sees and feels (e.g., page speed, UI breakage, third-party impact).
- Backend monitoring measures service health, correctness, and capacity (e.g., API latency, server error rates, resource usage).
What is frontend monitoring?
Frontend monitoring measures performance where it counts: on the user's screen. It actively tracks how the website or application behaves for real visitors, passively recording everything from initial content rendering to the responsiveness of dynamic interactions, giving you a complete picture of the live user experience.
What is backend monitoring?
Backend monitoring, in contrast, is dedicated to the server-side infrastructure that drives the application. It actively tracks the performance of critical components like HTTP servers, databases, middleware, and external APIs, often using synthetic tests to validate infrastructure health and prevent issues from ever reaching the user.
Front end monitoring: Real user monitoring & URL monitoring
Frontend monitoring encompasses two major approaches: Real User Monitoring (RUM) and synthetic monitoring, each providing vital insights into website user experience and technical health.
Synthetic URL monitoring
SyntheticURL monitoring is a synthetic technique that actively tests website endpoints (URLs) via automated scripts or bots, often from multiple locations. It measures uptime, availability, HTTP response codes, and response times by simulating requests at regular intervals. This process, also known as synthetic transaction monitoring, helps proactively detect outages or abnormal response times and is used to verify that web services are reachable and performing within acceptable thresholds—regardless of user activity.
Real user monitoring
Real user monitoring(RUM) passively collects performance data directly from users' interactions with the website. It tracks metrics like response times, error rates, and throughput across diverse geographies, ISPs, devices, and user transactions, delivering visibility into how real visitors experience the site under genuine conditions. Unlike synthetic testing, RUM uncovers issues that surface with actual device/network/browser combinations, allowing identification of region-specific slowdowns, ISP-related outages, and device/browser bottlenecks. This data is invaluable for understanding the true impact of performance optimizations.
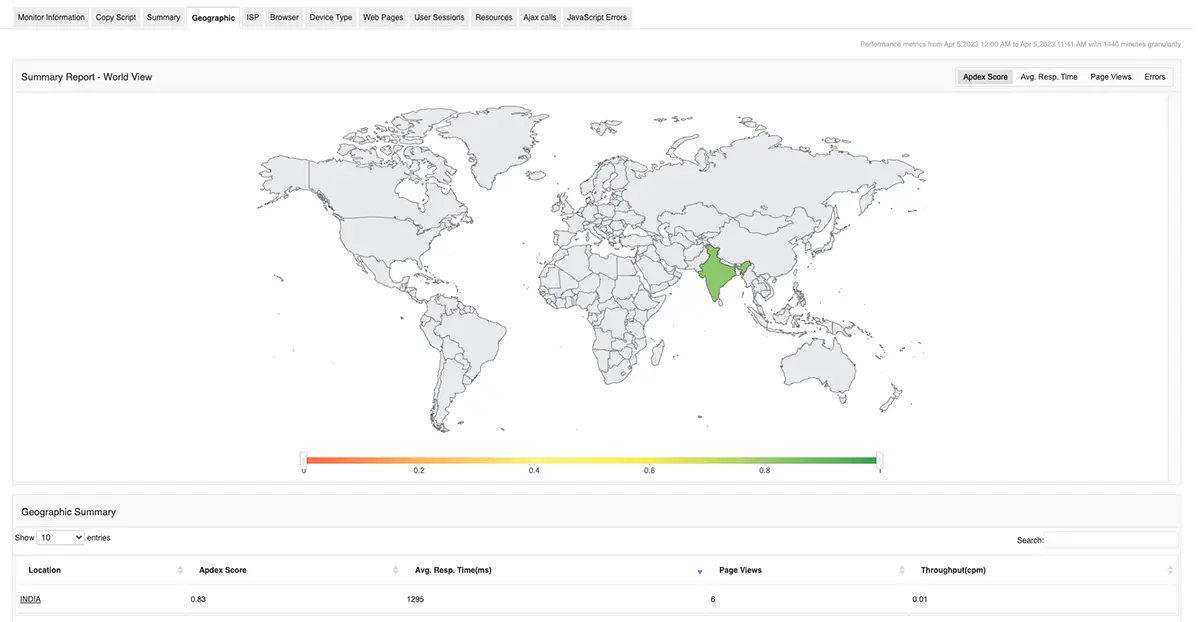
Real user monitoring: Geographic response time variations
Geographic location significantly impacts website performance, creating substantial variations in response times across different regions. RUM data reveals that users in different geographic locations can experience dramatically different performance characteristics.
Real life use cases of regional performance disparities
Analysis of ISP performance data shows considerable geographic variations in network latency. For instance, in major American cities, median download latency varies substantially, with some locations experiencing response times over 200ms while others maintain sub-30ms performance. Washington DC consistently shows challenging network conditions with higher latency figures, while cities like San Francisco and Dallas demonstrate superior infrastructure performance with lower response times.
European markets display similar geographic variations. Germany generally offers comparable service levels across regions with minimal differences, while the United Kingdom shows more varied performance with British Telecom exhibiting higher latencies compared to competitors like Sky, Virgin, and Vodafone. France demonstrates balanced competition between providers, and Spain shows significant variation with Orange delivering the best performance compared to Telefonica's higher latency challenges.
Geographic monitoring best practices
Effective geographic monitoring requires strategically positioned monitoring points to capture regional performance variations. Organizations benefit from deploying monitoring agents across multiple global locations to understand how users in different regions experience their services. This approach helps identify:
- Regional bottlenecks that affect specific user populations.
- CDN effectiveness across different geographic markets.
- Network routing inefficiencies between regions.
- Time-zone based performance patterns.
ISP performance impact on response times
Internet Service Provider selection dramatically influences website response times, creating another layer of performance variation that RUM effectively captures.
Real life use cases of ISP performance characteristics
Different ISP technologies exhibit distinct performance profiles. Wired ISPs generally demonstrate superior consistency compared to wireless providers. For example, according to this report, Comcast shows exceptional stability across multiple cities, maintaining median latency between 27ms in Dallas to 41ms in Washington DC. Verizon FIOS demonstrates similar reliability with median latencies confined to 23-30ms across service regions.
Real user monitor helps understand which ISP is increasing the latency or degrading the performance of your web application, when a user is facing an issue.
Device-specific performance monitoring
Device diversity creates substantial performance variations that RUM captures effectively. Modern websites must deliver consistent experiences across multiple device categories, screen sizes, and processing capabilities.
Mobile vs desktop performance
Mobile devices face unique performance challenges including limited processing power, variable network connectivity, and battery optimization requirements. Mobile network monitoring reveals significant performance gaps compared to desktop experiences, particularly when accessing services over 3G, 4G, and 5G networks.

Performance testing across real devices shows substantial variations in load times and interaction responsiveness. Desktop browsers typically deliver faster JavaScript execution and rendering compared to mobile browsers, while tablet devices fall somewhere between these extremes.
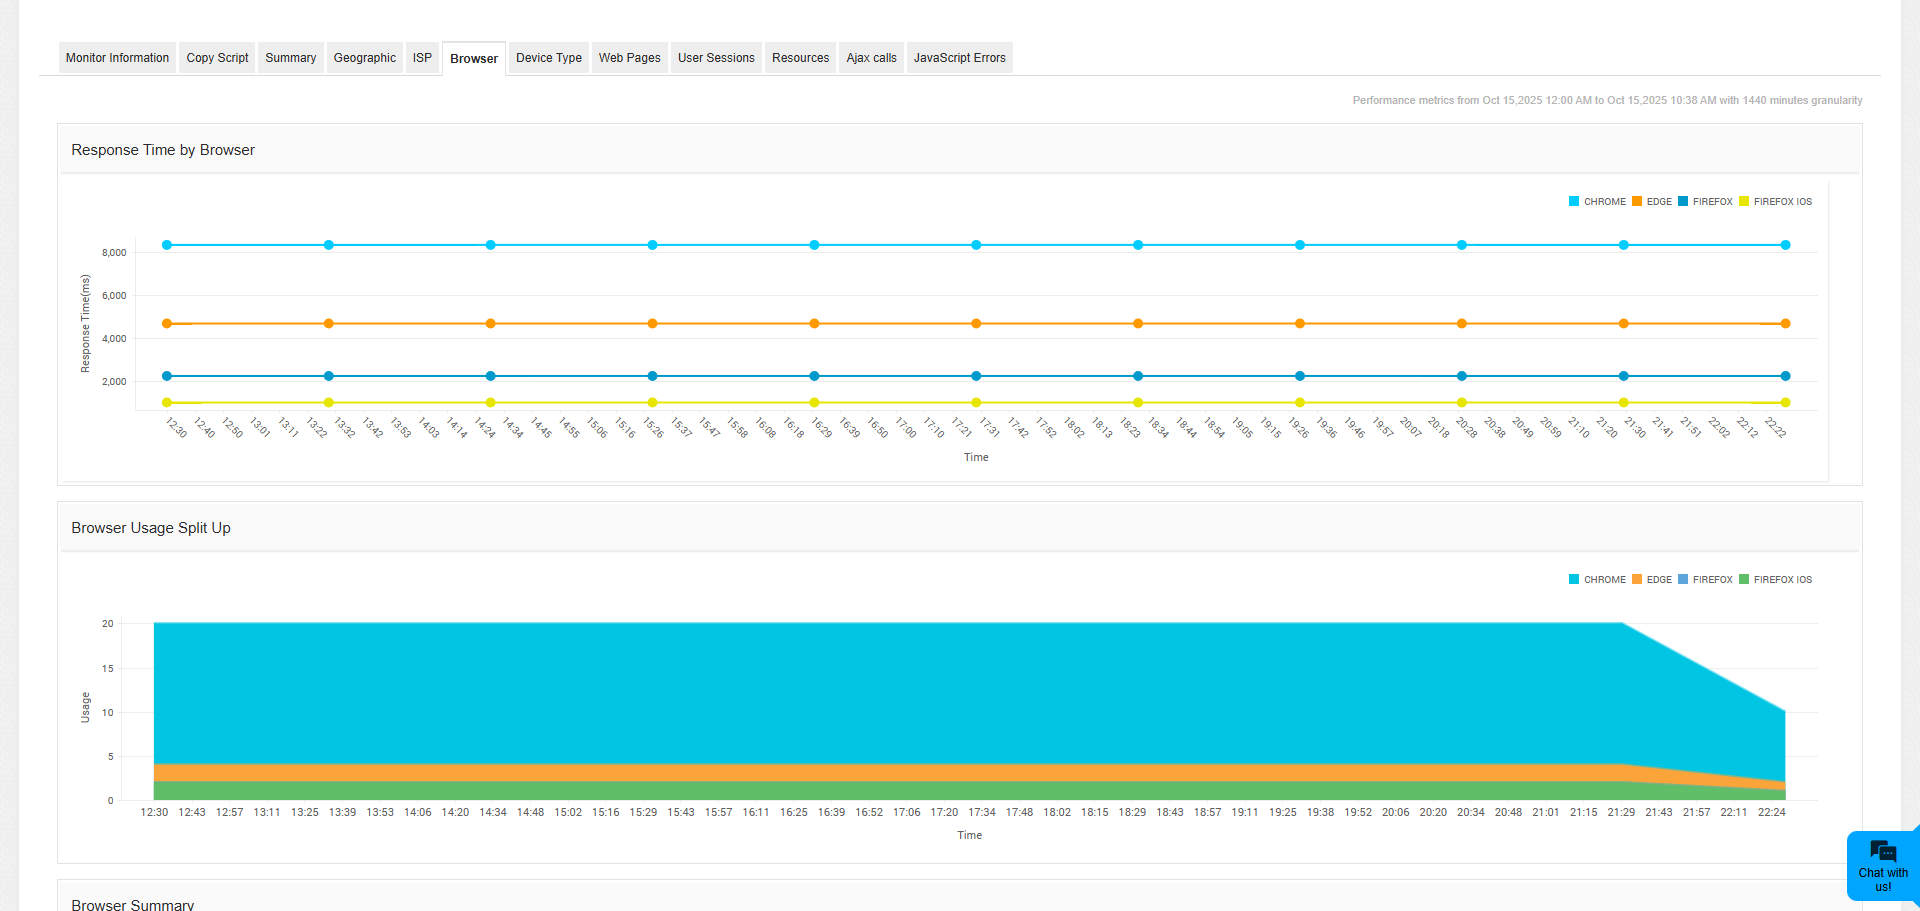
Cross-browser performance variations
Different browsers exhibit distinct performance characteristics when accessing the same website. Browser-specific monitoring reveals how Chrome, Firefox, Safari, and Edge handle resource loading, JavaScript execution, and rendering differently. These variations become particularly pronounced with complex web applications that rely heavily on client-side processing.
Transaction performance monitoring
Transaction monitoring provides granular insight into specific user workflows and business-critical processes. Unlike simple page load monitoring, transaction monitoring evaluates complete user journeys including multi-step processes like registration, checkout, and form submissions.
Real life use cases of frontend monitoring (Transactions in RUM)
E-commerce transaction analysis
E-commerce platforms benefit significantly from transaction monitoring as it tracks the entire customer journey from product browsing to purchase completion. This monitoring approach identifies bottlenecks in shopping cart functionality, payment processing delays, and inventory system responsiveness.
Transaction monitoring reveals how different components of complex workflows perform under various conditions. For instance, during peak shopping periods, payment gateway response times may increase while product catalog browsing remains stable. This granular visibility enables targeted optimizations.
SaaS application monitoring
Software-as-a-Service applications require sophisticated transaction monitoring to ensure complex user workflows function correctly. Multi-step transactions like user onboarding, data import processes, and report generation require monitoring that extends beyond simple availability checks.
SaaS transaction monitoring evaluates not just whether features work, but how quickly they respond under different load conditions and user scenarios. This includes monitoring API response times, database query performance, and third-party service integrations that contribute to overall transaction completion times.
Backend monitoring: The fusion of infrastructure and APM
Backend monitoring is the deep-dive into your application's engine room, focusing on server-side performance metrics that, when neglected, directly degrade the frontend user experience. It's a comprehensive strategy that fuses traditional Infrastructure Monitoring with specialized Application Performance Monitoring (APM) tools to provide complete visibility.
The scope of backend monitoring
Backend monitoring encompasses every component responsible for processing a user request. This includes measuring server response times across multiple interconnected layers: the web server (handling initial connections), the application server (executing business logic), databases (managing data retrieval), and various supporting services (caches, message queues, and external APIs).
The goal is to proactively ensure stability and efficiency across the entire server stack.
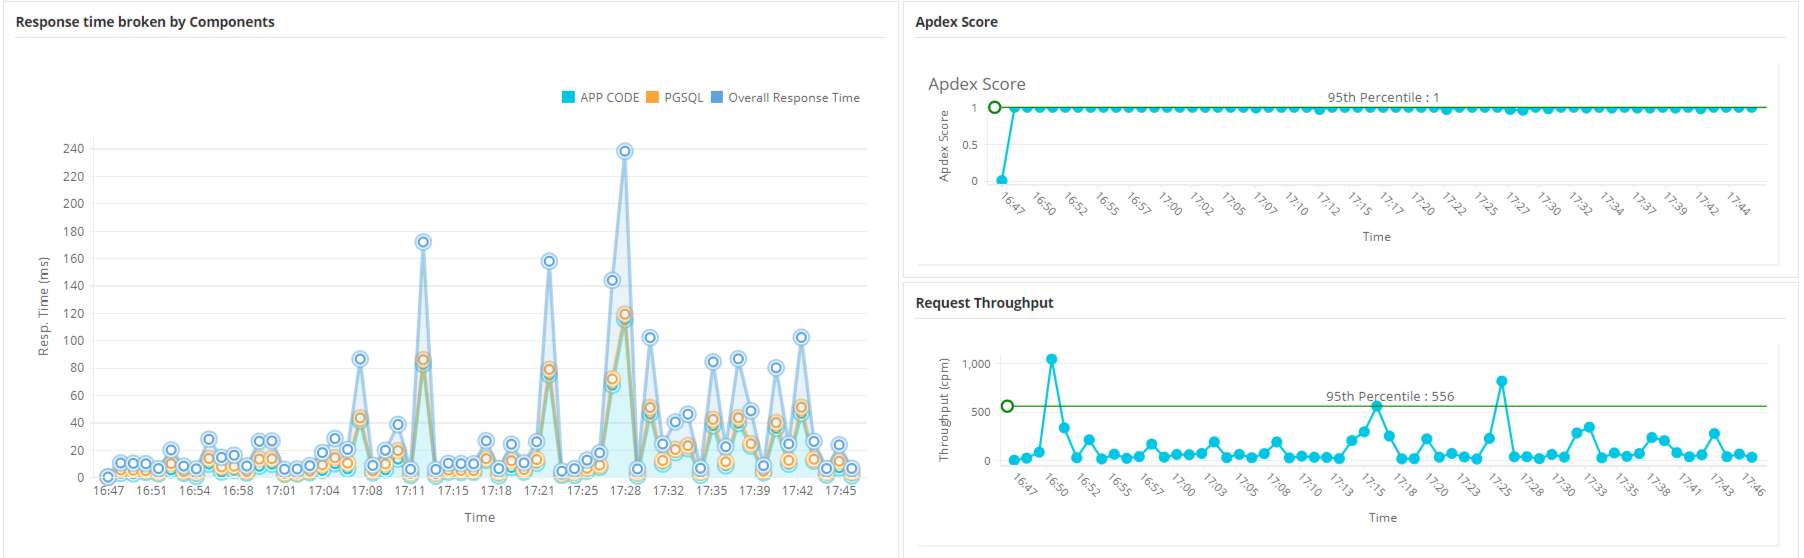
Critical application performance metrics (APM)
APM tools, such as Applications Manager (or similar products like Dynatrace, New Relic, etc.), are essential for generating and visualizing metrics that indicate the health and efficiency of your application code and architecture. Key indicators tracked include:
| Metric | Purpose and Impact |
|---|
| Requests per Second (Throughput) | Measures server load and capacity utilization. High throughput combined with rising latency indicates a scaling bottleneck. |
| Average Response Time | Indicates the overall efficiency and speed of your application's service layer. Crucial for setting and maintaining Service Level Objectives (SLOs). |
| Peak Response Time (p95, p99 Latency) | Identifies performance bottlenecks and extreme delays affecting a small but critical percentage of users. These outliers often reveal resource contention or intermittent failures. |
| Error Rates (5xx Responses) | Tracks the frequency of server-side errors, providing an immediate gauge of application stability and correctness. |
| Database Query Performance | Monitors data retrieval efficiency, identifying slow queries or high transaction volumes that place excessive load on the database server. |
Deep-dive infrastructure monitoring components
Infrastructure monitoring focuses on the underlying physical or virtual resources hosting your application. Comprehensive backend monitoring requires simultaneous evaluation of these critical layers:
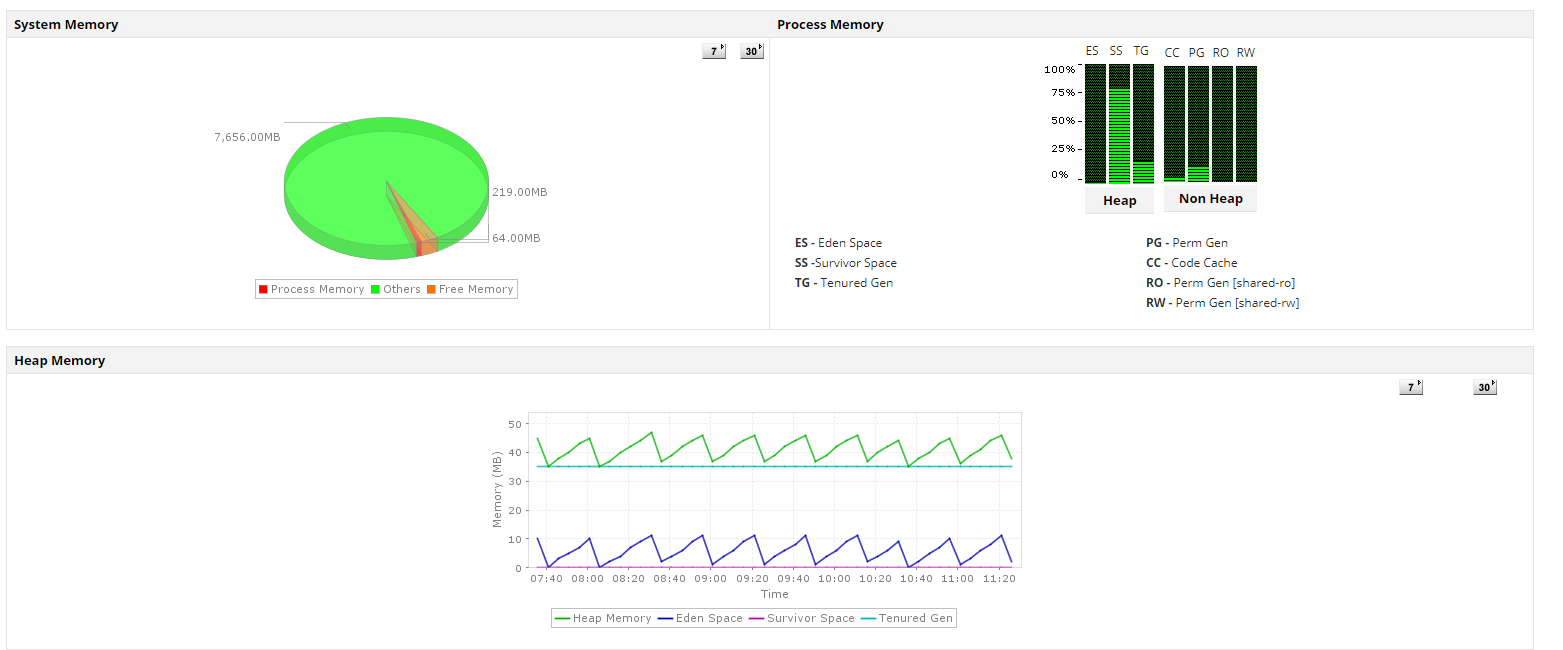
- CPU and memory usage monitoring: Tracks resource consumption patterns. High CPU utilization often signals processing bottlenecks that slow down server performance, while low available memory can lead to swapping and catastrophic performance degradation.
- Disk I/O monitoring: Measures the read/write speed of storage. Poor Disk I/O directly impacts response times, especially for data-intensive applications or those relying on persistent logging.
- Network monitoring: Evaluates connectivity, latency, and packet loss between your application's various components (e.g., app server to database, or service-to-service communication). Network bottlenecks can often be mistaken for application code issues.
The role of APM tools (Like ManageEngine Applications Manager)
Modern APM tools centralize this data, moving beyond simple infrastructure checks. They provide capabilities like Distributed Tracing, which can be defined as stitching requests across microservices and Code-Level Diagnostics, which can be defined as identifying the specific line of code or database call responsible for a delay.
By integrating these tools, organizations gain multi-layered visibility into backend performance factors. This capability is paramount, as it allows engineers to quickly pinpoint the root cause of a slowdown—whether it's code inefficiency, an overloaded database, or resource contention—ensuring that the problem is resolved before the backend failure translates into a broken or slow frontend user experience.
Monitoring implementation strategies for maximum value
Effective website monitoring requires strategic implementation that combines both frontend and backend approaches while accounting for geographic, device, and network variations.
Comprehensive monitoring architecture
Successful monitoring implementations utilize multiple monitoring types working in concert. Synthetic monitoring provides controlled baseline testing, while RUM captures actual user experiences across diverse conditions.
This combination ensures both proactive issue detection and accurate, reactive user experience optimization. To achieve full visibility, the architecture must include:
- Geographically distributed monitoring points to check global reach.
- Device-specific scenarios to test mobile vs. desktop performance.
- Transaction-focused monitoring for key business processes (like login or checkout).
Alert and response strategies
The value of monitoring hinges on turning data into action. To maximize effectiveness:
- Tailor alert thresholds: Avoid universal response time alerts. Instead, set thresholds that account for geographic and provider variations. Different user populations often require different performance standards based on their network and device capabilities.
- Prevent alert fatigue: Incorporate trend analysis into your alerting. This strategy helps distinguish between normal performance variations and genuine degradations, ensuring that real issues receive immediate attention while minimizing noise.
The strategic importance of integrated monitoring
Frontend and backend monitoring are synergistic, not competitive. While backend monitoring offers the diagnostic depth for root cause analysis and infrastructure maintenance, frontend monitoring validates that technical performance truly translates into a positive user experience. By strategically integrating both approaches, organizations ensure that infrastructure health directly yields measurable benefits for their users, a necessity given the complexity of modern web environments. This comprehensive strategy delivers consistent, high-quality digital experiences regardless of user environment.
ManageEngine Applications Manager: Bridging frontend experience and backend health
ManageEngine Applications Manager serves as a unified platform that strategically combines Frontend Monitoring and Backend Monitoring capabilities to deliver comprehensive full-stack visibility. Its core value lies in its ability to correlate user-facing issues with specific server-side root causes, significantly reducing the time spent diagnosing performance bottlenecks.
1. Frontend monitoring: Capturing the user experience (EUEM)
Applications Manager's end-user experience monitoring (EUM) features are dedicated to capturing the reality of performance as experienced by the user. This ensures that slow or broken user interactions are caught even if backend services appear healthy.
| Feature | Focus | Value Proposition |
|---|
| Synthetic transaction monitoring | Proactive availability & uptime. | Simulates critical user journeys (like login, search, or checkout) by recording and replaying them from various geographically distributed locations. This proactively identifies performance degradation and functional failures before real users report them. |
| web transaction monitoring | Multi-step flow validation. | Tracks complex, multi-step business transactions. It identifies exactly where a user flow breaks or slows down, flagging slow pages or broken links within the transaction path. |
| Browser-based monitoring | Client-side metrics. | Measures true page load times, availability, and response times as experienced by the end-user's browser. |
| Third-party service impact | External dependency check. | Monitors the performance of external components like CDNs, payment gateways, and third-party APIs, which frequently introduce frontend latency outside of the main application code. |
2. Backend monitoring: Deep infrastructure and service layer visibility
The platform's strength lies in providing deep, granular visibility into the infrastructure and application components that directly support the frontend. This ensures swift detection and diagnosis of resource, database, or API bottlenecks.
- Application server monitoring: Supports a vast array of application environments, including application servers like Tomcat, WebLogic, WebSphere, JBoss, .NET, and Node.js. It provides deep insight into JVM performance, thread usage, and memory management.
- Database performance monitoring: Offers specialized monitoring for critical databases like Oracle, SQL Server, MySQL, and PostgreSQL. It tracks vital metrics such as slow queries, lock contention, connection pool saturation, and overall data retrieval efficiency.
- Middleware and integration: Tracks the health and throughput of critical integration layers, including Message Queues (MQ), Enterprise Service Buses (ESBs), and internal/external APIs.
- Infrastructure and cloud monitoring: Provides comprehensive visibility into the physical and virtual resources powering the application, monitoring CPU, memory, disk I/O, containers (Kubernetes), Virtual Machines, and public/private cloud services.
- Service health dashboards: Offers end-to-end topology maps that visually chart the dependencies between services (e.g., Web Server → Application Server → Database → External API), making complex distributed architectures manageable.
Learn more about the infrastructure elements supported by Applications Manager.
3. Full-stack correlation and root cause analysis
Applications Manager's most significant advantage is its ability to automatically correlate frontend user issues with backend performance metrics.
- Bridging the gap: If a synthetic user flow (Frontend) reports a spike in latency, the platform allows the user to immediately trace the cause to the corresponding backend metrics, such as a slow database query, a specific API bottleneck, or high application server load.
- Application topology maps: These maps are crucial for visualizing how user-facing services connect to underlying backend systems, transforming complex monitoring data into an actionable decision-making tool.
- Reducing MTTR (Mean Time to Resolution):The tool dramatically speeds up diagnosis, allowing IT teams to narrow down the root cause in minutes instead of hours.
4. Alerting, automation, and strategic reporting
To maximize monitoring value, Applications Manager includes robust features for proactive management and capacity planning:
- Proactive alerting: Implements threshold-based alerts for critical metrics like response time, error rates, and resource usage, notifying teams before performance degrades significantly.
- SLA and SLO monitoring: Tracks compliance with Service Level Agreements (SLAs), providing clear reports on performance reliability over time.
- Automated remediation: Enables the configuration of automated actions—such as restarting services, clearing caches, or running diagnostic scripts—to immediately stabilize the system upon detecting specific issues.
- Historical reports: Provides trend analysis and historical data essential for capacity planning, baseline performance comparison, and auditing the success of performance optimization efforts.
In summary, ManageEngine Applications Manager provides a unified, full-stack approach that ensures Frontend availability and responsiveness by delivering the Backend diagnostic capability needed to quickly identify and resolve any infrastructure or application service inefficiency.
Ready to gain full visibility and control?
Stop troubleshooting in the dark. Implement a unified website monitoring strategy with ManageEngine Applications Manager today to proactively manage performance, safeguard customer experience, and protect your revenue. Download now and experience the difference, or schedule a personalized demo for a guided tour.
