1. Start with the foundation: Query behavior
Every MySQL performance problem eventually reveals itself in query execution. Queries influence CPU consumption, storage access patterns, buffer utilization and lock contention. Healthy MySQL environments start by understanding how queries behave and how that behavior changes over time.
Track performance relative to baselines
Absolute query performance is rarely meaningful on its own. A query that always took 200 milliseconds may be acceptable for the business. A query that usually runs in 8 milliseconds but suddenly spikes to 120 milliseconds signals a shift that needs attention. MySQL performance monitoring becomes significantly more accurate when driven by baselines rather than static thresholds.
Related: Top 5 important MySQL metrics.
Detect execution plan drift
Execution plans change when the optimizer updates internal statistics or when the schema evolves. Even without new code deployments, MySQL may suddenly switch from using an index to scanning entire tables. Tracking plan drift helps prevent surprise slowdowns, especially in write heavy environments where index fragmentation increases over time.
Look at row examination patterns
A query that returns 60 rows but examines 3 million rows has a hidden cost. These patterns often indicate missing indexes, inaccurate optimizer estimates or suboptimal join patterns. Looking at the ratio between rows examined and rows returned provides a clear signal of inefficiency.

2. Keep your storage layer efficient
Storage is a critical part of MySQL infrastructure. Even with fully optimized queries, slow disks or overloaded IO channels can degrade performance. With InnoDB as the primary storage engine, focus on how MySQL interacts with data pages, redo logs and filesystem structures.
Prioritize InnoDB buffer pool health
The buffer pool is the heart of MySQL performance. A low hit ratio means more disk reads which increase latency. On the other hand, aggressive flushing of dirty pages suggests that MySQL is running out of memory or struggling to keep up with write operations. Monitoring hit ratios, dirty page percentages and read write patterns helps ensure predictable performance.
Monitor redo log activity
Redo logs capture all changes made to MySQL data files. If redo logs are too small, MySQL checkpoints frequently which slows down write operations. High checkpoint age or slow fsync operations indicate IO pressure that can cascade into lock waits and replication delays.
Identify abnormal IO patterns
- Unexpected table analysis jobs
- Background index creation
- Buffer pool resizing events
- Disk-based temporary table creation
Monitoring storage behavior helps detect these anomalies before they escalate.

3. Stay ahead of concurrency and connection pressure
Modern applications generate thousands of concurrent requests. If MySQL cannot handle connection surges or transactional load, the entire system becomes unstable.
Avoid aggressive connection pool sizes
Many applications default to large connection pools, believing that more connections will increase throughput. This often has the opposite effect. MySQL spends more time managing threads than executing queries. A well tuned connection limit results in better stability than an oversized connection pool.
Monitor lock waits and deadlocks
A few deadlocks are normal in transactional workloads. A sudden increase indicates deeper schema or query issues, often related to missing indexes or conflicting transaction order. High lock wait times slow down user facing queries and reduce throughput.
Related: MySQL performance bottlenecks and how to prevent them.
Track long running transactions
Long running transactions block purge operations, inflate undo logs and cause table bloat. Monitoring active transaction age helps identify queries that unintentionally hold locks or retain large versions of rows.
4. Understand replication behavior beyond replication lag
Replication helps scale read workloads and supports high availability. Although replication lag is the most visible symptom, it is often only the final output of deeper issues.
Key indicators of replication health
Comprehensive MySQL replication monitoring includes:
- IO thread and SQL thread stability
- Relay log growth rate
- Parallel worker utilization
- Network throughput during binlog streaming
Dive deeper: Monitoring MySQL replication.
Watch for replication topology drift
Replication filters, schema differences between source and replica, or misconfigured GTID settings can cause silent data divergence. These issues usually appear only when failover occurs. Monitoring replication alignment is essential for disaster recovery readiness.
5. Move from single instances to distributed clusters
As organizations scale, many migrate to distributed MySQL setups such as InnoDB Cluster, NDB Cluster or Galera based synchronous clusters. These environments require multi node observability and a deep understanding of coordination behavior.
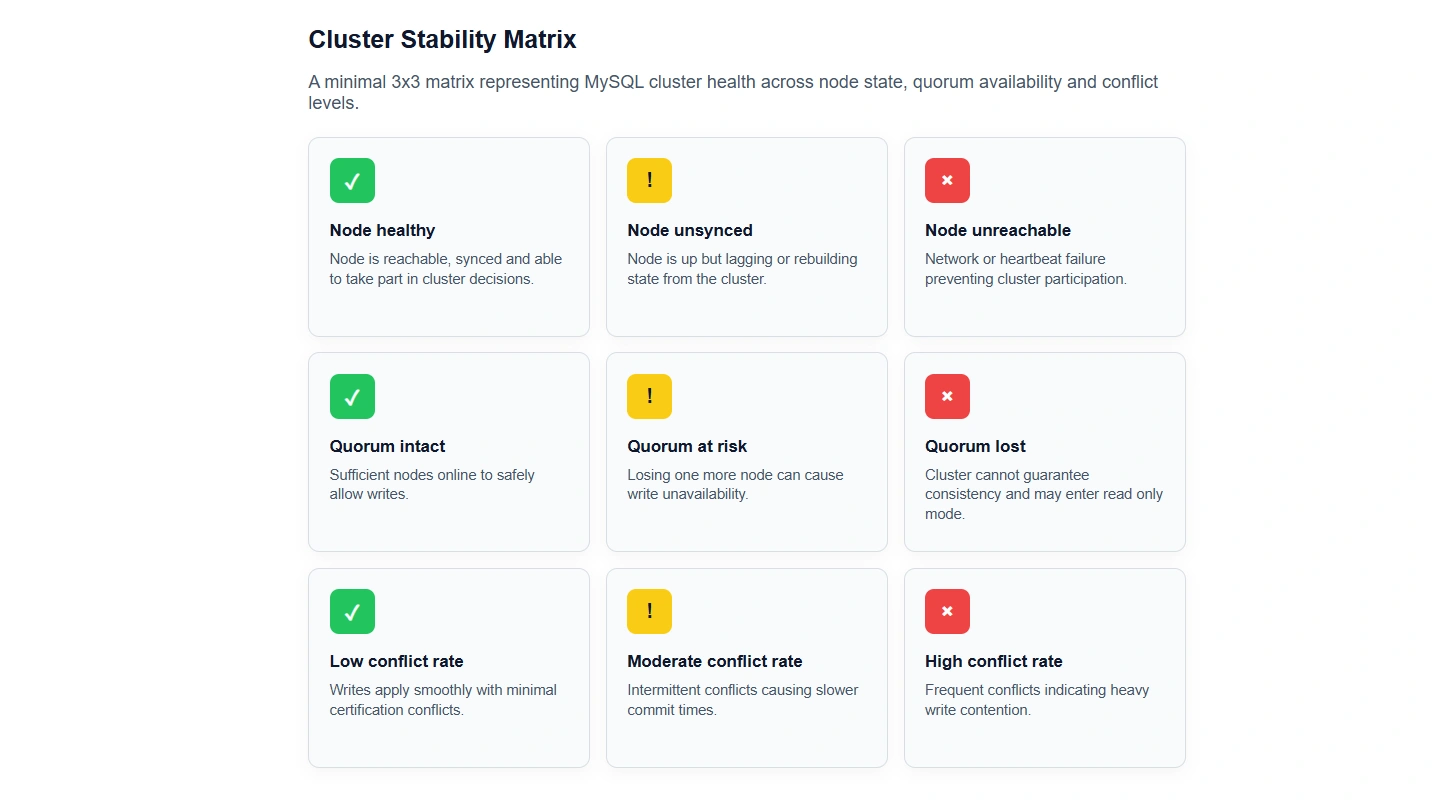
Monitor quorum and node availability
Clusters rely on voting to decide whether they can accept writes. If nodes lose contact or networks become inconsistent, the cluster can refuse writes or split into multiple independent partitions. Monitoring heartbeat consistency prevents these disruptions.
Watch conflict rates in synchronous replication
In cluster environments that use certification or conflict detection, heavy write bursts can lead to high rejection rates. A rise in conflicts indicates workloads that are too write intensive or unevenly distributed across nodes.
Related: MySQL performance bottlenecks.
Ensure balanced read distribution
If one node takes most of the read traffic, its caches warm up faster while others remain cold. This leads to uneven performance and unpredictable behavior during failovers. Monitoring per node query distribution helps keep performance consistent.

6. Manage schema changes without unexpected performance impact
Schema evolution is unavoidable. Even simple index additions can behave differently depending on workload and storage layout.
Evaluate impact before applying DDL
Online schema change tools reduce downtime but can still cause IO pressure. Monitoring how DDL operations influence lock waits, disk usage and buffer pool churn helps minimize impact on users.
Track index growth and fragmentation
Index size increases faster than many administrators expect. A sudden increase often indicates fragmentation or skewed inserts. Monitoring index size helps maintain predictable query performance.
Monitor metadata lock queues
Metadata locks protect schema integrity but can block critical queries if they accumulate. Monitoring metadata lock wait times during DDL ensures applications remain responsive.
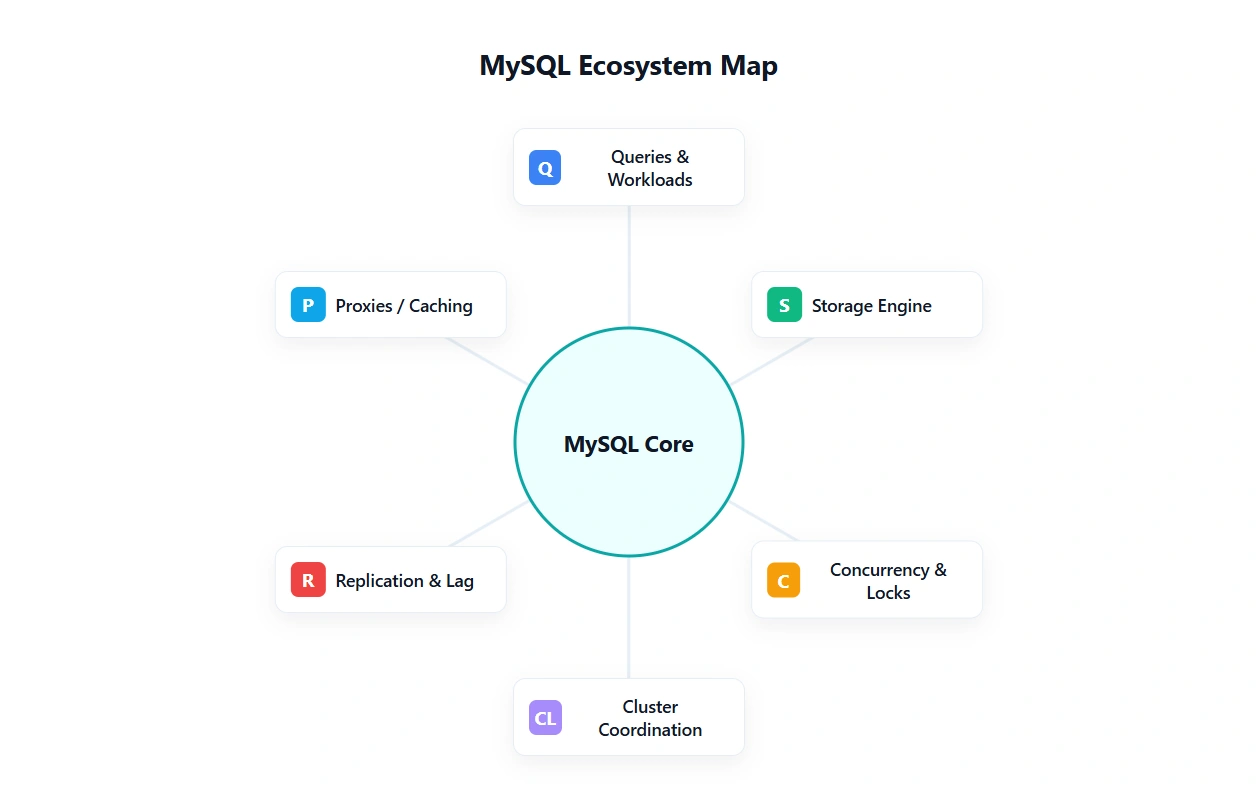
7. Keep the MySQL ecosystem organized as environments scale
Modern MySQL environments contain many layers beyond the database engine itself. Routers, proxies, caches and backup layers, all of which influence query performance.
Monitor routers and proxies
Components like MySQL Router, ProxySQL and HAProxy manage routing, connectivity and failovers. Issues in these components often appear as intermittent query failures. Monitoring them ensures smooth traffic flow.
Track backup and restore cycles
Backups can create heavy read surges. Monitoring backup duration, throughput and their effect on the buffer pool helps plan safer backup windows.
Monitor cache layers
Redis, Memcached and application level caches reduce pressure on MySQL. Monitoring cache hit ratios ensures MySQL receives only necessary queries.

Getting started? See What is MySQL monitoring?
MySQL monitoring with Applications Manager
Applications Manager provides end-to-end visibility across MySQL queries, storage, concurrency, replication and cluster layers, enabling teams to catch issues early.
Unified metric coverage
Track query performance, buffer pool health, lock behavior, transaction age, redo log activity, replication threads, failover readiness and cluster all in one place.
Alerts, baselines and dashboards
Applications Manager offers baselines, anomaly detection, configurable alerts and real-time dashboards to ensure predictable MySQL performance at any scale.
Explore now by downloading a free, 30-day, trial of Applications Manager now!


