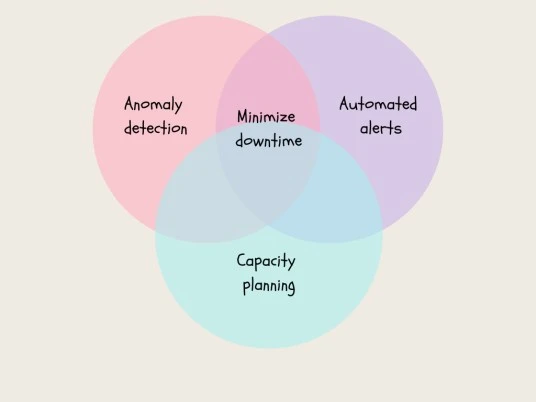
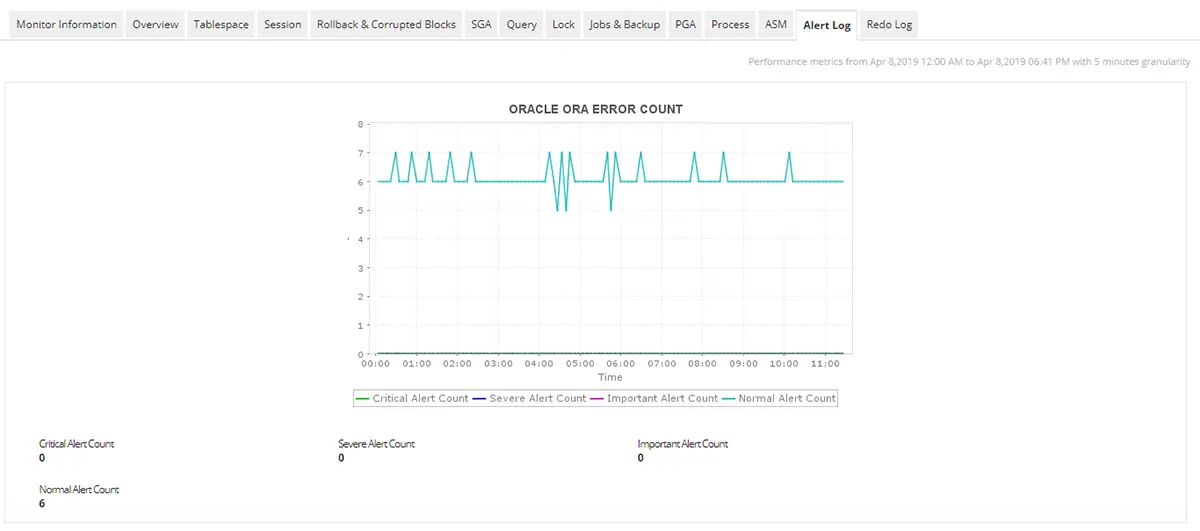
Tools that support this approach provide automated behavioral baselines, anomaly detection, historical trend insights, and correlated diagnostics, highlighting issues far earlier than simple threshold based alerts.
This article explores proven techniques for proactive Oracle monitoring and demonstrates how a specialized tool helps DBAs convert raw metrics into actionable, predictive intelligence.
Why predictive monitoring is essential
Traditional Oracle monitoring relies heavily on static thresholds. While these alerts are necessary, they typically signal trouble only after performance degradation has already started.
Consider these common scenarios:
- A tablespace alert fires only when free space crosses a critical limit, not when the growth rate accelerates unusually.
- CPU alerts trigger after the system is already saturated, even though the root cause may have been a gradually expanding, costly workload.
- A sudden spike in hard parses appears as a high count alert, not as a long term, worrying pattern in shared pool consumption.
Proactive monitoring shifts focus to detecting early deviations from normal system behavior. This allows DBAs to identify the root cause long before it can result in a database disruption.

1. Establishing baselines and behavioral patterns
The core principle of predictive monitoring is accurately understanding what normal looks like for your specific Oracle database environment.
- Instance availability trends: Repeated transitions to MOUNT or RESTRICTED mode may indicate underlying resource pressure or an unstable configuration.
- Tablespace and temp usage patterns: Analyzing growth trends reveals exactly when capacity will run out, allowing you to prevent unexpected ORA errors.
- SGA and PGA consumption curves: Tracking shared pool usage, buffer cache efficiency, and PGA patterns highlights inefficient SQL or potential memory leaks well before they cause an outage.
- Typical session profiles: A stable session pattern helps instantly detect anomalies like sudden connection storms or a growing number of long running queries.
Tools that automatically build these baselines and flag deviations help DBAs detect subtle performance issues much earlier than static monitoring ever could.
2. Analyzing wait events for early bottleneck detection
Wait events are often the earliest visible sign of performance trouble. Predictive monitoring relies heavily on recognizing upward trends in specific wait categories.
- Gradual increase in user I O waits: This suggests slowly building storage latency or cache inefficiency over time.
- Rising concurrency waits: This is often linked to increasing locking issues or excessive contention, especially in high volume RAC environments.
- Growing network related waits: This signals potential listener stress, network delays, or misconfigured application connection settings.
Good monitoring visualizes wait event distribution, correlates wait spikes with session activity or specific SQL operations, and alerts DBAs to rising patterns rather than just single threshold breaches.
3. Early identification of SQL regressions
SQL performance regressions are one of the most frequent causes of serious database slowdowns or total downtime. Predictive monitoring demands continuous, trend based visibility into SQL behavior.
- Increasing execution time for queries that were previously stable, often caused by plan changes or stale optimizer statistics.
- Growing I O footprint or CPU usage in top SQL lists, revealing statements that are becoming more expensive over time.
- Rising hard parse counts, indicating SQL sharing breakdown and unnecessary shared pool stress.
Tracking top SQL by CPU, executions, I O, and response time with historical comparisons helps DBAs spot regressions early and tune queries before widespread performance degradation occurs.
4. Predicting storage and capacity failures
Storage related issues are major contributors to unplanned Oracle downtime. Predictive capacity monitoring ensures resource limits are addressed long before they trigger outages.
- Tablespace growth acceleration that highlights how quickly space is being consumed.
- Temp space spikes during batch windows that indicate workload surges or inefficient query structures.
- Redo and archive log activity patterns that predict transactional delays and recovery risks.
Advanced monitoring provides forecasting for tablespace growth, datafile expansion, temp usage, and recovery area utilization, enabling preventive action days or weeks in advance.
5. Monitoring session behavior to catch workload anomalies
Sudden, unexpected shifts in session activity are almost always a precursor to performance degradation.
- Abnormal increases in active sessions that signal application issues or connection mismanagement.
- Gradually forming blocked session patterns linked to inefficient indexing or long running SQL.
- Session level resource outliers consuming excessive CPU or PGA memory.
Visualizing session behavior with historical context helps DBAs detect contention early and prevent workload stalls.
6. Leveraging RAC and Data Guard for high availability
High availability environments depend on early detection of inter node latencies and replication anomalies.
- Increasing global cache waits in RAC environments indicating network latency or workload imbalance.
- Rising transport and apply lag in Data Guard setups that threaten recovery objectives.
Dedicated monitoring for RAC and Data Guard ensures failover environments remain healthy and synchronized.
7. Using correlated dashboards for root cause prediction
A major challenge in proactive monitoring is correlating metrics across layers. Predictive troubleshooting requires immediate context.
- Correlated views mapping wait events to responsible sessions and SQL.
- Dashboards connecting host metrics with database behavior.
- Alerts that consider multiple related symptoms for improved accuracy.
- Historical views that reveal repeating failure patterns.
This level of correlation accelerates diagnosis and improves the effectiveness of predictive actions.
Metrics required for predictive monitoring
| Early Signal | What it Predicts | Preventive Action |
|---|---|---|
| Rising User I/O waits | Storage bottleneck | Tune SQL or upgrade I/O |
| Temp usage spike | Missing indexes, heavy sort | Query rewrite / add index |
| Hard parse growth | Shared pool stress | Increase shared pool / tune SQL |
| Transport lag | Data Guard replication issue | Fix network / tune apply |
Reducing downtime with Applications Manager’s predictive monitoring
Applications Manager enhances Oracle reliability by shifting monitoring from reactive to proactive. It provides DBAs with:
- Automated baselines and anomaly detection for memory, sessions, wait events, and resource usage.
- Predictive capacity analysis for tablespaces, temp usage, and Flash Recovery Area.
- SQL trend insights that catch regressions early.
- End to end correlation of instance behavior, system resources, and workload patterns.
- Comprehensive RAC and Data Guard visibility for high availability readiness.
- Flexible alerting that detects issues before they become outages.

By combining proactive strategies with Applications Manager’s monitoring capabilities, organizations can significantly reduce unplanned downtime, improve performance stability, and ensure their Oracle environments operate predictably under changing workloads.
Start proactive Oracle monitoring today. Try a 30-day, free trial now!

