In a competitive business landscape where operating 24*7 is mandatory, the high availability of networks and services has become a critical factor of concern for enterprises of all sizes. Hence, the implementation of an availability monitoring solution is essential. Any downtime of systems, networks, or applications will translate into a huge revenue loss for the business. Industry experts say that typical network availability must reach 99.999%.
ManageEngine OpManager provides comprehensive network availability and uptime monitoring to ensure that all your network devices and services are up and running 24*7 continuously. ManageEngine OpManager which serves as an uptime monitor has an interface that provides real-time views of availability statistics. The dashboard facilitates detailed monitoring and analysis of data from switches, routers, servers, and any other network devices.
OpManager provides several availability monitoring, which includes
- Device availability monitoring
- Interface availability monitoring
- IP SLA availability monitoring
- Service Availability monitoring
- Windows services availability monitoring
- Website availability monitoring
- Process availability monitoring
Device availability monitoring
Device availability monitoring service continuously monitors your entire network for its uptime and network availability.OpManager, as an uptime monitoring tool, polls the device for availability using ICMP ping by default. Whereas, for non-ICMP environment, especially to monitor the availability or uptime for your edge router or DMZ zone devices you can use TCP or SNMP instead. You can customize the availability polling interval to any specific infrastructure or a particular device, based on your need. OpManager pings the monitored device, i.e; it sends in data packets to the target device and waits for a response. If there is no response after two consecutive pings, then OpManager will consider the device as unavailable. OpManager communicates with the device using monitoring protocols such as ICMP, TCP, and SNMP.
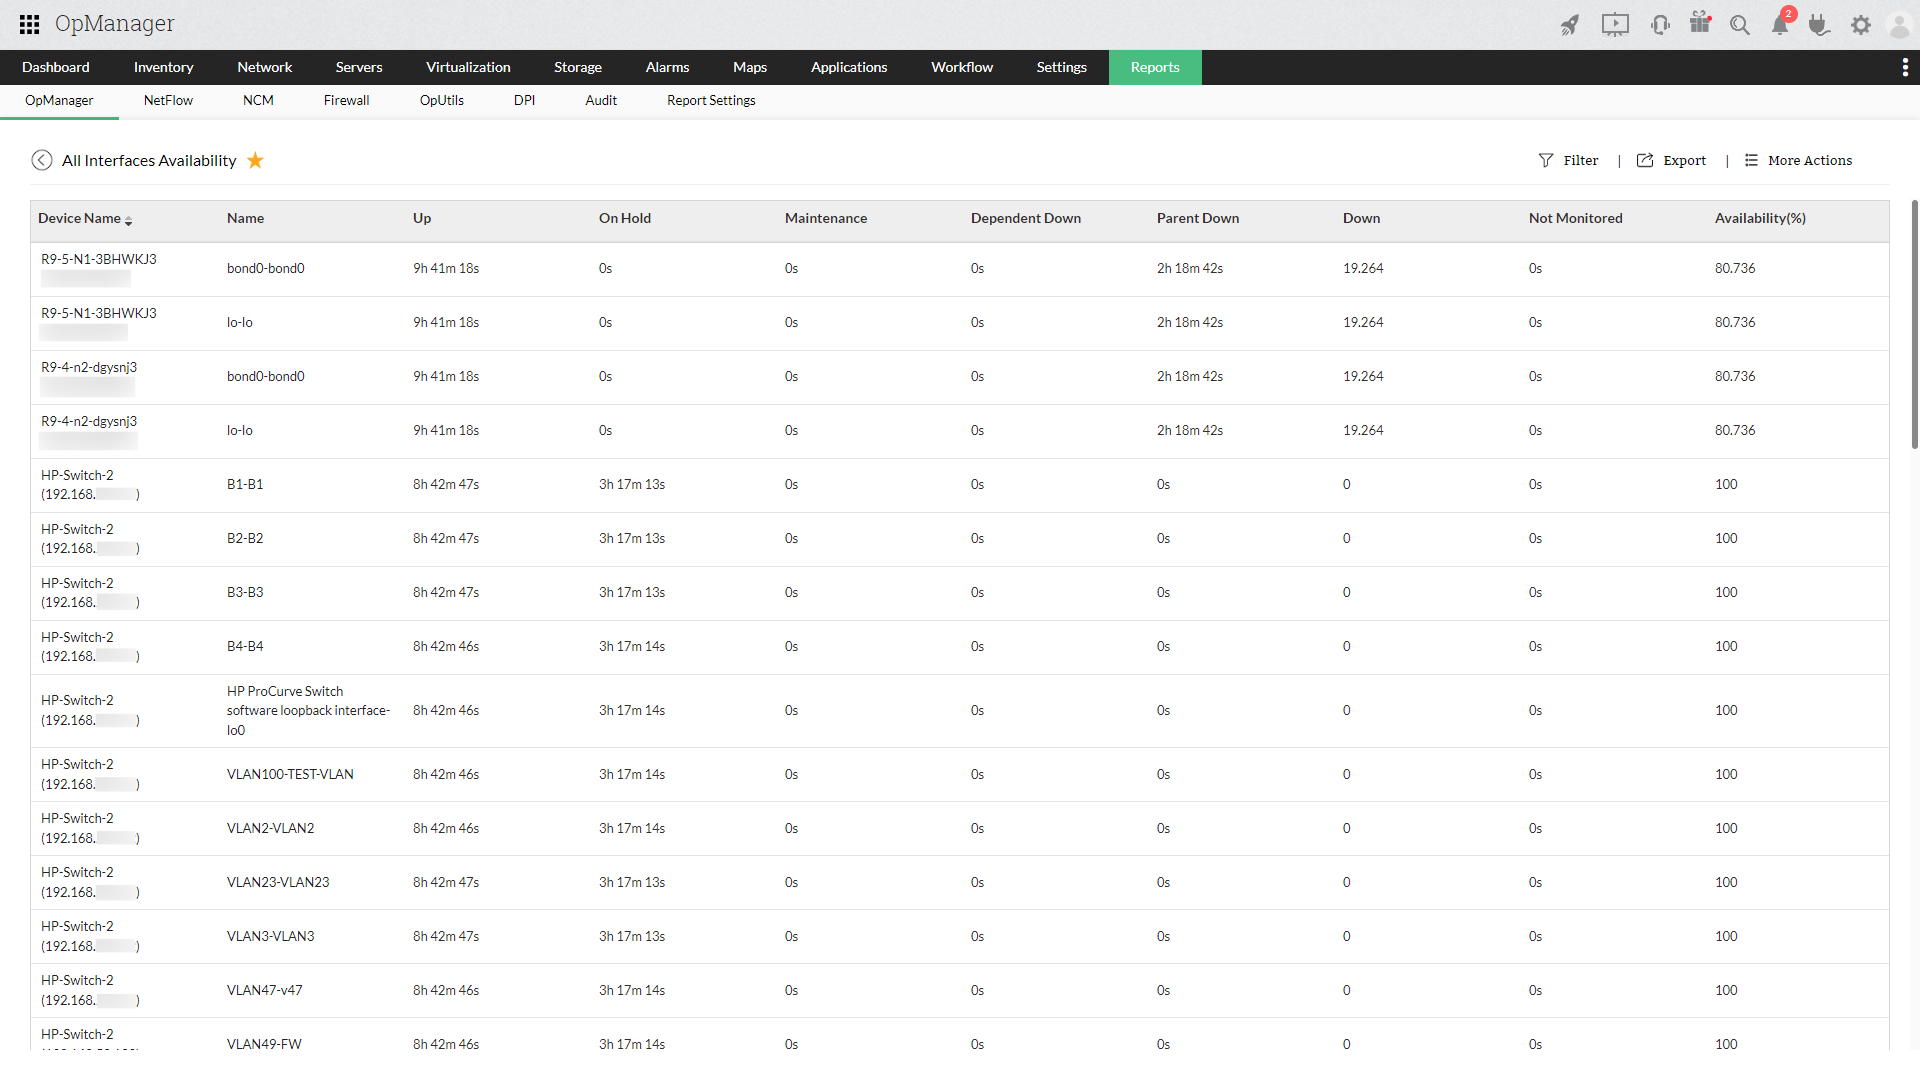
The below image shows the device availability report with their current availability state.

OpManager also displays various other device status indications apart from the device Up/ Down status. This in turn helps you avert false positives.
| Status indications in availability report | Intented User action & Use cases |
|---|---|
| Active | The device is 'UP' and running. |
| DOWN | This appears when the device is 'Down' or not available. |
| DEPENDENT_UNAVAILABLE | Appears when the dependent device(s) is down or unavailable. |
| On Hold | Unmanage device: If you wish to pause the device being monitored: At times, you may need to restart the device frequently to fix a problem, so this feature comes in handy to pause OpManager from monitoring the device. |
| On Maintenance | Maintenance state: During the period maintenance window you can place the device under maintenance mode. The maintenance can be scheduled within OpManager. In other words, "On Hold" is ad-hoc and "On Maintenance" is scheduled. |
| Parent Down | Appears when the parent device is down. |
| Dependent Down | Appears when the dependent device is down. |
Here is a chart that explains the downtime severity propagation in OpManager by default.
| If the device remains unresponsive for the... | Alarm propagation | Color code used |
|---|---|---|
| 1st poll | Attention state |  |
| 3 consecutive polls | Warning state |  |
| 5 consecutive polls | Critical state |  |
For version 125215 and above, the above said severities can be configured manually via device downtime settings. This helps you in prioritizing your critical servers and other devices in your network.
Device uplink dependencies:
Device uplink dependencies can be configured to automatically stop polling a dependent device when the parent device is down. Further, it helps you avoid alerts from spamming your inbox with emails and notifications in case of a planned maintenance in your environment.
Device downtime scheduler:
As mentioned earlier, in case of planned maintenance of your network, OpManager allows you to temporarily unmanage a set of devices in your network to avoid numerous alarms being generated because of the same. Once a downtime scheduler is active, OpManager will not reach out to that particular set of devices for the period that is specified in the scheduler. You can view the uplink device dependency while configuring the downtime scheduler.
Interface availability or Port availability monitoring
ManageEngine OpManager provides an monitoring Agent based or SNMP based interface availability and port availability monitoring for each element in the Enterprise Network and IT infrastructure. Interfaces polling is enabled by default to continuously monitor the availability of the interface and Up/Down alerts are generated based on the Admin/Operation status of that particular interface. OpManager also provides an availability report showing interface availability on a daily, weekly, monthly, or custom period basis to measure your network level availability and ensure that your SLAs are being met. These interface or port statuses are propagated across multiple facets viz. individual device status, Layer 2 network maps, business view or custom device groups, and network weather maps. Also, service monitor availability, process availability, and URL availability can also be monitored by configuring corresponding protocols.
WAN links are considered to be the most expensive element for any IT infrastructure. OpManager treats these WAN links as crucial interfaces and allow you to monitor the availability of the same at all times. Personalized reports are also available for the WAN links that are discovered in OpManager.

IP SLA availability monitoring
OpManager uses Cisco IP SLA technology to monitor the availability and performance of IP SLA-enabled devices in your network. It provides hop-wise details on latency, bandwidth utilization, Round-Trip-Time, and other performance factors using a powerful network dashboard for enhancing the WAN/VoIP performance. Thus ManageEngine's OpManager enables Network admins to perform WAN monitoring efficiently.

Application or Service availability monitoring
TCP service monitoring:

To ensure that your server management plan is complete, monitoring the availability of system-level services is vital. OpManager's server uptime monitoring feature provides you with detailed graphs and reports about the availability and response time of TCP services that are monitored. The service monitoring functionality in OpManager is customizable and you can choose the intended service for monitoring.
Windows services availability monitoring:

In addition to monitoring system-level services, OpManager also supports monitoring of Windows services using WMI. Similar to the system-level services monitoring, you can discover any Windows services and monitor them using OpManager. Further, the administrators can configure OpManager to automatically restart the service or the server when the Windows service is found to be down from the operations console. Know more about Windows Services Availability Monitoring which is another network uptime monitor found in OpManager.
Website availability monitoring:
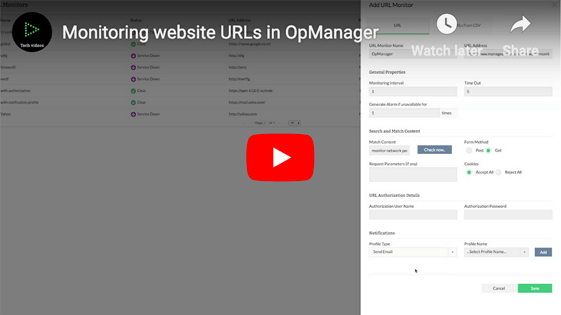
ManageEngine OpManager performs the critical task of monitoring your website for availability and performance around the clock. It monitors HTTP/ HTTPS URLs, Intranet sites, web server farms, web applications with a login, NTML-authenticated websites, and many more. Apart from URL uptime monitoring, you can also check for a particular content in your website. Website availability monitoring ensures the website is not under attack by hackers.
Process availability monitoring:

OpManager's process availability monitoring enables administrators to remotely monitor and manage processes that are running on servers. OpManager uses variety of protocols Viz. SNMP/ WMI/ CLI, to monitor the processes running on Windows, Linux, Solaris, UNIX, HP UX, IBM AIX, ESX and VMware servers and virtual machines etc.
Learn more about OpManager's Process Availability Monitoring. OpManager also offers in-depth network uptime monitoring features with real-time statistics!