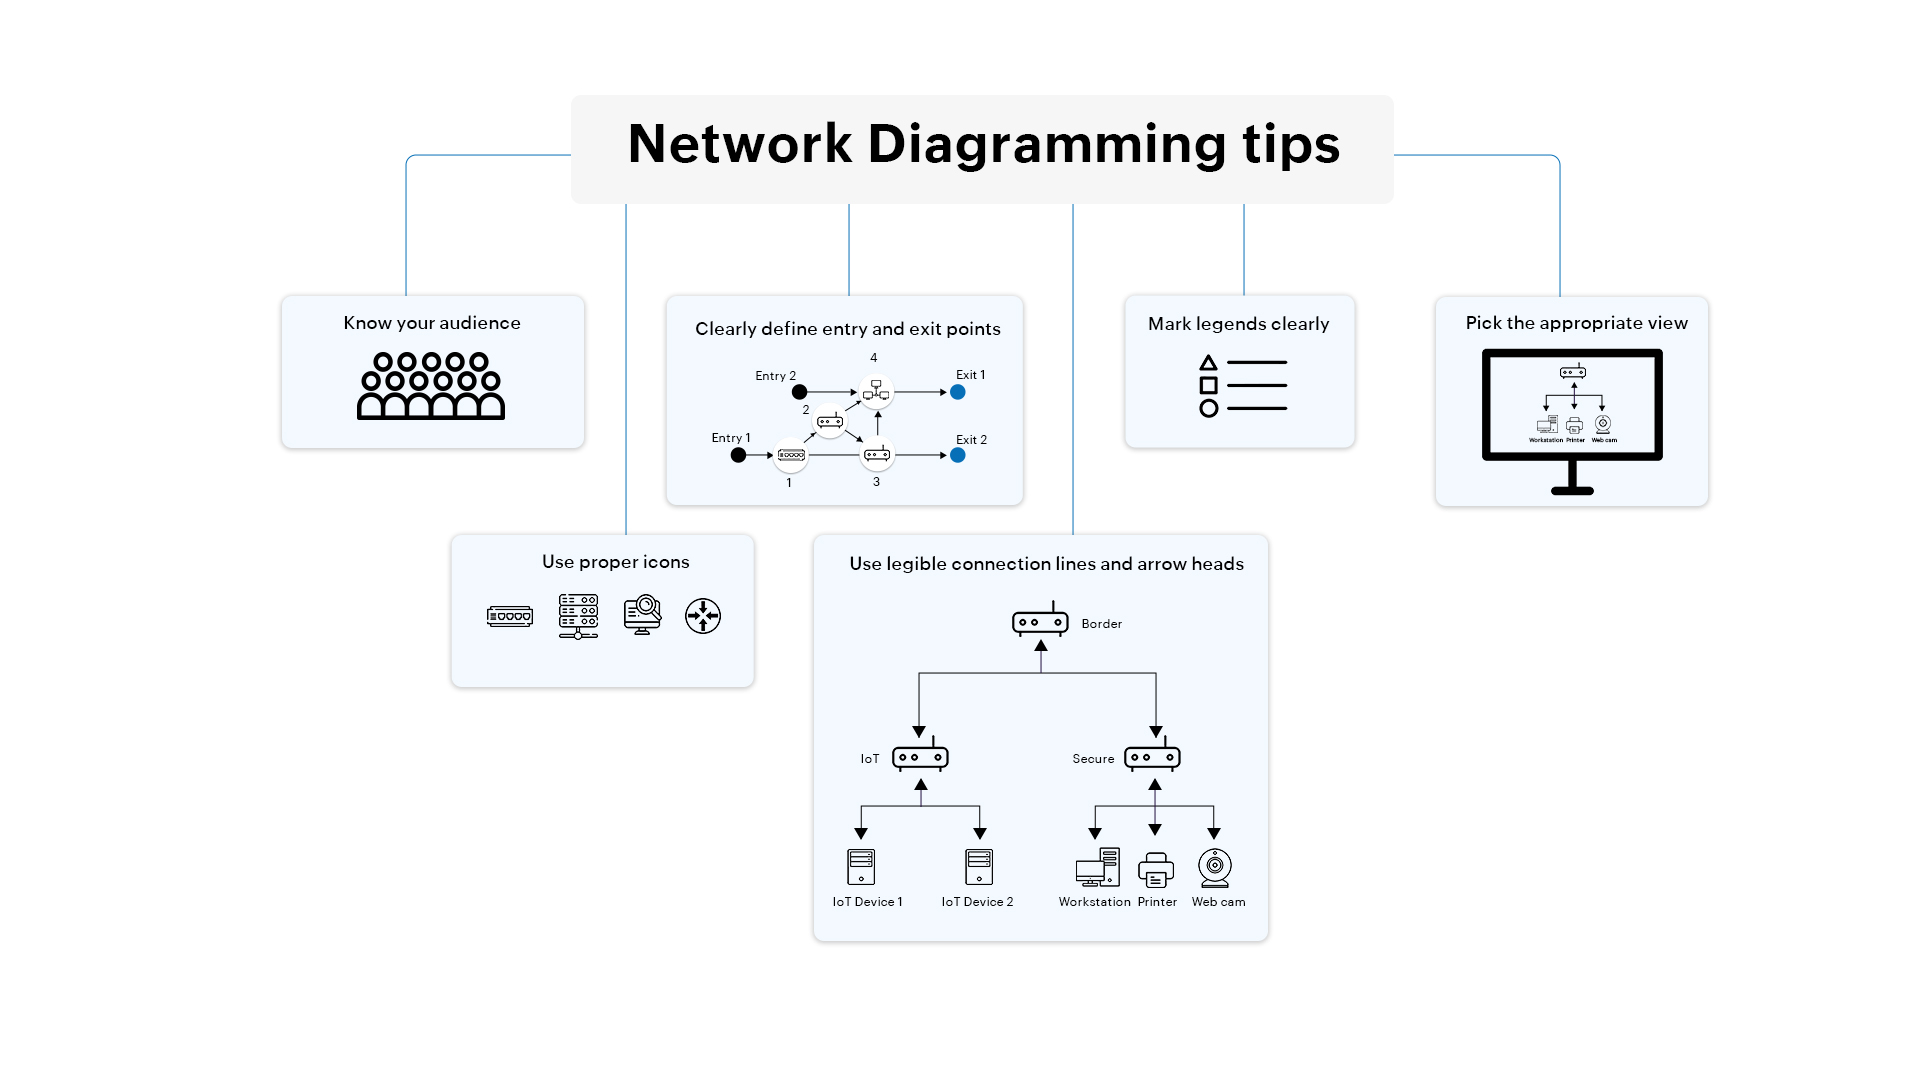
Businesses are scaling their networks constantly to meet their dynamic demands. In these cases, having visualization of the network can be difficult, since the layout of the network changes often. Network diagrams tools help with managing complex networks. They are the pictorial representation of a network that helps network admins with network planning and network expansion.
Network diagrams are a visual representation of your network unrestricted by geographical and topological barriers. However, building them is not an easy task. There are a lot of challenges and constraints associated with the development of network diagrams which we will discuss here in detail.
There are a lot of network diagram tools out there to choose from, leaving network admins wondering which diagramming tool to pick for maximum productivity. A good network diagramming software must:
Apart from choosing the right network diagrams software, it is important to choose the right view. Visualizing the network with the wrong type of view might do more harm than good. Furthermore, certain special-case scenarios might call for cross-functional views. For instance, a network admin might need to depict both the floor plan and ventilation in the same view. This is why the network diagram must be able to overlap the HVAC view with the 3D floor view.
An enterprise network is comprised of many devices, ports, and interfaces. Having a huge number of network elements like this might hinder your visualization efforts, since it's important to get all of them mapped correctly. Moreover, with varying workloads, networks are becoming dynamic. This dynamic nature requires taking scaling into consideration before a network diagram is drawn.

Here are various types of network diagramming views that you can consider going for:
Enterprise networks are often distributed geographically over a wide area and can have an enormous number of devices in their environment. Don't let this colossal size and demographic distribution be a hindrance to your visualizing efforts.
With Maps, you can visualize your network irrespective of its demographic barriers.
Organizations today are no longer uni-functional but cross-functional. They cater to or belong to not just one but many businesses. This cross-functional nature calls for the need to group devices according to their businesses applications. These complex business cases can leave organizations puzzled, and this is where Business Views come in.
Business Views allow you to group devices based on their business applications. Use Business Views to:
Enterprise networks, much like the organizations they cater to, are topological in nature. The devices are connected in an orderly fashion and are portrayed in parent-child relationships. Hence, Network topology diagrams leads to easier fault identification and rectification.
Visualizing the network topology might be hard considering the sheer number of devices and interfaces a network is associated with. Layer 2 Maps cater to this very need. The Layer 2 Maps feature:
KPIs determine the performance of a network, which makes them effective metrics to gather insights about the network. However, too many KPIs might drown a network admin with data; the trick is to visualize the network not just based on its KPIs but also in a user-friendly format that enables easier interpretation. This is where Business Views come in.
With Business Views, you don't have to sweat about the astounding number of KPIs you have to deal with. Business Views:
Interfaces and virtual machines such as virtual servers play a significant role in the performance of a network. The dynamic nature of businesses results in dynamic networks. Virtualization helps with tackling a network's dynamic nature and improve its resource allocation and utilization.
With virtualization and interfaces having such a huge stake in the functioning of a network, the need to visualize them in an easily interpretable format is indispensable.
With the help of VM Maps and Business Views you can:
ManageEngine OpManager, comprehensive network monitoring and network diagramming tool, is a one-stop solution to all your network monitoring and network diagramming needs. From geographical to topological, overcome the obstacles in your visualization efforts with Manageengine OpManager, a powerful network diagram tool. Create real-time network diagrams that help you visualise your network while proactively identifying faults.
Download OpManager the ideal network diagram software. Or learn more about Network diagrams.