Server uptime monitoring software enables network admins to monitor one of the crucial component of IT infrastructure - the network server! Servers are integral components of a network that provides a wide range of services to clients, such as information file sharing, computation, etc. Organizations heavily depend upon servers for day-to-day business operations.
Continuous server uptime is important to run a business successfully and satisfy customers. For instance, say that you have a mail server that sends and receives emails to and from a high number of customers everyday. What if your mail server crashes? A large chunk of emails would be left un-delivered, which would eventually degrade the user experience, resulting in monetary loss.
For this reason, companies with the help of server monitoring tools, monitor servers to ensure reliable server uptime with servers running 24/7. However uptime server monitoring is a complex process that involves many variables. On top of this, most large-scale organizations use many servers that are distributed geographically to offer services to clientele in various regions.
With an integrated and robust server uptime monitoring software like OpManager, IT admins can effectively perform uptime monitoring for all servers, both physical and virtual, in an organization from any corner of the world.
- Key server uptime monitoring metrics monitored
- Core features of OpManager's server uptime monitor
- Gain visibility into server uptime and performance
- Server uptime monitor FAQs
OpManager: The best server uptime monitoring tool
Key server uptime monitoring metrics monitored
To keep the server up and running, we need to keep the major factors contributing to server uptime and downtime under control.
The factors include:
- Server availability: Monitoring server availability ensures that the server is up and running without any interruptions. This ensures maximum server uptime and server performance.
- Latency: The delay in the server response to incoming requests is called latency. The latency due to increased server load can affect server uptime and availability for which latency should be tracked.
- Response time: The time taken to respond to server requests is response time. Tracking server response time is essential to prevent server latency and thereby preserve server uptime.
- Hardware metrics: Failure or malfunction of server hardware components such as battery, fan speed, power, voltage fluctuations, and more could lead to downtime. To prevent such potential downtime and ensure server uptime, tracking hardware metrics is important.
- MTTR: MTTR (mean time to resolve) refers to the time taken to resolve a fault. MTTR should be low to reduce downtime and for the server to be up and running again.
Core features of server uptime monitor
The server uptime monitoring tool in OpManager can help you proactively monitor the health of all servers on your network. OpManager being a Linux and Windows server uptime monitor, constantly communicates with servers using different protocols like the WMI and SNMP to proactively gain information about the server's health and availability. It also has a reactive mechanism to resolve server faults as and when they occur. The reports feature helps you understand how your servers are performing and the nature of faults.
The key features of OpManager's server uptime monitor include:
- Server availability monitoring
- Proactive monitoring of server health
- Service availability is server availability
- Process monitoring
- Alarms and notifications
- Reactive measures for server faults
- Integrated approach for fault resolution
- Automated server fault elimination using Workflows
Let's read a little more about these features and how monitoring them helps your network.
Server uptime monitoring: Tracking server availability
The most important parameter for server monitoring is availability. OpManager monitors and checks server uptime using ICMP, TCP, and SNMP. You can automate the monitoring process by configuring the time interval so that the servers are monitored constantly to avoid server downtime. Once the server uptime scan schedule is configured, OpManager automatically runs the server uptime monitoring service to track and update the server uptime in real-time.

Server uptime monitoring: Proactive monitoring of server health
Servers are the backbone of daily business operations and if they experience even a short period of downtime, it impacts the business severely. OpManager offers proactive server uptime monitoring of Windows and Linux by supporting multi-vendor server device templates that include major vendors like HP, Dell, IBM, etc. It ensures continuous server uptime by constantly monitoring important performance metrics like CPU utilization, memory utilization, disk utilization, process count, partition details of the device, average disk latency, etc.
Recently, many organizations have been using hypervisors like VMware, ESX/ESXi, Hyper-V, Xen Citrix, Cisco UCS, and Nutanix Hyperconverged infrastructure. Virtualization helps cut costs by running multiple applications on fewer resources. OpManager manages virtual machines installed in your network and monitors key metrics on processor, memory, disk, and network usage using virtual server monitors.
Server uptime monitoring solution in OpManager enables you to monitor both physical and virtual servers and in turn helps you prevent server faults by anticipating them ahead of time. The forecast reports available in OpManager help in capacity planning by measuring the current utilization levels of the servers in terms of CPU, memory, and disk utilization, and predicts the percentage level that can still be utilized.

Server uptime monitoring: Service availability is server availability
OpManager's server uptime monitor helps track system-level services for availability and response time, ensuring the servers are offering services seamlessly. Some of the major services that OpManager monitors are DNS, IMAP, SMTP, Echo, LDAP, Telnet, and FTP. OpManager also monitors Windows server-related services like AdobeARMservice, AVP, event logs, etc. Server uptime monitoring with OpManager also lets you automate a restart of either the service or the server if a service fails.

Server uptime monitoring: Monitoring critical processes
Knowing the level of performance of each critical process associated with a service is essential in understanding server performance. Process monitoring helps you understand the level of CPU or memory utilized by a particular process along with the number of instances. This knowledge enables you to kill unwanted processes that are utilizing the servers, and optimize your server uptime and performance.

Server uptime monitoring: Reactive measures for server faults
OpManager helps proactively monitor server uptime to maintain the proper functioning of servers by minimizing faults. However, the occurrence of server faults is inevitable. The advanced alerting options in OpManager enable IT admins to take reactive measures for faster fault detection and to reduce downtime of servers.


Server uptime monitoring: Alarms & Alert notifications
OpManager's best server uptime monitor raises an alarm when a server violates a particular threshold. It performs advanced alerting and presents only meaningful alarms after filtering the unwanted events to the IT admin, after which one can choose to clear or delete the alarm manually. Alarms have different severity levels that are displayed with corresponding color codes in the UI for ease of understanding.
Uptime server monitor in OpManager lets you configure notifications that help you manage your servers remotely. By configuring the notifications you can receive instant information about alarms via SMS/email alerts. You can escalate unattended alarms to respective email addresses so that no fault or threshold violation goes unnoticed.
Server uptime monitoring: Integrated approach for fault resolution
OpManager is an integrated tool that allows you to work with third-party applications to enhance the process of fault resolution and monitoring server uptime. For instance, say you get a critical alarm for a serious server fault that needs to be fixed with the help of a technician. You can use this integration option to raise the alarm as a ticket in ServiceDesk Plus. IT admins often face difficulty making decisions when a server faces an issue, which only causes further delays. The best way forward is to interact with your team members in Slack about possible fault-resolving techniques. You can configure a particular channel solely for servers so that all alerts related to servers can be discussed in that dedicated channel.
Server uptime monitoring: Automated server fault elimination using Workflows
The Workflow feature in OpManager enables you to monitor servers remotely by automating fault-corrective actions so that the servers are once again up and running. Workflows are completely code-free, which makes them simple to implement. You can create a Workflow to perform an action or a routine task by just dragging and dropping the icons in the left pane.
A typical workflow can check for an intended result and perform an action based on the response. For instance, you can create a workflow to delete older or unnecessary folders when the memory in the disk shrinks below the threshold value. Workflows offer a solution for faults and help constantly maintain and monitor server uptime.

Gain visibility into server uptime and performance
OpManager helps you gain insights about server uptime and performance in an integrated, centralized view. This helps you stay on top of your network servers. Its server uptime monitoring highlights information about alarms, availability, response time of servers, and performance statistics of all servers on your network through dashboards and reports.
Dashboard
The dashboard is user-friendly and can be customized to your organization's specific requirements. It also offers a NOC view that can be configured to display a required dashboard at regular intervals.

Reports
The reports available in OpManager have recorded data about the performance of the servers in your network. All the monitored data is stored as reports in OpManager for further reference and analysis. For instance, you can obtain a health report for all the servers in your network. Reports are intuitive and graphically represent the servers based on availability, packet loss, response time, disk utilization, CPU, and memory utilization.
Reports can be downloaded in PDF or XLS format, making it easier to share them with others. OpManager also allows IT admins to schedule the generation of reports. The time frame for scheduling reports can also be specified. The historical data helps network administrators to prevent the recurrence of server faults and maintain server uptime.

To learn more about these features and how it can help manage your network better, take a free personalized demo or download a free, 30-day trial today.
FAQs on Server uptime monitor
What is server uptime?
+How do I monitor server uptime?
+Why is it critical to monitor server uptime?
+Make your server uptime monitoring simple and efficient with OpManager
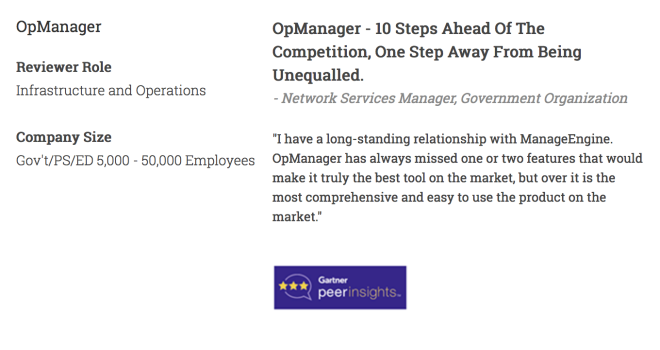
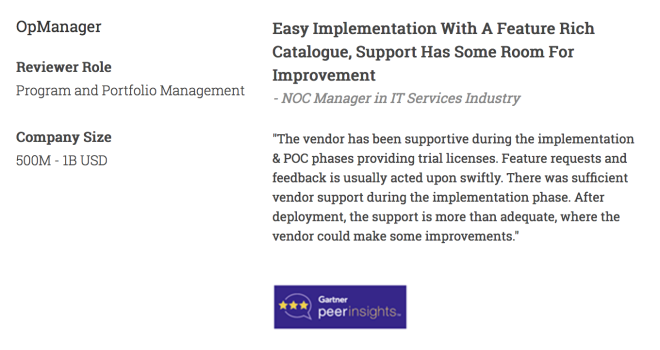
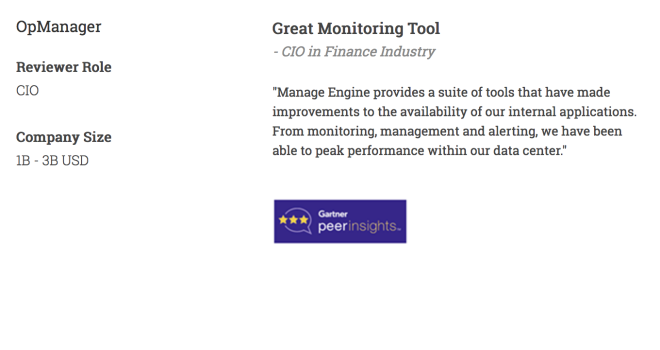
Download OpManager nowCustomer reviews
More than 1,000,000 IT admins trust ManageEngine ITOM solutions to monitor their IT infrastructure securely

Case Studies - OpManager
Awards & Honors
- Recognized as a May 2019 Gartner Peer Insights Customers' Choice for Network Performance Monitoring and Diagnostics Software
- Recognised as an April 2019 Gartner Peer Insights Customers' Choice for IT Infrastructure Monitoring Tools.
- Network Management and Monitor Vendor of the Year 2018, 2019
- Entered the 2019 Gartner NPMD Magic Quadrant.
- Ranked #2 in the Infotech Research Software Reviews Data Quadrant 2018.