IPMI Monitoring
IPMI monitoring with OpManager
IPMI has become a universal standard supported by a majority of hardware vendors. OpManager provides comprehensive IPMI monitoring and monitor the server's hardware health in real-time using SNMP/API. You can receive proactive alerts round-the-clock with OpManager as IPMI acts independent of the server and can be accessed at any time. OpManager also helps you monitor and manage remote servers and offers a centralized monitoring interface for your SNMP/Redfish API-based IPMI devices.
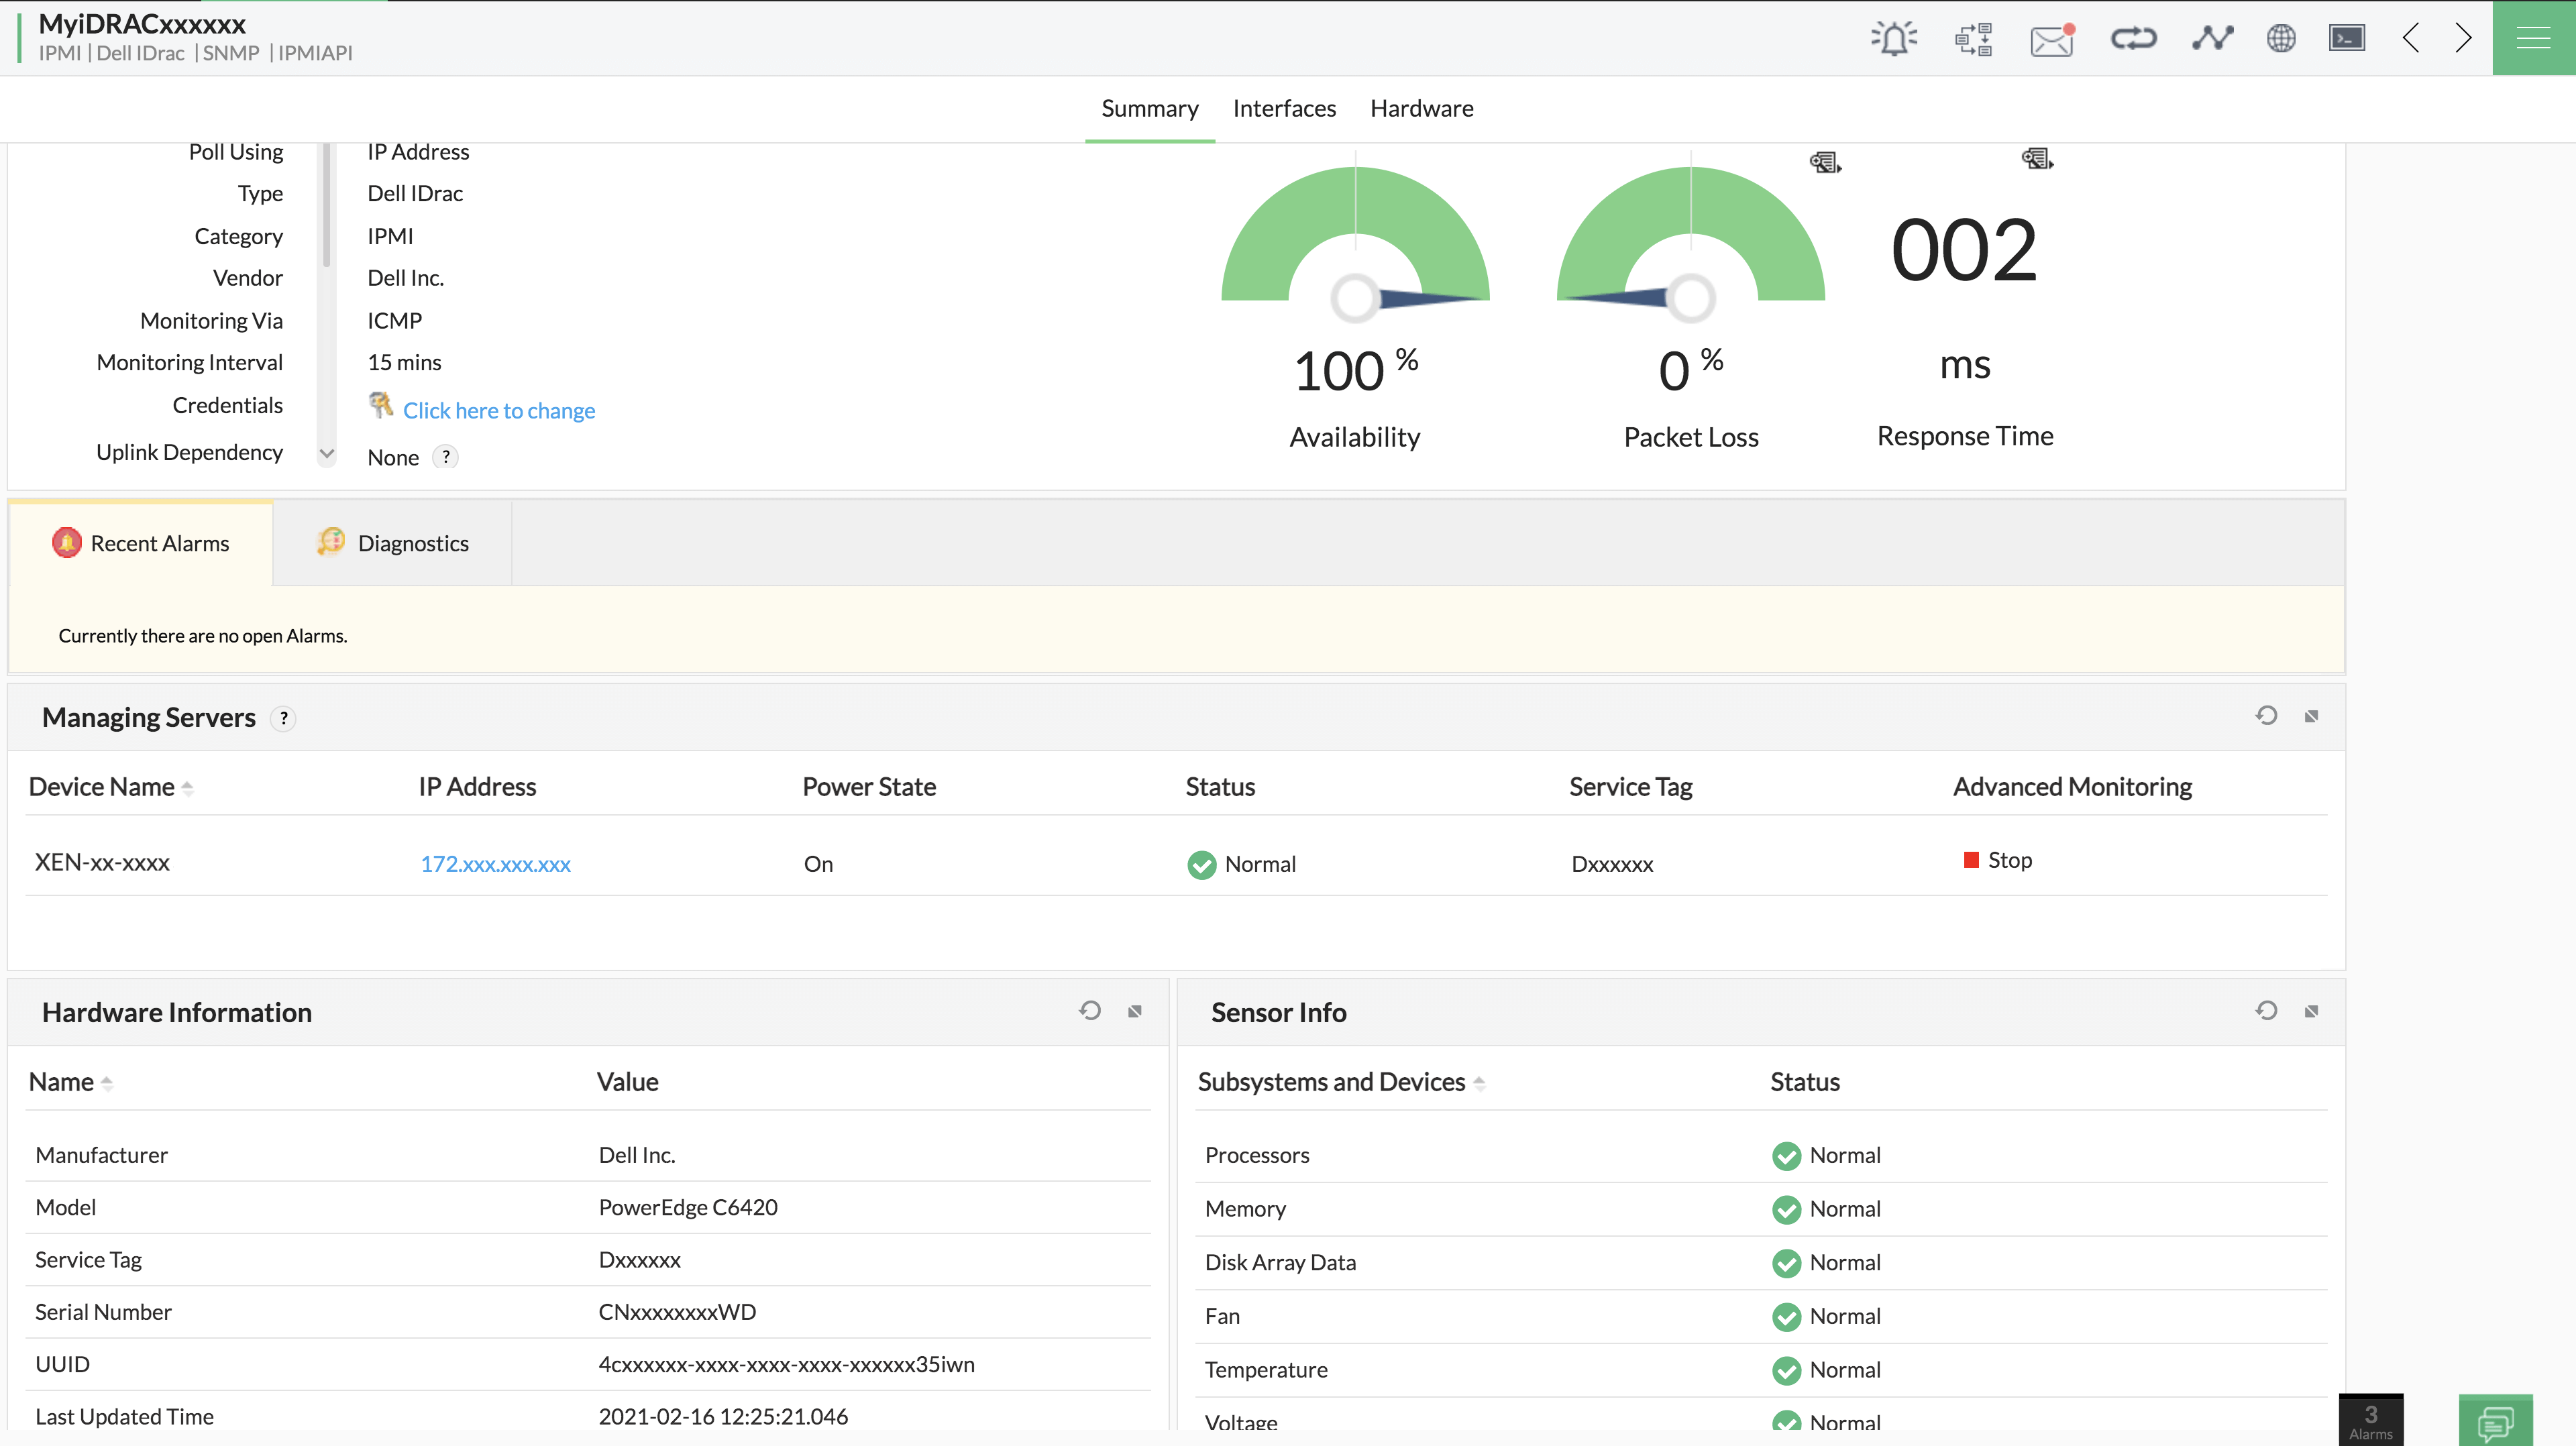
Discovering your IPMI devices into OpManager is as easy as clicking a few buttons on the user-friendly web console. Once done, all available hardware sensor metrics are immediately available for you to monitor in the IPMI snapshot itself. The status of critical metrics such as memory, temperature, fan and disk array data are all available in the same Snapshot page, with detailed historical data and graphs being literally a click away, enabling you to efficiently monitor your devices' hardware health in real-time.
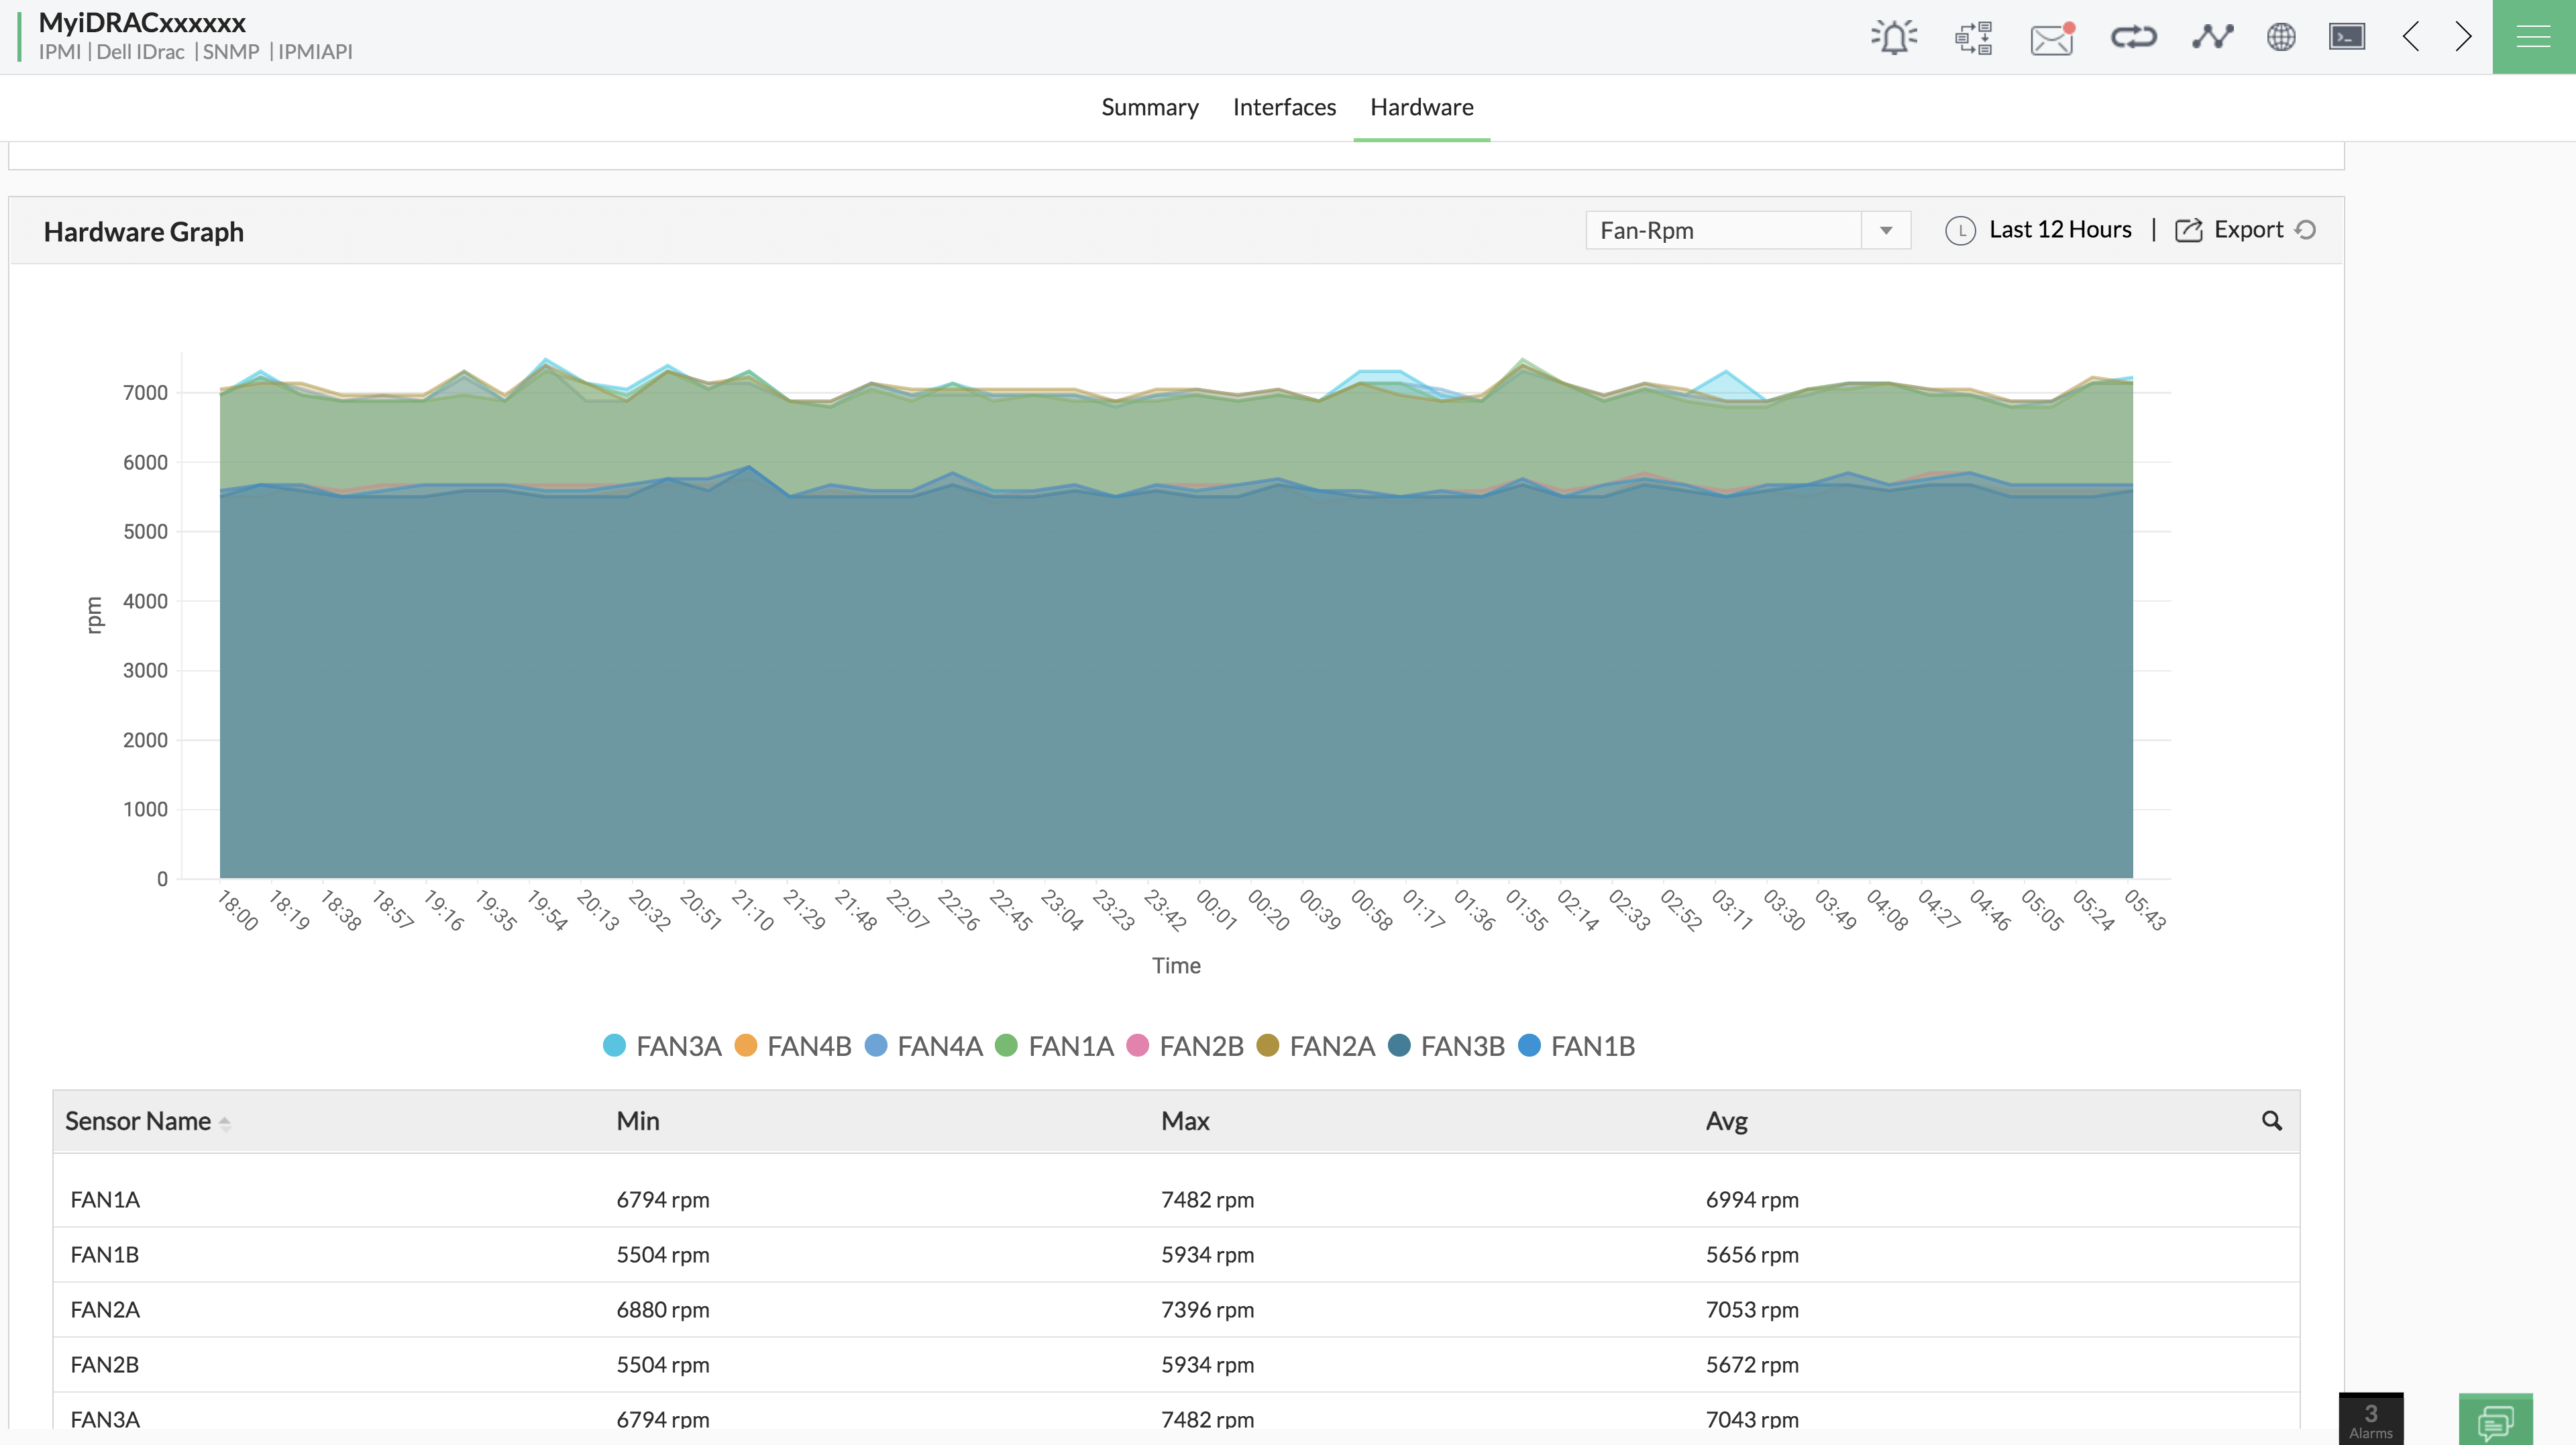
From the IPMI snapshot page, you can also view historical data of any sensor from the Hardware graphs widget. Once you select the sensor and the time frame of data needed, OpManager displays all available poll data related to that sensor in a graphical format for you to easily understand the trend of the data for that sensor. You can also choose to export the data you are viewing to an XLSX or a PDF file, in case you need to use the data for further analysis.
Set thresholds to identify issues proactively
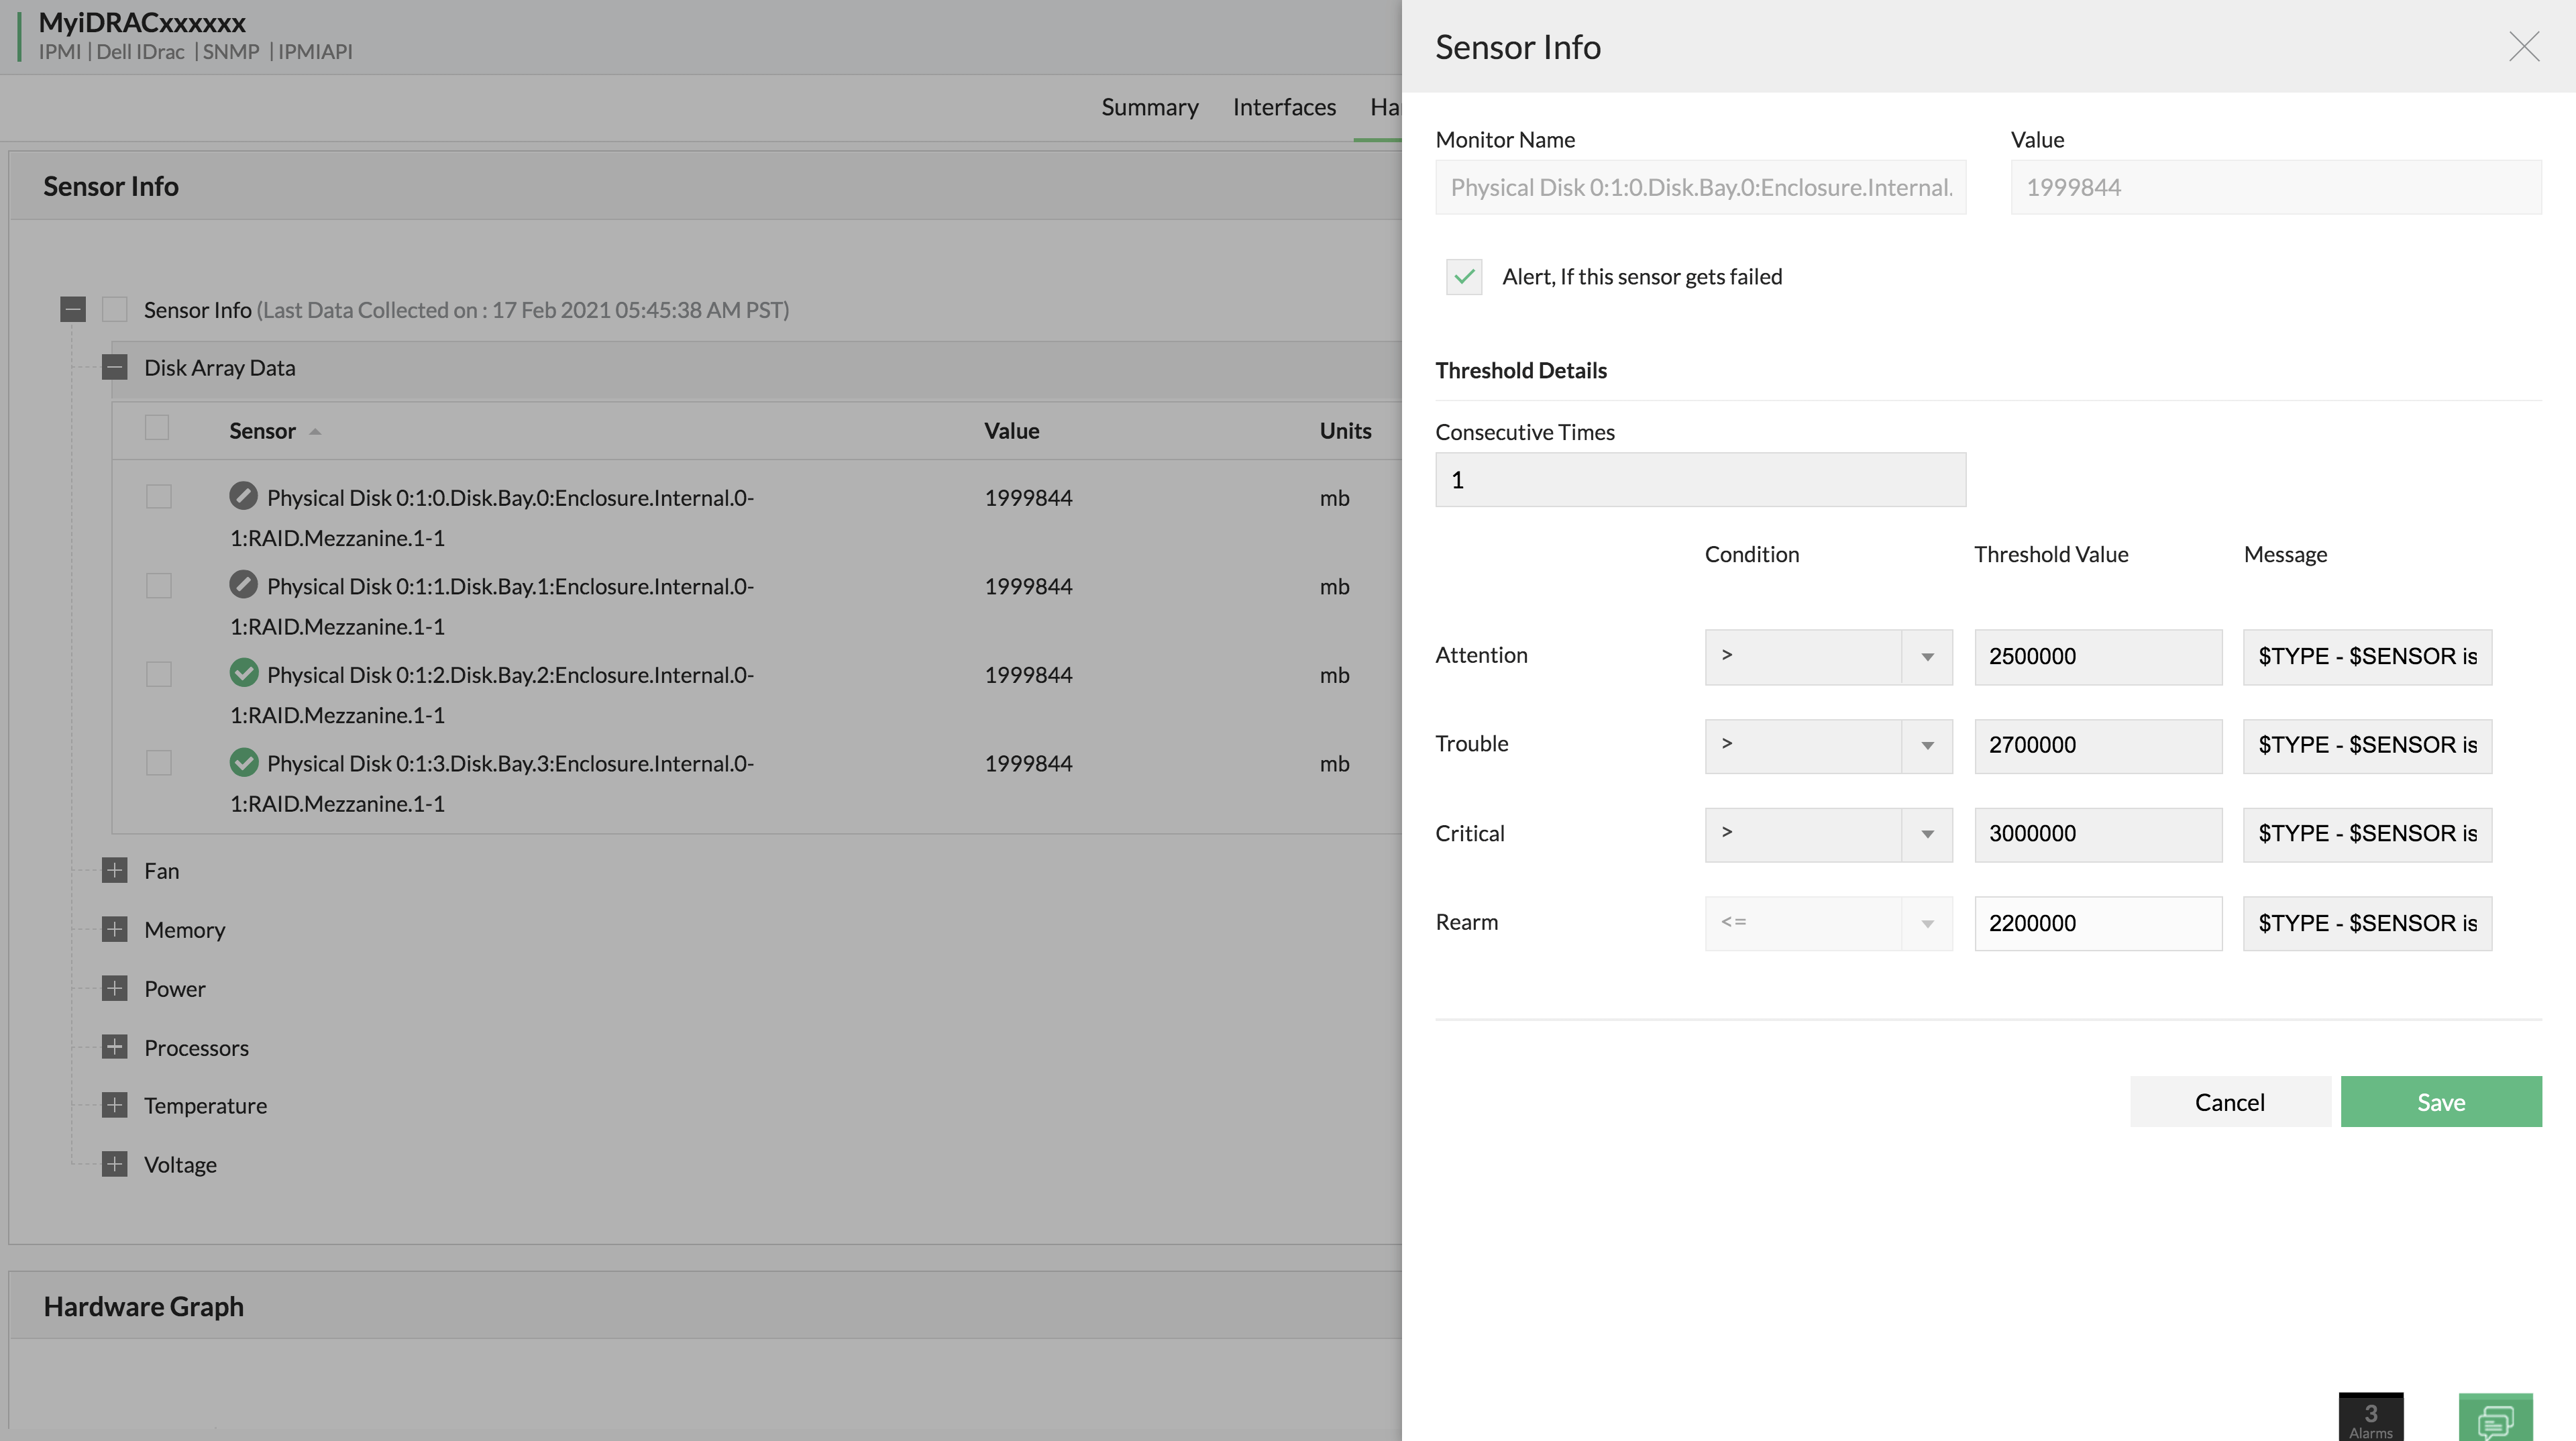
Why just monitor your sensors while you can do more? With OpManager, you can set thresholds for each sensor under your IPMI device, and get notified when the sensor value exceeds those thresholds. You can configure your thresholds in multiple levels of criticality - Attention, Trouble and Critical, so that you can identify the impact of those issues beforehand and deploy suitable countermeasures to ensure your devices are maintained at optimum health.
Personalised notifications about your IPMI devices, over the medium of your choice
OpManager also lets you send notifications about your IPMI devices based on trigger criteria provided by the users. You can configure notification profiles for your IPMI devices based on their status and related alarms, and get notified over a medium of your choice. You can choose to receive your notifications over mail/messages, or even over enterprise messaging platforms like Slack. You can also choose to execute a command or a program, or even log a ticket in a service desk platform of your choice when the provided trigger criteria is satisfied.
Comprehensive reports to understand your IPMI inventory
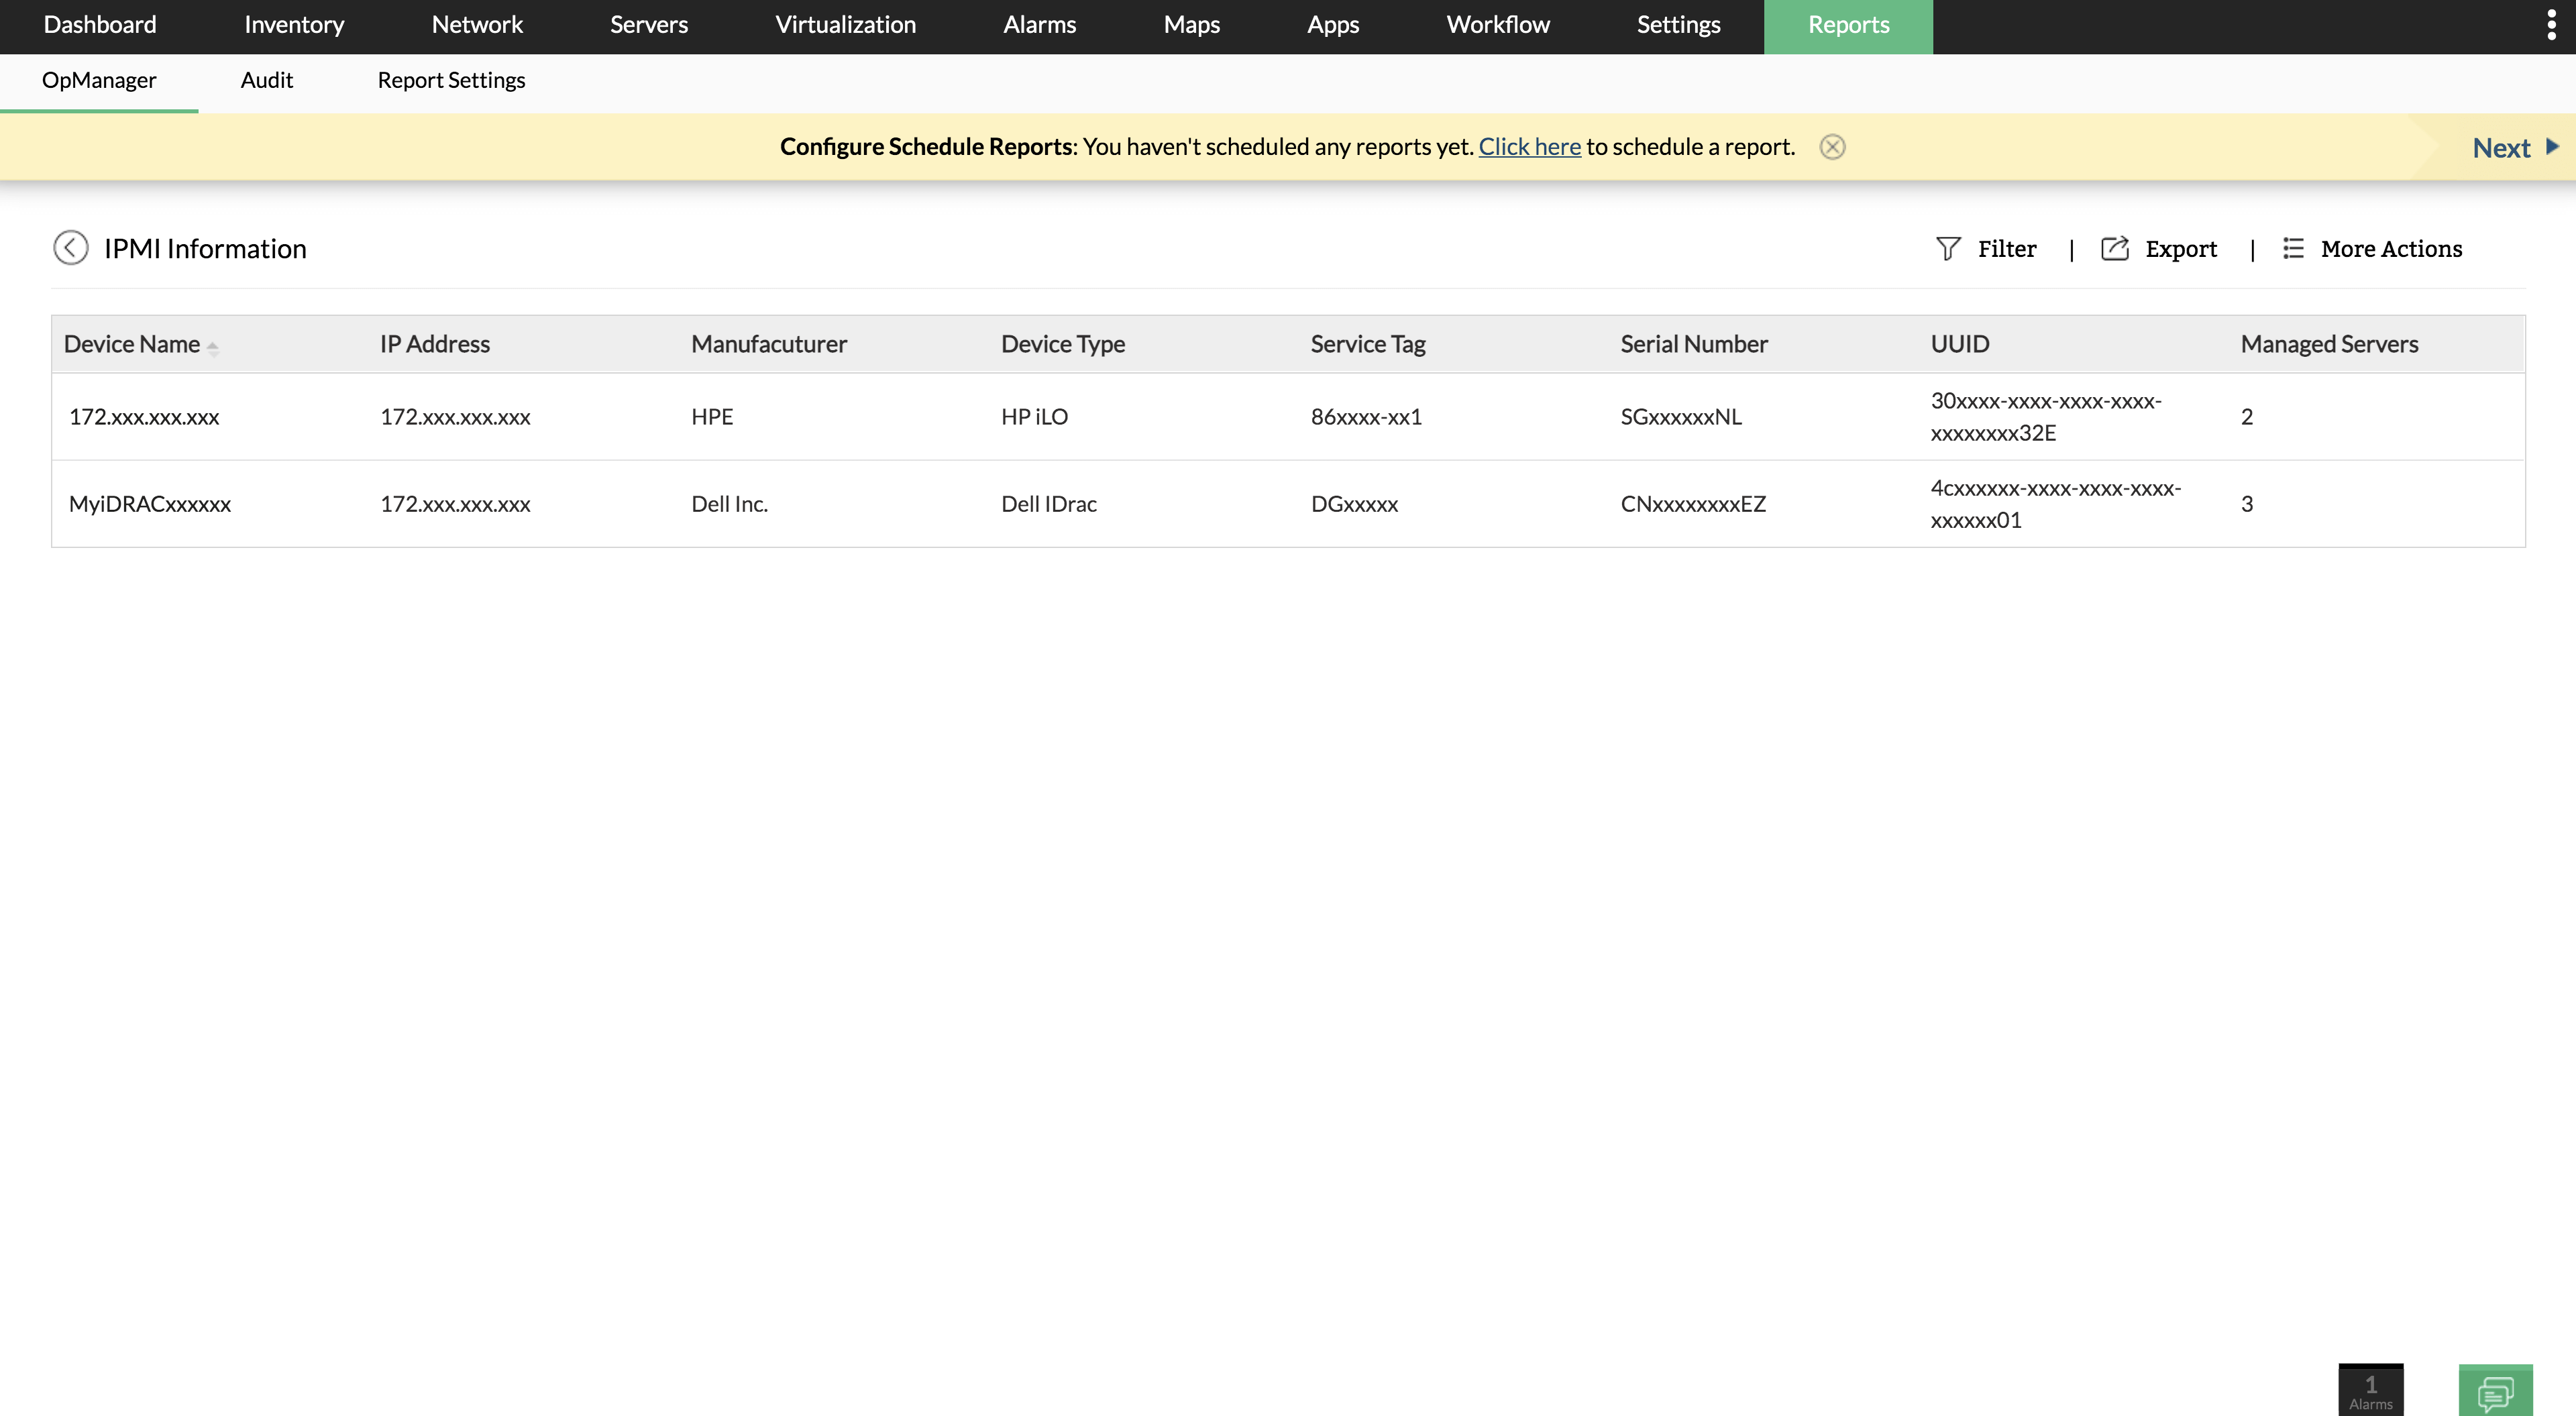
With OpManager's user-friendly Reports, you never have to worry about getting to see all your IPMI resources in a single pane. A dedicated IPMI Inventory report is readily available to display all important details of your IPMI devices at one go. General details such as IP address, Device type, Manufacturer are also displayed along with IPMI related info such as number of managed resources under a particular IPMI device. Even better, you can choose to export these into a spreadsheet or a PDF file instantly to have a backup offline, or to use it during your monthly audits.
Learn more about OpManager, a leader in the market of IPMI management software. Schedule a free demo today!
FAQs
What is IPMI?
+
How does IPMI work?
+