Hewlett Packard Enterprise storage monitoring
Storage devices form the backbone of enterprise organizations, enabling applications to run, market research to be performed, and business-critical information to be stored for day-to-day operations. Because a healthy storage network is indispensable for the smooth functioning of daily business operations, IT teams should ensure ideal performance of the storage infrastructure.
Depending on the type of storage an organization needs, it will install storage solutions in the form of RAIDs, tape libraries, and flash drives. Hewlett Packard Enterprise (HPE) offers reliable storage devices that are easy to deploy and manage. The scalability and simplicity in upgrading makes HPE a renowned storage vendor among large enterprises around the globe.
Common challenges in storage monitoring
In order to maintain peak performance of your HPE storage network, a proper mechanism must be in place to understand the storage device usage and performance and also to anticipate future needs. An effective monitoring solution will help IT admins overcome the following typical challenges of a storage network.
1. Monitoring KPIs
Input/output operations per second (IOPS), throughput, and latency are some of the major storage metrics that reveal actual storage network performance.
- IOPS - Number of input and output operations per second
- Throughput - Amount of data transferred in a given period
- Latency - Time delay between the inception of the request and the response
But monitoring just a single metric doesn't show the full picture. For example, a disk may deliver faster IOPS but the throughput value may be low, because the size of the IO requests from the application may be small. This is why it's important to take all metrics into account when interpreting storage performance.
2. Hardware failure
Innumerable read/write operations can put hard disks under enormous pressure and cause overheating. Hard disk drive (HDD) temperatures that are higher or lower than the ambient temperature can lead to premature disk failure. Fans blow cool air to maintain the ambient temperature range in the hardware, but what if the fans fail due to mechanical faults?
IT admin teams should monitor associated hardware components like fans, temperature sensors, and power sensors to maintain the long-term health of the storage devices. If you are looking for a better solution for this then choose SSDs instead of HDDs. SSDs dissipate less heat and won't require fans. (Read more on HDD vs SSD)
3. Storage growth forecasting
As your business grows, the size of your network will also scale proportionally and merely expanding your storage without careful thought is not financially feasible. Forecasting the storage growth based on data growth trends will help companies combat this problem and plan storage expansion in an economically feasible manner. A potent storage monitoring dashboard is all that is needed to visualize this growth data.
4. Wide-range monitoring
Depending on data accessibility preferences, companies may use various kinds of storage devices. For instance, a company may store frequently accessed data in a RAID device, which offers more control in the form of stripping and mirroring the data. They may also use tape libraries for long-term storage and store confidential data that is accessed less frequently.
So choosing a monitoring system that supports a variety of storage device types is crucial.
HPE storage management with OpManager
Before buying your HPE storage management software, it's important to consider the above factors.
OpManager is an easy-to-use and multi-vendor-based storage monitoring tool that monitors your RAIDs, tape libraries, and FC switches used in SAN/NAS environments from single console.
OpManager is a HPE-endorsed technology partner that supports a wide range of HPE storage device models. The partnership validates OpManager's storage monitoring solution and qualifies it as an authentic monitoring system to support HPE storage devices.

The following features in OpManager will help your admin team maintain the health and peak performance of your HPE storage devices.
HPE storage performance monitoring
The performance of your HPE storage network can be gauged by monitoring the following facets.
- Hardware monitoring
- Storage pool monitoring
- Threshold monitoring
Hardware monitoring
Each storage device has hardware components like Fan, Power Supply, and Battery and have sensors associated with them. Generally the health of hardware components are overlooked, but failing to monitor them may cause the performance of your storage devices to drop.
For example, fans help HDDs sustain optimal performance by maintaining the ideal temperature. If the fan speed reduces, the temperature of the disk may increase and slow down read/write operations performed, resulting in increased latency
OpManager communicates with the storage device and gets the information on fan speed, temperature, and more and allows you to fix an issue at its inception to prevent device failure.
Pooled data storage monitoring
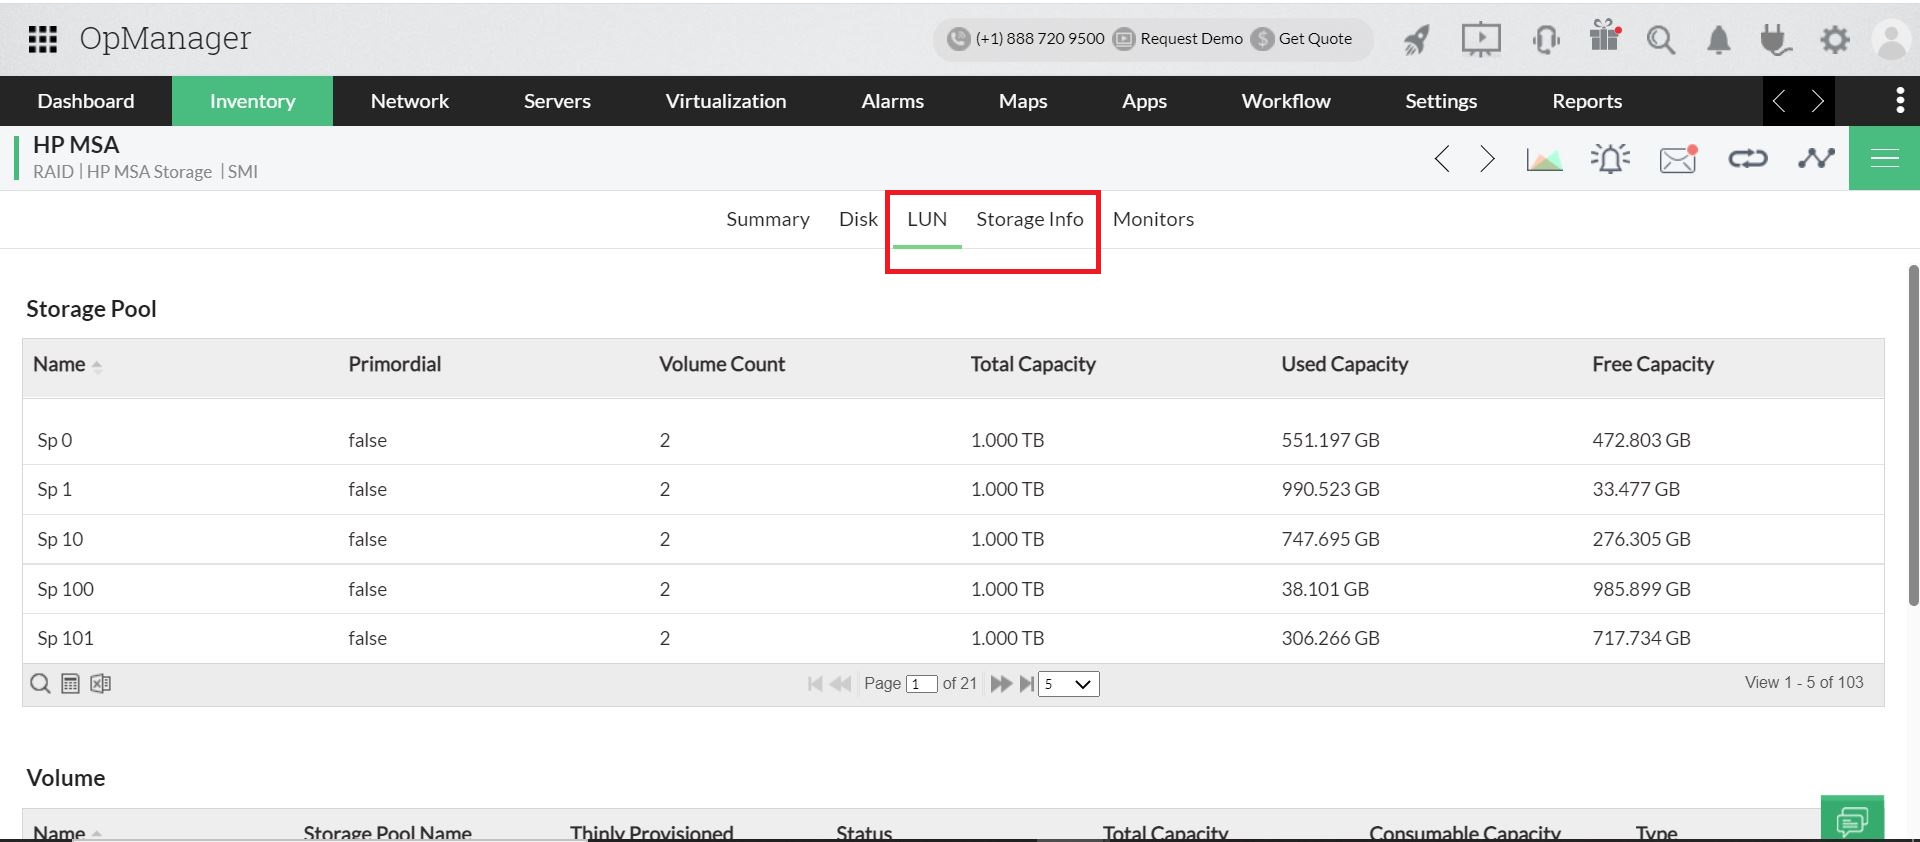
The collective capacity of a set of HDDs can be pooled into separate blocks of storage capacity called volumes. Each volume is associated with a unique address called a logical unit number (LUN).
LUNs are especially useful when multiple workstations want to access data from a centralized storage environment. Every end device will be allocated a LUN from which the device can read or write data. To every device, a LUN appears as a local hard drive, which makes central storage management easier.
OpManager monitors the LUNs and gives a centralized view of the the status and capacity usage of the individual storage pools.
Threshold monitoring
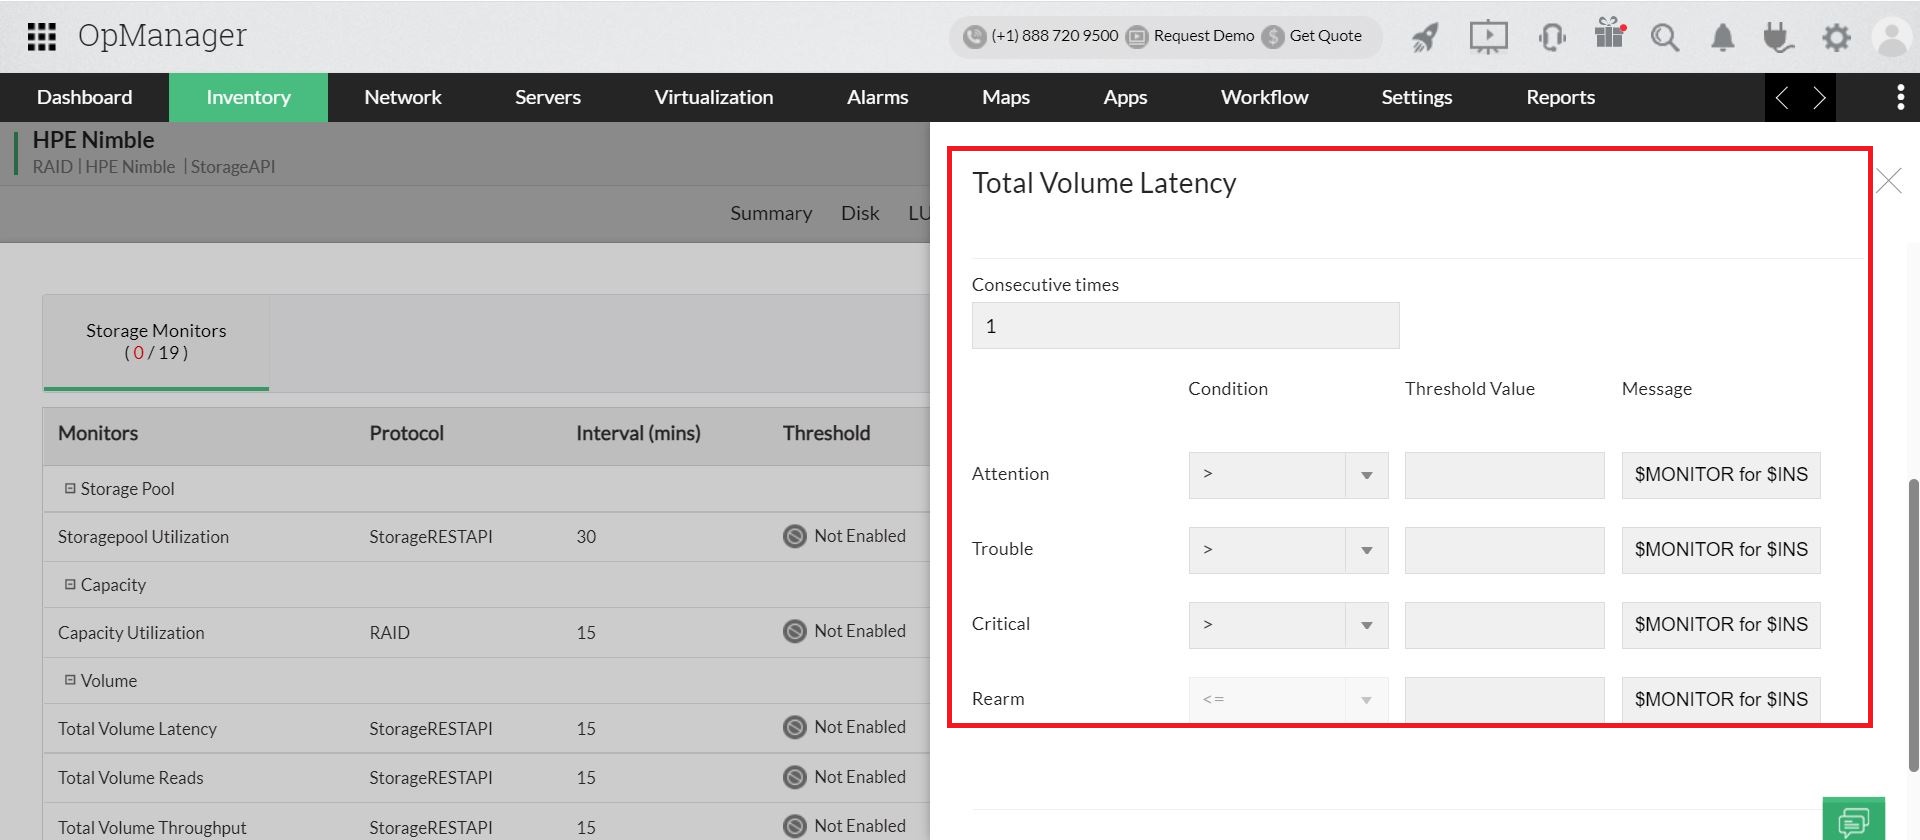
By default, there are unique built-in device templates for each device model in OpManager. It specifies the set of monitors to be tracked for performance. When a new storage device is added to your network, OpManager automatically associates the device template to that device.
For example when you add HPE Nimble storage device, a set of monitors that are a part of the template will be associated to the device for monitoring. You can set the threshold value for each monitor, so that whenever the device violates a certain value, you receive an alert.
OpManager's customizable Dashboard
Monitoring performance is subjective and depends on your network priorities, which may change, meaning your HPE storage monitoring tool should have the flexibility to sort and bring the relevant information front and center. OpManager's Dashboard is customizable and allows you to arrange the most relevant information in front of your screen.
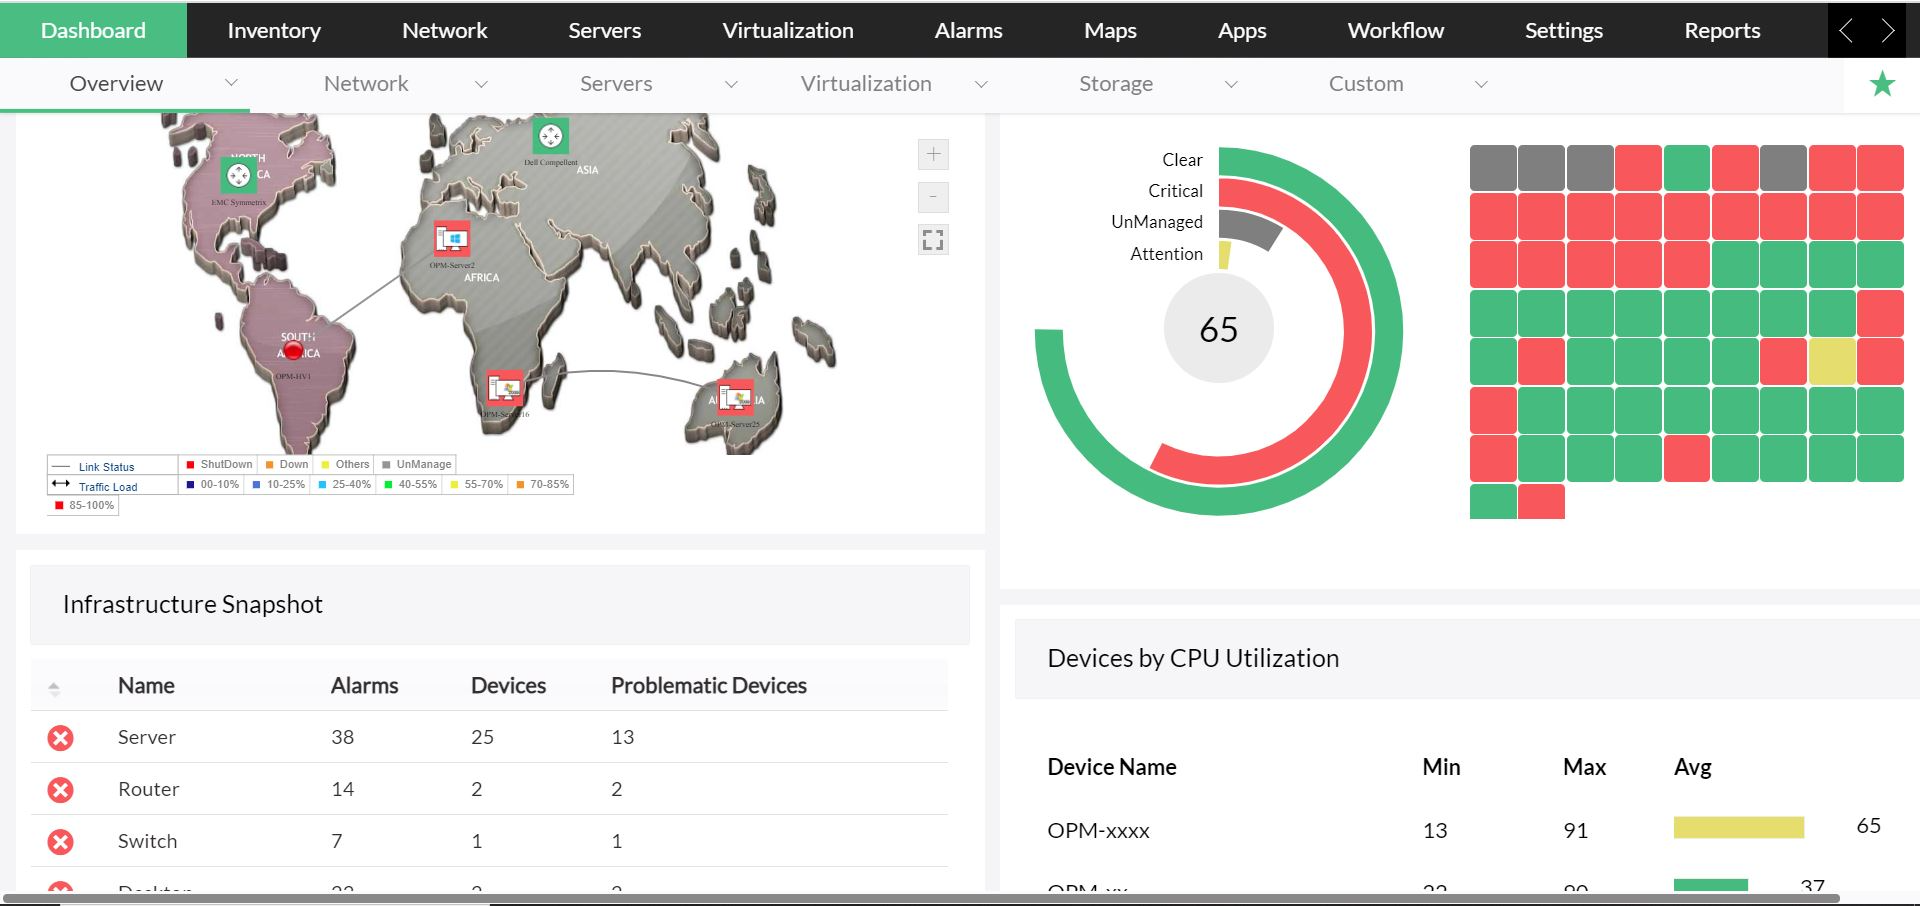
A storage module is exclusively built to display the monitoring information of your storage devices. Each monitor has a separate widget that can also be rearranged as per your preference.
By configuring the NOC feature, you can view multiple dashboard modules similar to a security monitor display. You can choose which modules to display, and the screen will refresh after defined intervals to display the next module.
HPE storage reporting
OpManager provides real-time storage monitoring data and stores the information as reports for future analysis. There are over 100 built-in reports that can be downloaded. These reports show any fault-causing patterns and enables you to fix issues proactively.
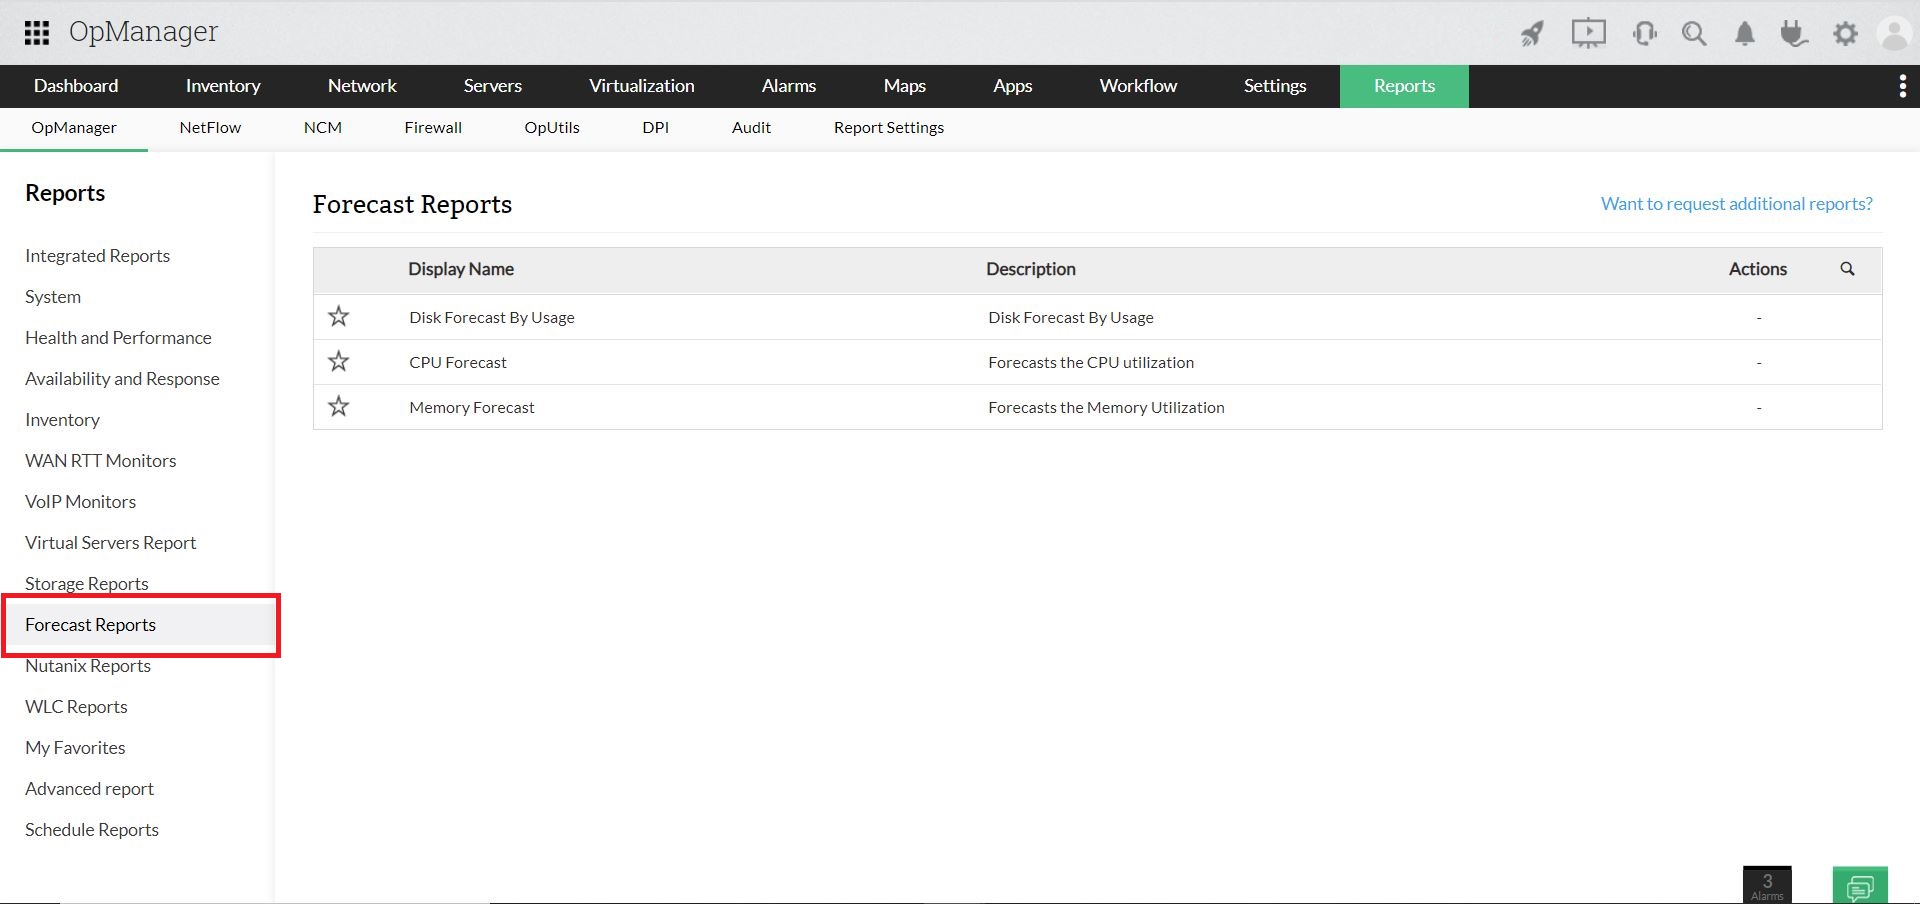
Apart from the default reports, you can also create custom reports to view particular data using two different methods:
- Advanced reports
- The report builder
Advanced reports
The Advanced report feature helps you customize the parameters involved in a report based on your HP monitoring needs. For example, you can create a report to view Disk Latency and Disk IOPS for all HPE storage devices that are within the Attention threshold.
A report containing only this information for the intended time frame will be generated.
Report builder
Using the report builder in OpManager, you can hand pick the devices from the inventory and generate a report in no time for particular metrics. For your convenience, you can generate the report in a table or graphical view for a particular time frame. The reports generated using this feature can be accessed by navigating to Reports-->Integrated reports.
Integration
With OpManager's integration capabilities, you can troubleshoot and resolve issues and alerts using incident management apps like ServiceNow, Jira, ServiceDesk Plus, Slack, and AlarmsOne.
For instance, you can configure to raise alerts in OpManager as tickets in ServiceNow to ensure the issue is quickly resolved with a technicians help.
OpManager also supports webhooks and seamlessly integrates with third-party applications like Telegram and Microsoft Teams, enabling you to discuss possible solutions for a fault and accelerates the fault rectification process.
Storage network maintenance is vital for seamless business operations. OpManager optimizes your storage device performance, simplifies storage expansion, and eliminates fault instantly, ensuring a healthy storage infrastructure to propel your business forward.
Learn more about OpManager and download a free, 30-day trial version. You can also experience an online demo at zero cost, or schedule a free, personalized demo with our experts who can answer all your product questions.