1 Million and Counting

Saint Gobain
NASA
Time Warner Cable
Loreal Paris
Siemens
DHL

Turn network alerts into faster decisions and stronger uptime

Too many alerts, false positives, and slow escalations often drown IT teams in noise and delay real incident response. ManageEngine OpManager addresses this with ML-driven adaptive thresholds, topology-aware correlation, and automated escalation workflows, filtering out noise and highlighting only actionable alerts. This helps teams respond faster, avoid missed incidents, and ensure critical issues reach the right people instantly via email, SMS, Teams, Slack, or ITSM tools.

ML-powered anomaly detection for smarter alerts

Instantly identify critical incidents and eliminate alert noise across your network.

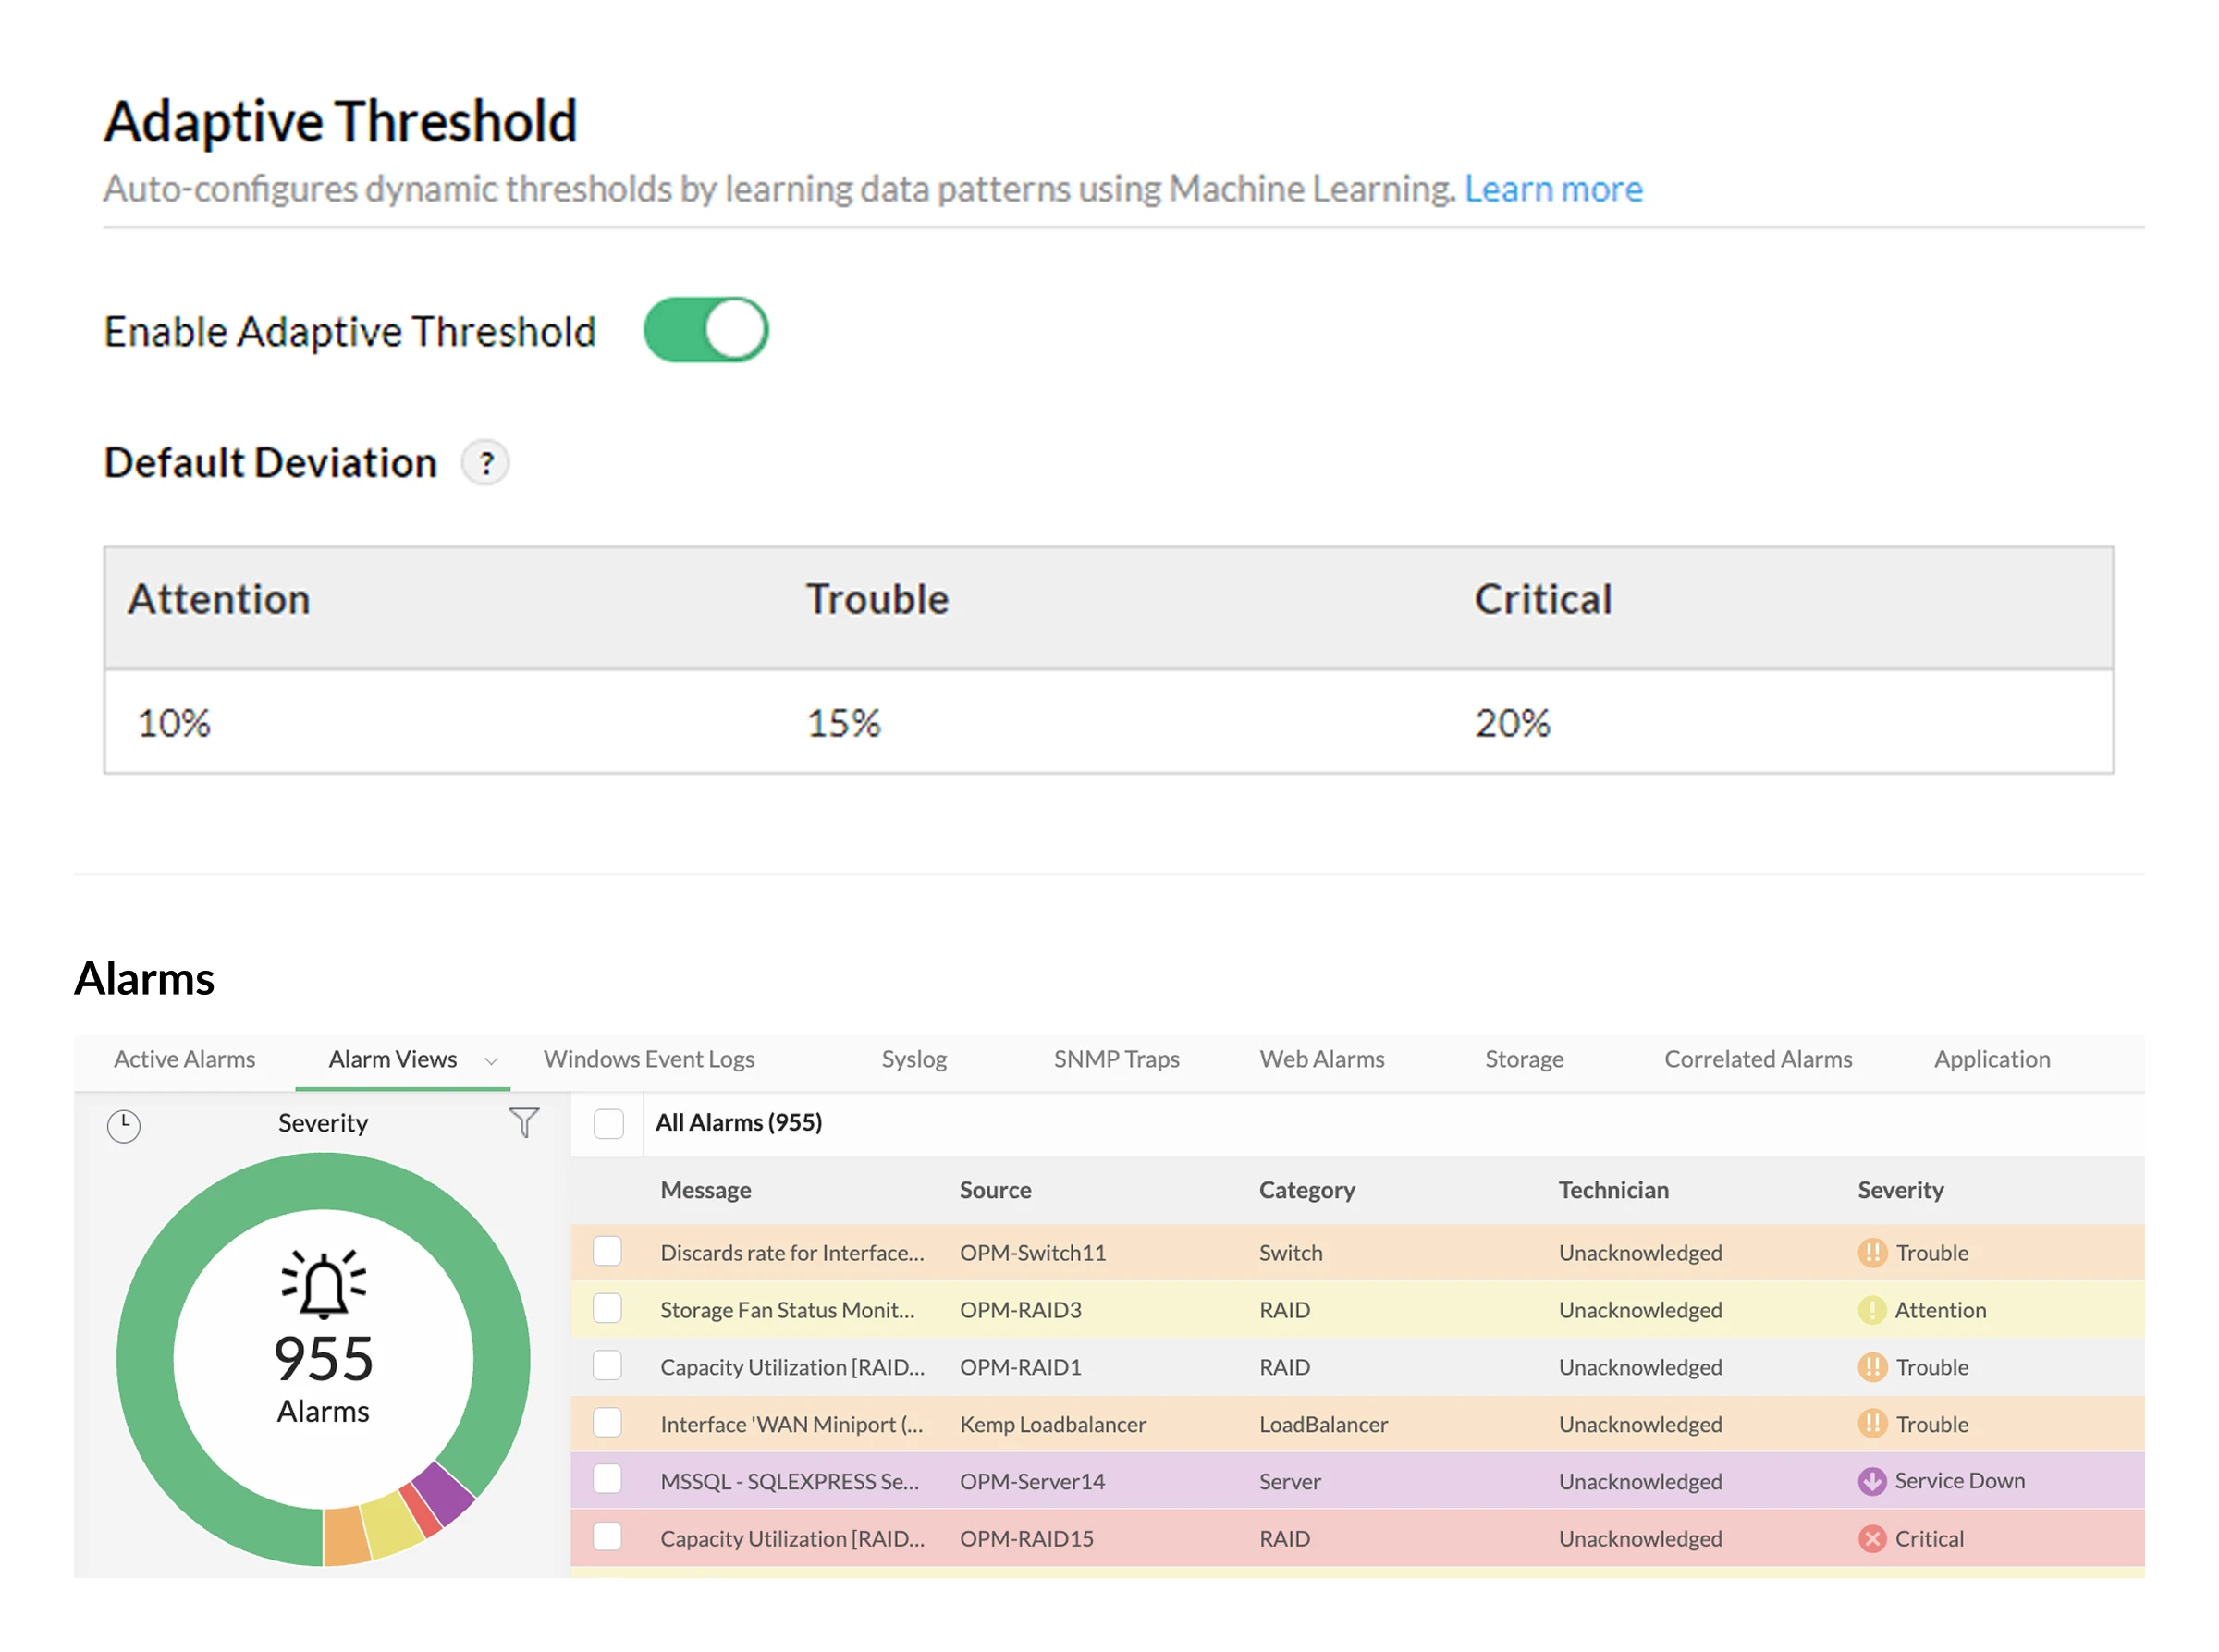
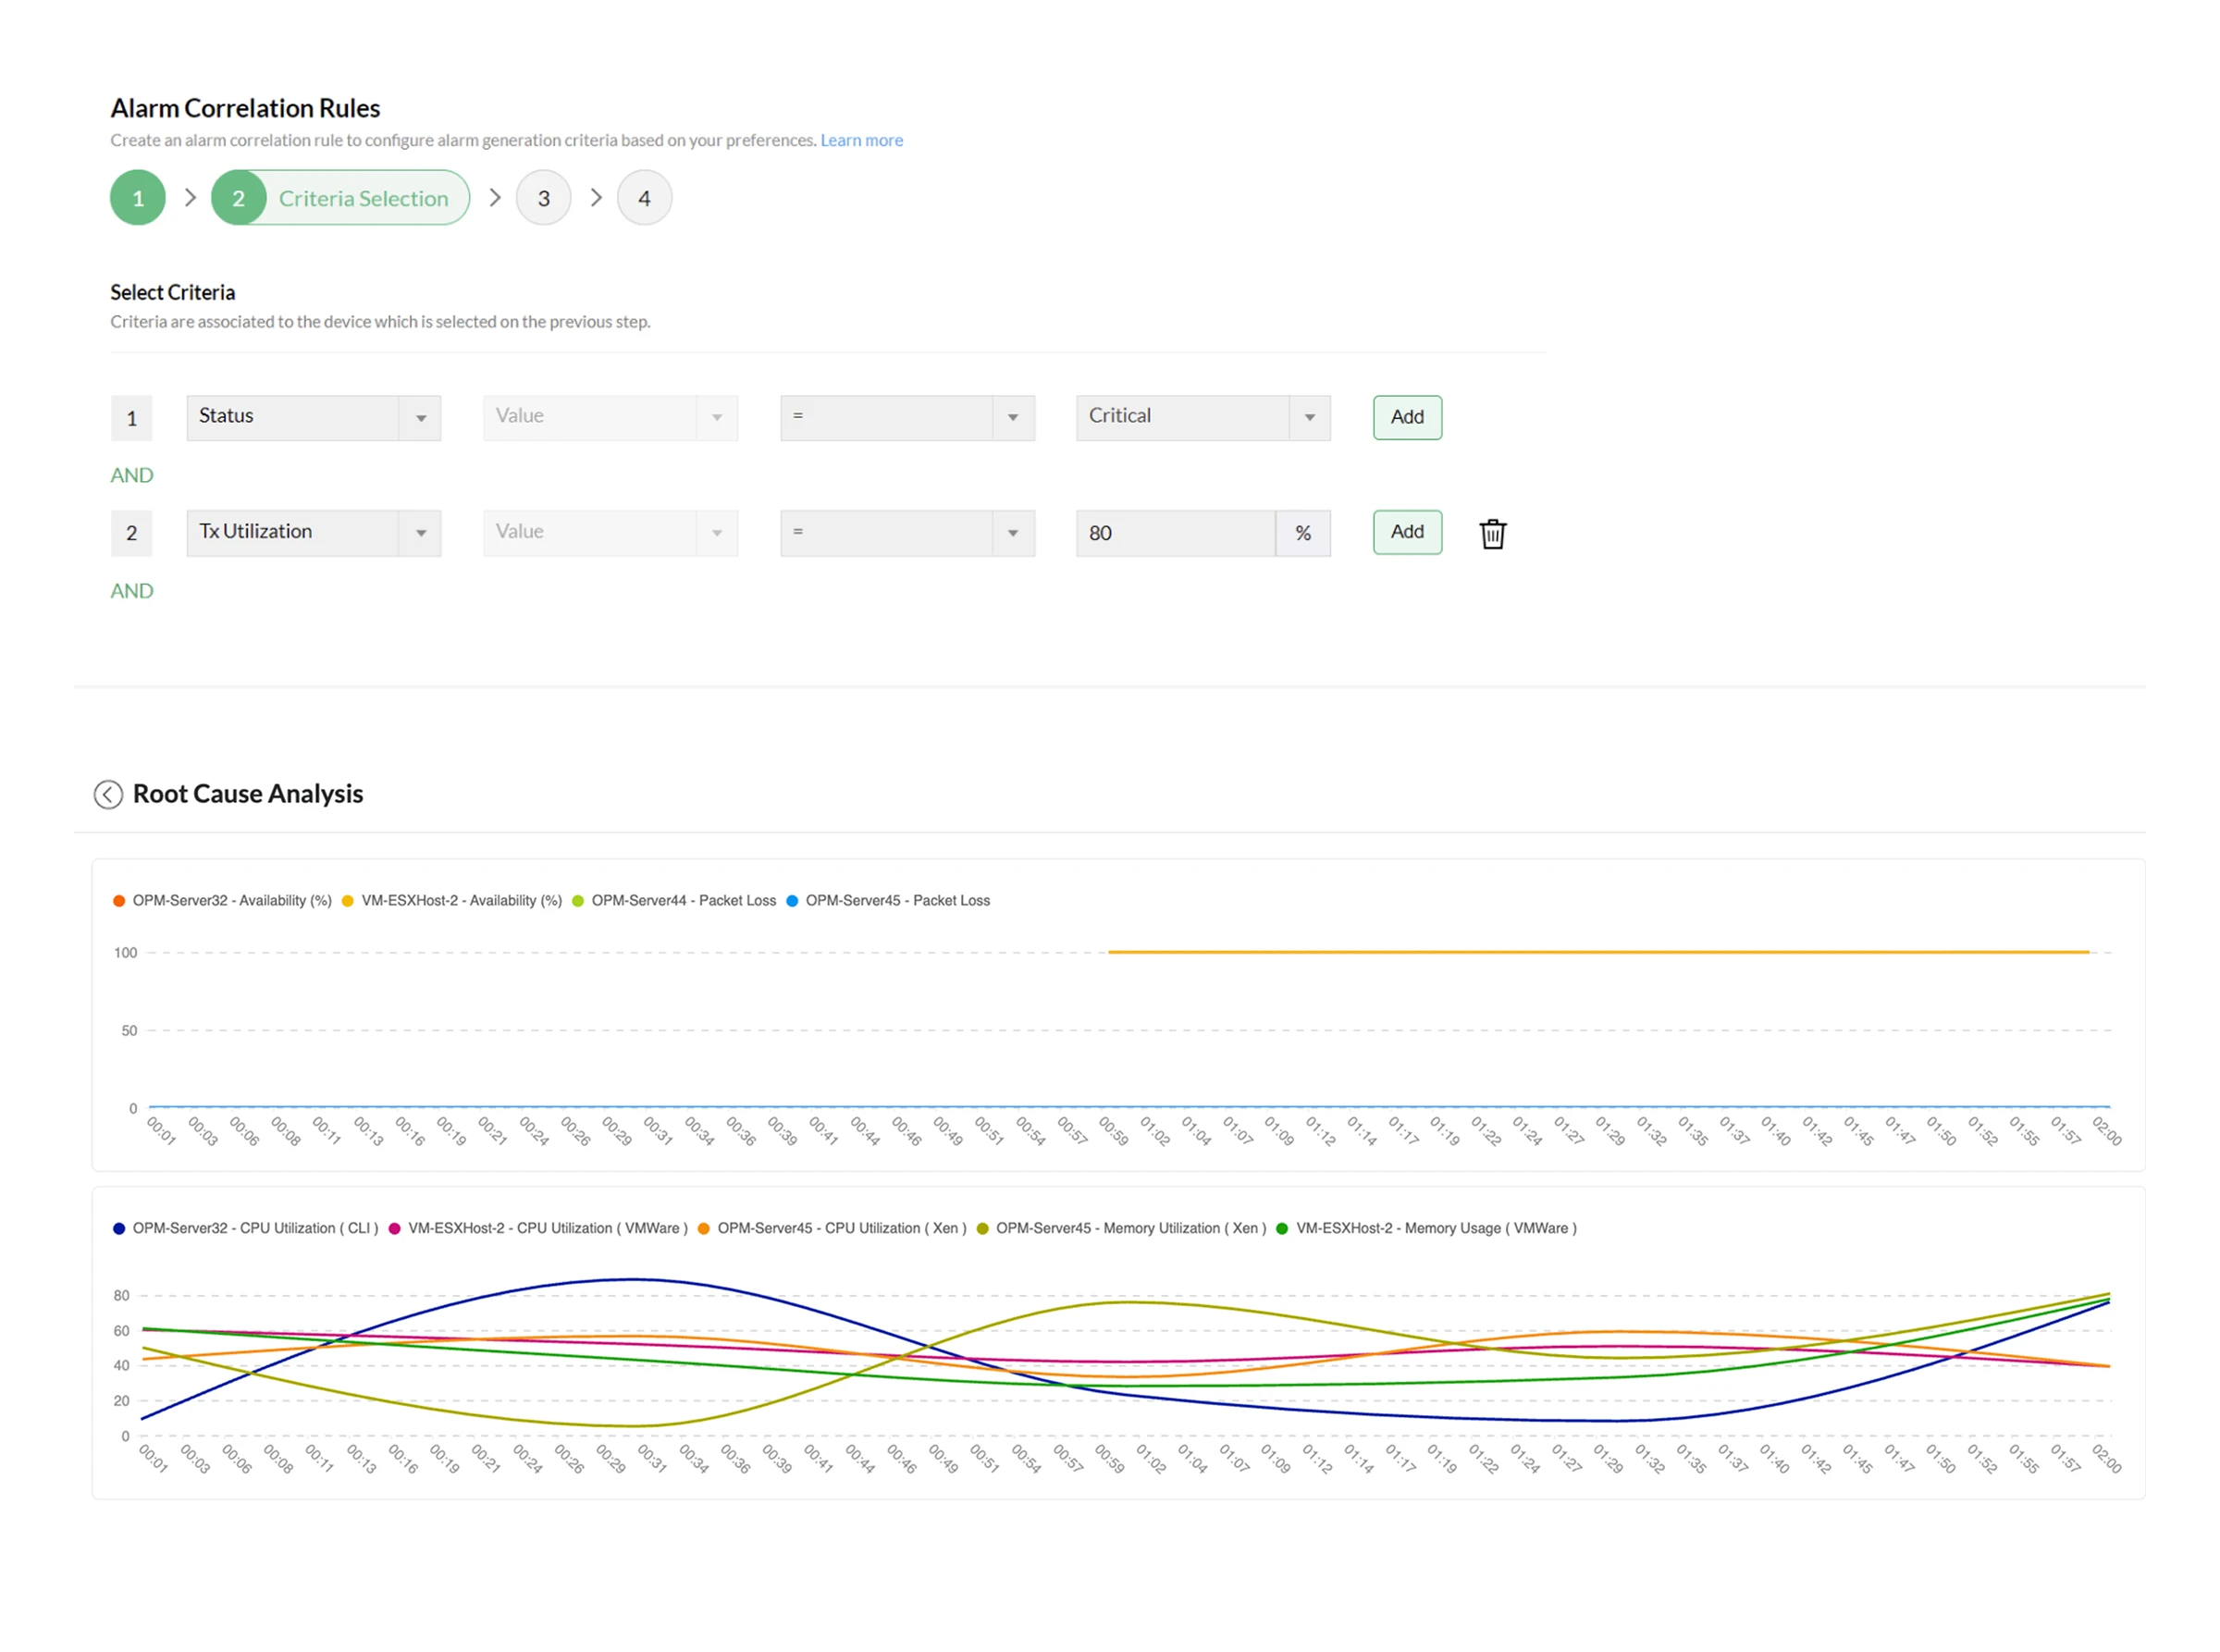
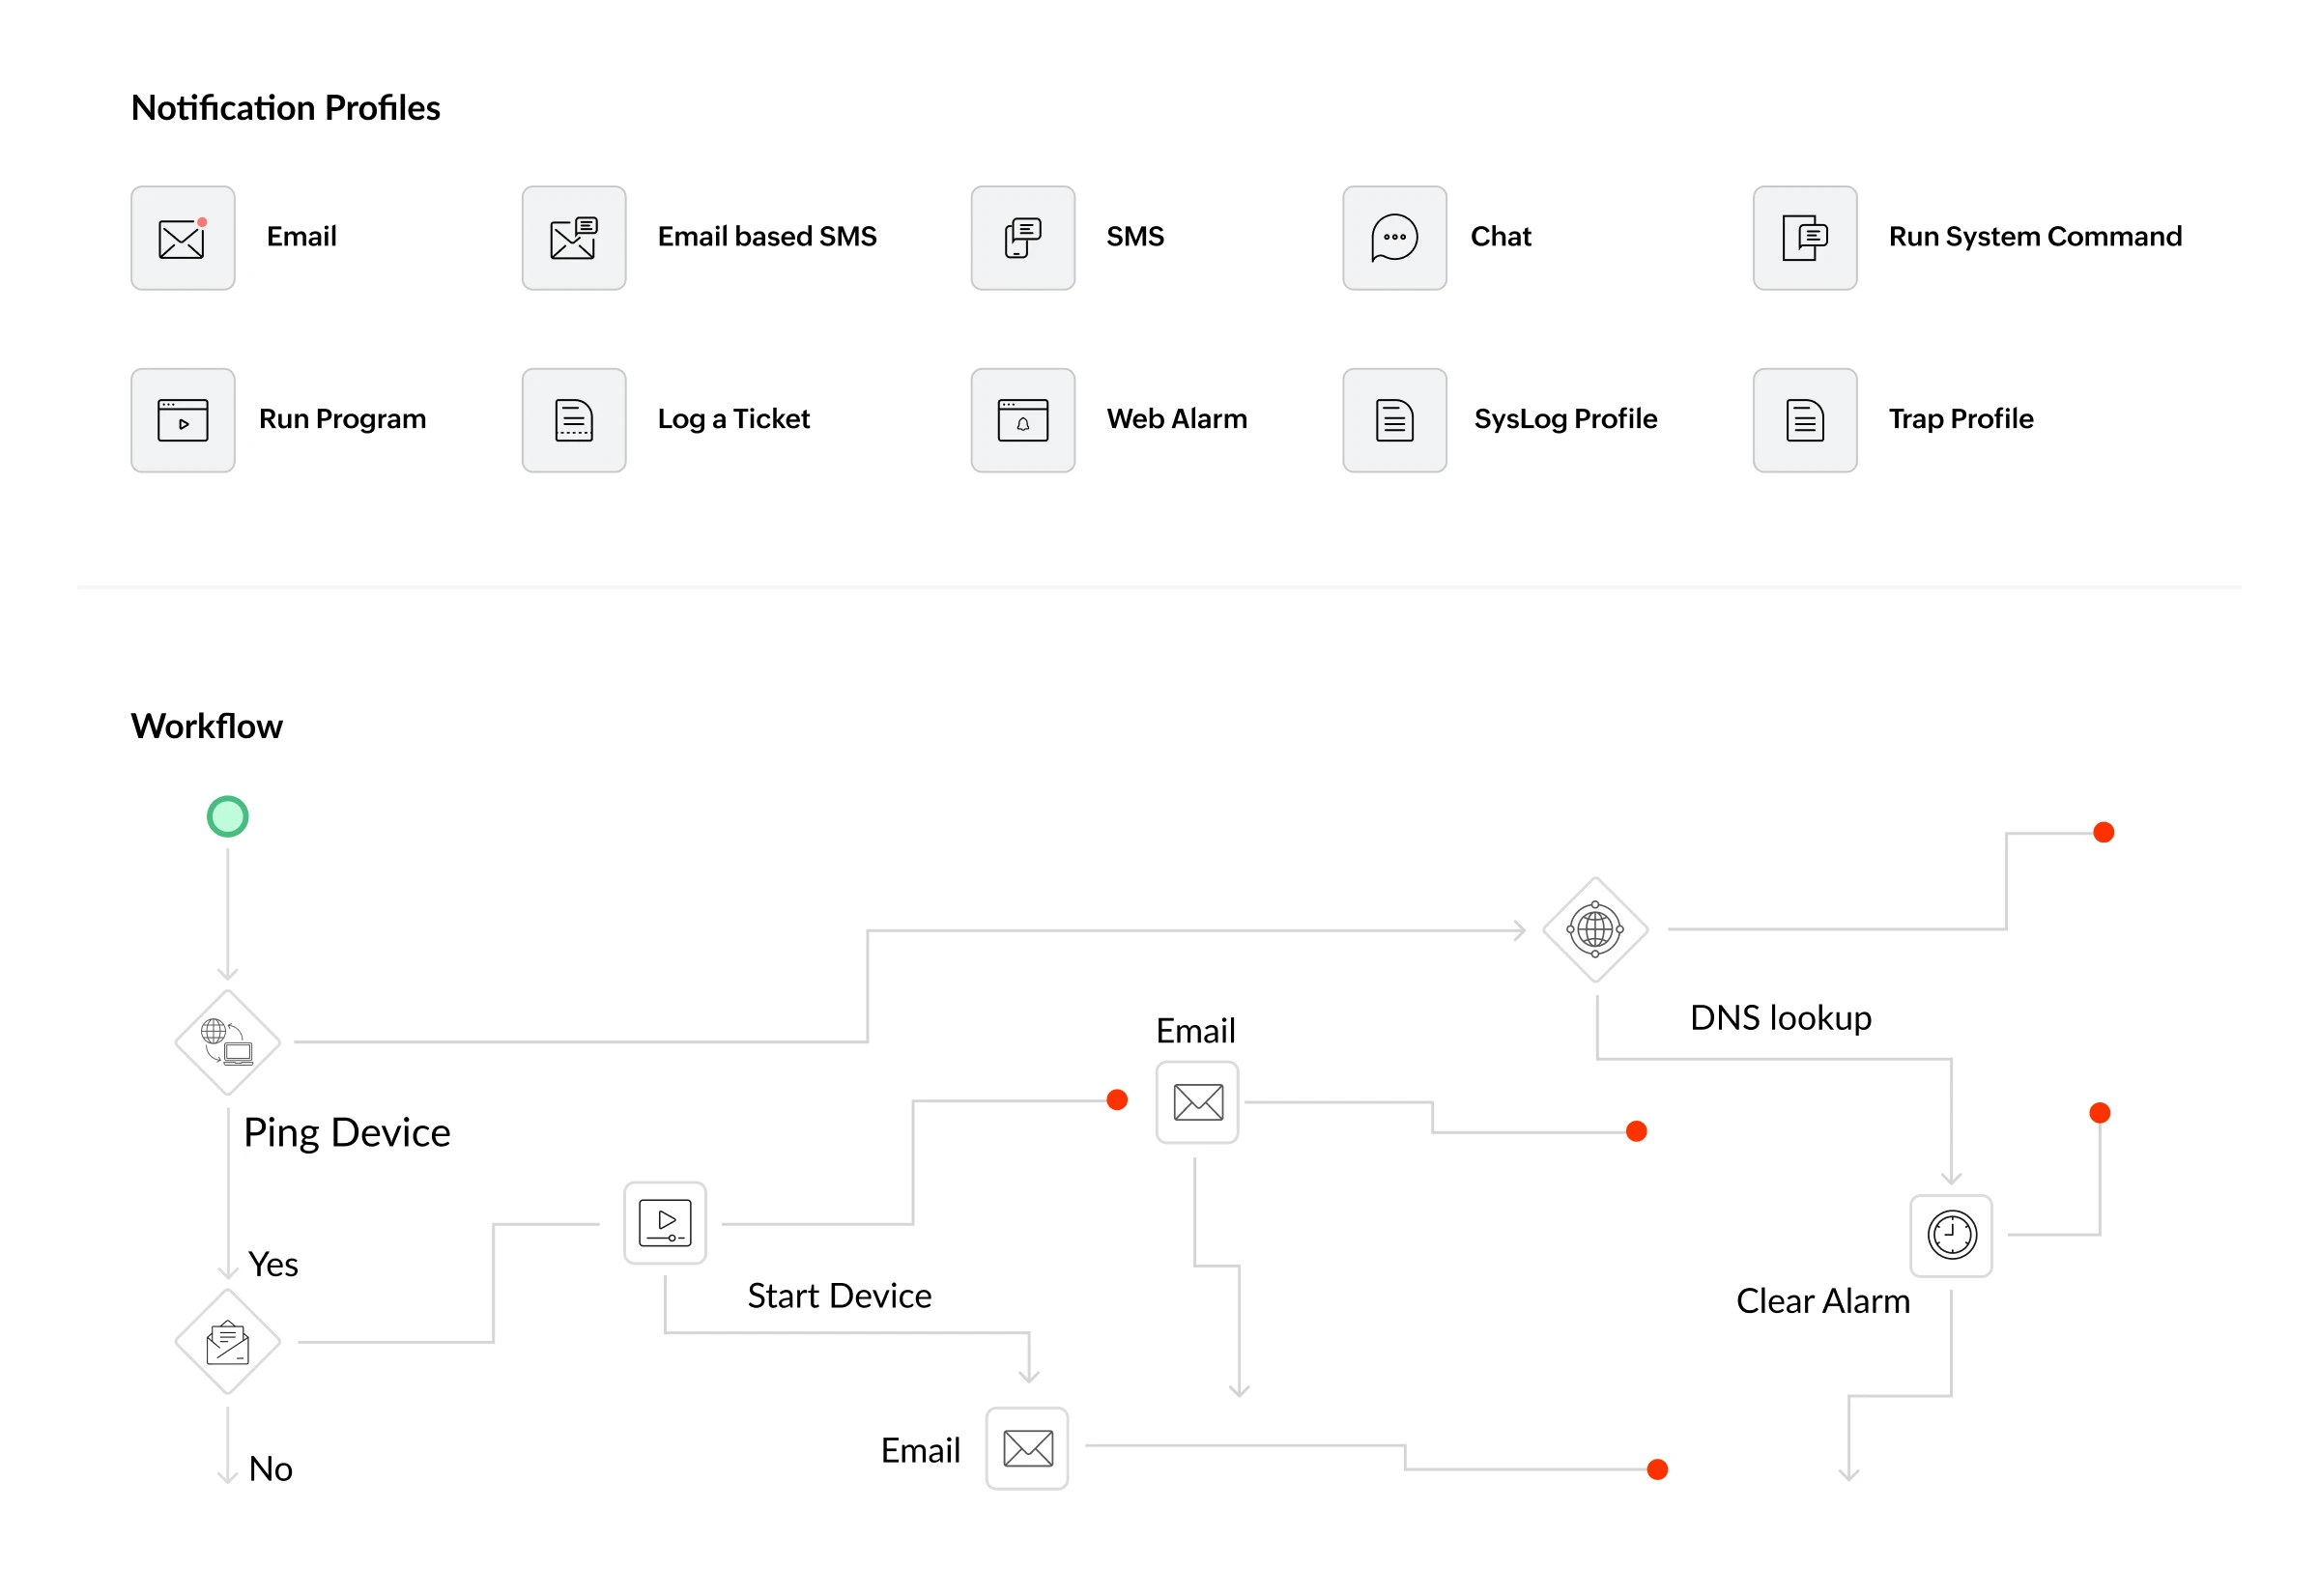
  • Detect real anomalies with ML-driven alerts:Machine learning continuously learns normal network behavior and triggers network alerts only when meaningful deviations occur, helping teams prevent unexpected disruptions.
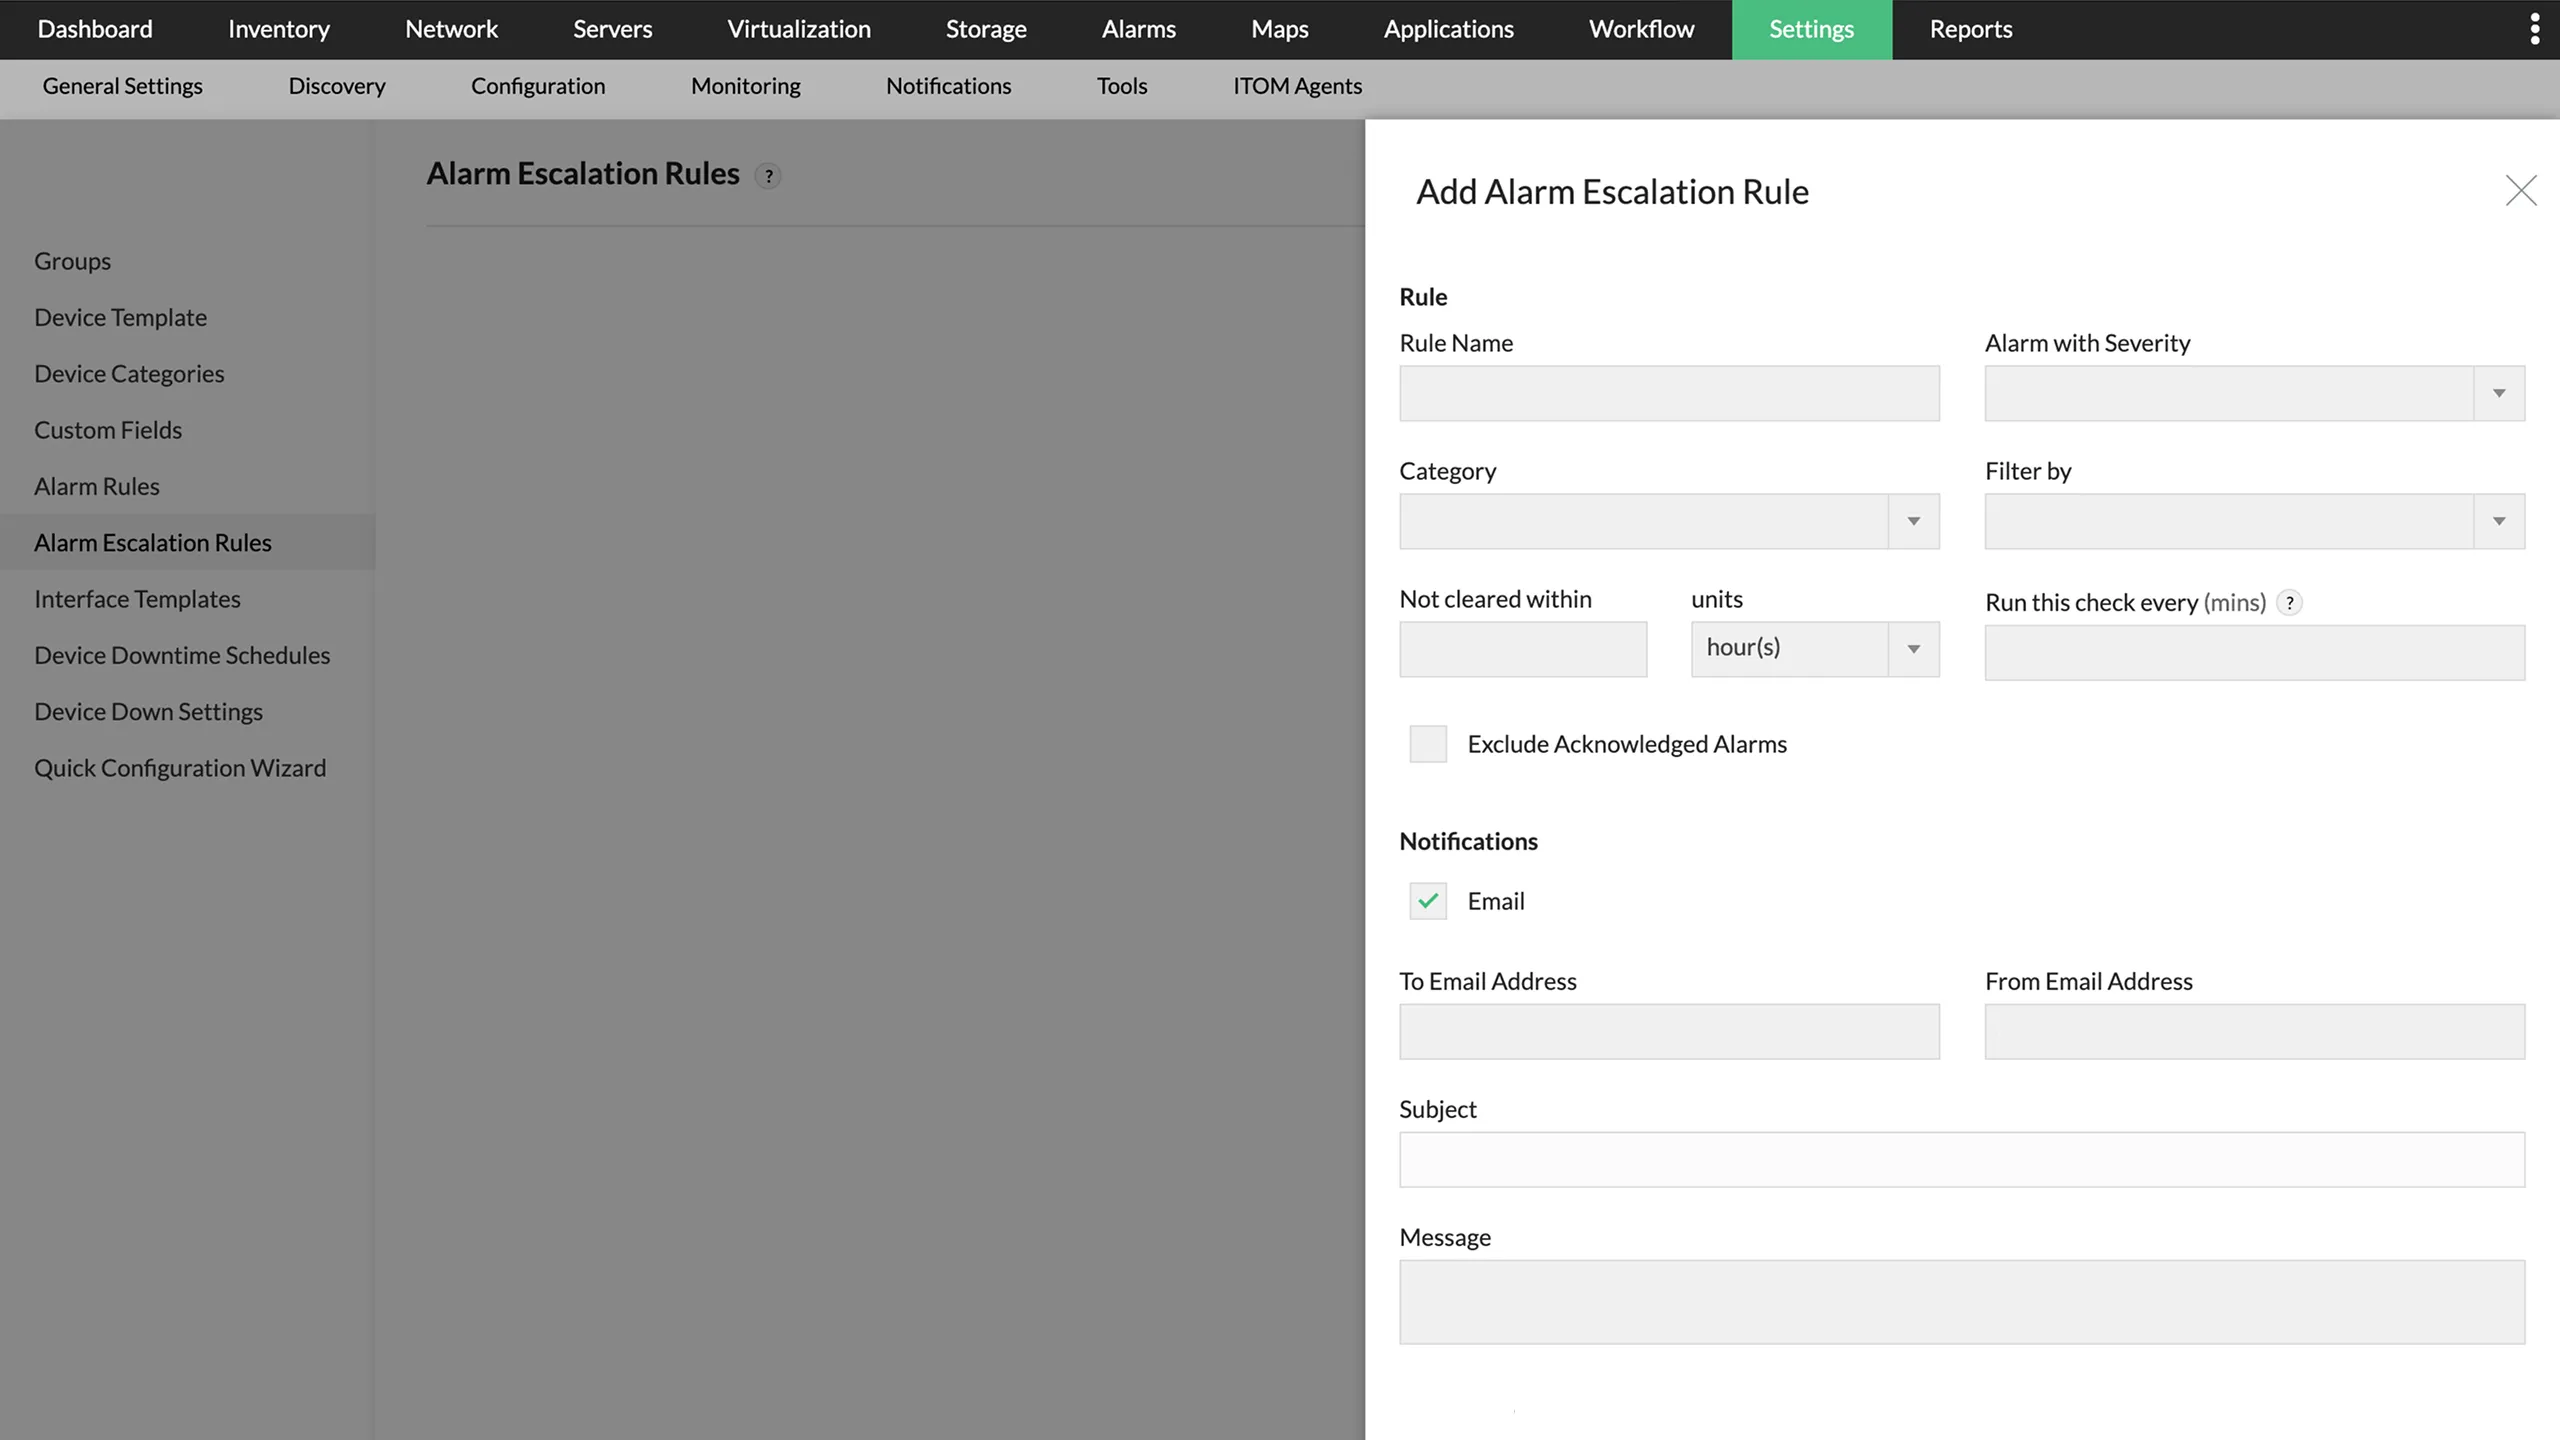
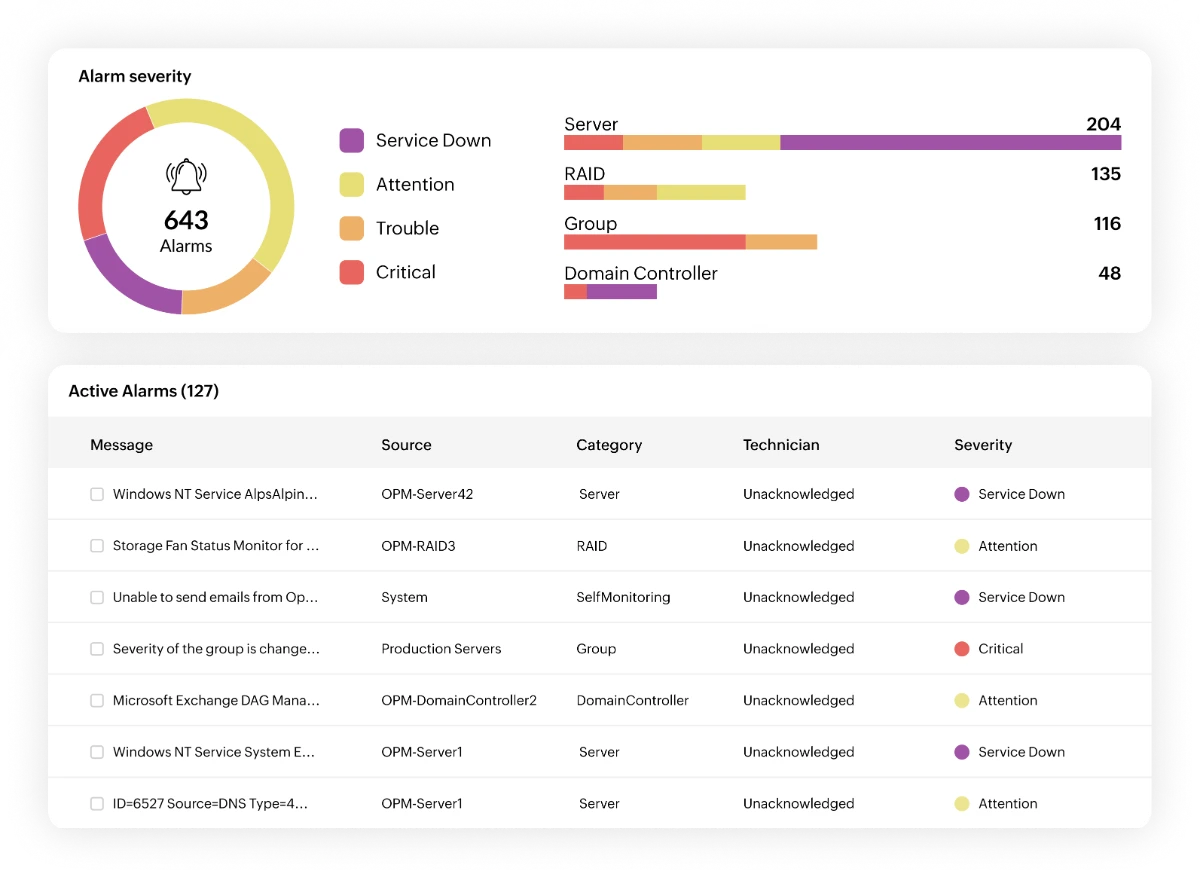
  • Focus on what matters, silence what doesn't: Alerts are automatically categorized into Critical, Trouble, Attention, and Service Down, so teams instantly know what impacts revenue and customer experience. No more wasting time on low-priority noise.
  • Gain full visibility with a contextual alarm console: View all alerts in a centralized console, filter them by severity, technician, or category, and use contextual alert details to quickly triage and resolve incidents.
Alert Detection
Alert Correlation

Topology-aware correlation to cut alert noise

Group related alerts together to quickly identify the real root cause.

  • Stop alert floods from a single underlying issue: When a single issue generates multiple related alerts, such as a CPU spike causing server latency, OpManager correlates and suppresses duplicate events. This transforms alert floods into one clear incident, allowing teams to quickly focus on the root cause.
  • Reduce alert fatigue with topology-aware intelligence: With uplink dependency mapping, OpManager understands how devices are connected. When an upstream device fails, alerts from dependent downstream devices are automatically suppressed, preventing cascading notifications across the network.
  • Pinpoint the exact failure point faster: Visual dependency mapping and performance correlation reveal exactly where and why the issue started; no guesswork required.

Alert pattern intelligence to eliminate repeat issues

Analyze historical alerts to detect recurring network problems early.

  • Spot recurring network issues early with alarm trend analysis: Historical alarm data reveals patterns such as repeated interface failures, bandwidth spikes, or unstable devices so teams can address underlying problems before they escalate.
  • See where incidents occur most across the network: Alarm summaries organize alerts by device and device group, helping teams quickly identify which parts of the infrastructure generate the most incidents.
  • Make smarter infrastructure decisions with real operational insights: By analyzing alert trends over time, teams can assess infrastructure stability and plan upgrades, capacity improvements, and preventive maintenance with confidence.
The traffic monitoring tool IT teams rely on

Automated alert escalation to accelerate incident response

Automate escalation workflows so urgent incidents never go unnoticed.

  • Automatically escalate unresolved critical alerts: If a critical alert isn't acknowledged within the defined time window, OpManager automatically escalates it to the next support tier, ensuring urgent issues never go unnoticed.
  • Route alerts based on service priority and SLAs: Align alerts with service-level commitments so high-impact incidents are instantly directed to the right teams for faster resolution.
  • Maintain consistent and reliable incident response: Predefined escalation workflows remove manual follow-ups, helping teams handle every critical alert quickly, consistently, and without delays.

Deliver alerts instantly across teams and tools

Ensure alerts reach the right teams and trigger faster incident response.

  • Reach the right teams through multiple alert channels: Notify teams through email, SMS, syslog messages, SNMP traps, web alarms, and collaboration tools such as Teams or Slack, ensuring critical incidents are seen and acted on immediately.
  • Trigger automated actions for faster incident response: Automatically execute scripts or commands when an alert occurs to initiate L1/L2 troubleshooting, helping teams resolve issues faster and prevent escalation.
  • Scale alerting workflows as your network grows: From simple alert routing for SMBs to multi-tier incident workflows for enterprises, OpManager adapts to networks of any size without adding operational complexity.
Multi-Channel Alerting

Turn alerts into automated actions across your toolchain

OpManager integrates natively with 20+ ITSM, collaboration, and automation platforms so every alert becomes an actionable workflow; no manual hand-offs, no missed notifications.

See why IT teams choose OpManager to reduce alert fatigue

Most monitoring tools generate alerts. OpManager makes them actionable.

Most network monitoring tools can generate alerts. The real challenge is delivering alerts that are meaningful, actionable, and easy to manage at scale. OpManager helps teams reduce alert noise, detect anomalies faster, and respond to incidents with better context.

What matters in network alertingWith OpManagerWithout monitoring / alerting
Alert noise reductionIntelligent alarm correlation and dependency mapping reduce unnecessary alerts.Large volumes of alerts that require constant manual filtering.
Accurate anomaly detectionML-powered adaptive thresholds detect real anomalies based on historical behavior.Static thresholds or reactive checks lead to missed issues and false alarms.
Context for faster troubleshootingAlerts include device relationships, performance data, and topology insights.Alerts appear as isolated events with limited context.
Incident response speedMulti-channel alerts with automated escalation ensure faster response.Delayed responses due to lack of prioritization and escalation workflows.
Operational simplicityCentralized alarm console with simple configuration and unified visibility.Requires manual effort and multiple tools to manage alerts effectively.

Industry use cases for network monitoring alerts

How can banks monitor VMs to prevent downtime in critical financial applications?

The scenario

A core banking application server begins experiencing high CPU utilization during peak transaction hours, triggering latency across payment processing systems.

The impact

Slow or failed transactions can disrupt customer payments, ATM withdrawals, and online banking services, directly affecting customer trust and regulatory compliance.

How OpManager helps

OpManager detects abnormal CPU behavior using ML-driven alerts and correlates related latency alerts across services. Intelligent alert correlation groups these events into a single incident, enabling IT teams to quickly identify the root cause and restore transaction systems before customers experience outages.

How to ensure VM performance in hospitals?

The scenario

A network switch connecting medical devices and hospital systems fails unexpectedly.

The impact

Critical systems such as patient monitoring, electronic health records, and imaging systems may become unreachable, potentially delaying patient care.

How OpManager helps

Topology-aware alerts immediately detect the device failure and suppress cascading alerts from dependent devices. Contextual alerts provide device details, severity, and timestamps, allowing IT teams to quickly fix the issue and restore connectivity for critical healthcare systems.

How do e-commerce platforms handle VM performance during traffic spikes?

The scenario

Bandwidth saturation occurs at a retail store during a major sales event, slowing down POS systems and payment gateways.

The impact

Checkout delays and payment failures can lead to lost sales and poor customer experience during peak revenue periods.

How OpManager helps

OpManager detects unusual traffic spikes using adaptive ML-based thresholds and triggers alerts when bandwidth usage exceeds normal patterns. Automated alerts notify IT teams instantly, allowing them to investigate congestion and restore optimal performance before transactions are impacted.

How to keep manufacturing VMs running without disruption?

The scenario

A network device connecting production line controllers experiences intermittent packet loss.

The impact

Communication delays between machines can slow production lines, disrupt automated processes, and reduce manufacturing efficiency.

How OpManager helps

Network monitoring alerts detect abnormal packet loss and performance degradation early. Alarm trend analysis reveals recurring instability in the affected device, enabling teams to proactively resolve infrastructure issues before production downtime occurs.

How do MSPs manage and monitor VMs across multiple clients?

The scenario

A service provider monitoring multiple client networks begins receiving hundreds of alerts from different devices during a network disruption.

The impact

Alert floods can overwhelm technicians, delay root cause identification, and slow incident response for multiple clients.

How OpManager helps

Alarm correlation automatically groups related alerts into a single actionable incident. With centralized alert visibility and multi-channel notifications, technicians can quickly prioritize incidents and resolve issues faster across multiple customer environments.

FAQs on network monitoring alerts

What are network monitoring alerts?


Network monitoring alerts are automated notifications triggered when network performance metrics exceed normal thresholds. In OpManager, alerts cover 3,000+ metrics like CPU, memory, bandwidth, and packet loss, and are classified into four severity levels—Critical, Trouble, Attention, and Service Down—so teams can prioritize issues instantly.

Why are network monitoring alerts important?


Network monitoring alerts help prevent downtime by detecting issues early—but only if they're accurate. OpManager uses ML-based adaptive thresholds to reduce false alerts from normal usage spikes, improving signal-to-noise ratio and enabling faster incident response.

What causes network monitoring alerts?


Alerts are triggered when metrics cross predefined limits—either static thresholds or ML-driven baselines. Common causes include high CPU usage, memory spikes, packet loss, bandwidth congestion, interface failures, and service outages. Correlation helps group related alerts into one root issue.

How do network monitoring alerts reduce downtime?


Alerts reduce downtime by notifying the right teams instantly. OpManager sends alerts via email, SMS, Slack, Teams, and more, and uses automated escalation to ensure unacknowledged issues are quickly addressed before impacting users.

What is alert fatigue in network monitoring?


Alert fatigue occurs when excessive or irrelevant alerts cause teams to ignore notifications. OpManager reduces alert fatigue using adaptive thresholds, alert correlation, and maintenance scheduling to eliminate false positives and duplicate alerts.

How do intelligent alerts improve network monitoring?


Intelligent alerts add context and automation by correlating related issues, identifying root causes, and highlighting patterns. With AI-driven insights and topology mapping, OpManager helps teams resolve problems faster and prevent recurring incidents.

What if your network alerts actually helped you act faster?

Request a demo to see how thousands of IT teams use OpManager to monitor networks, reduce alert noise, and resolve incidents quickly.

Evaluate OpManager:
Get a personalized product demo Configure a custom price quote
Trusted by over 25,000 customers globally

Loved by customers all over the world


“Easy Implementation, Excellent support & Lower Cost Tool - Team Lead, IT Services Industry”

Reviewer Role: Infrastructure and Operations

Company size: 500M - 1B USD

We have been using OpManager since 2011 and our overall experience has been excellent. The tool plays a vital role in providing the value to our organization and to the customers we are supporting.

“OpManager - 10 steps ahead of the competition - Network Services Manager, Government Organization”

Reviewer Role: Infrastructure and Operations

Company size: 5,000 - 50,000 Employees

I have a long standing relationship with ManageEngine. OpManager has always been the most comprehensive and easy to use product on the market.

“Great Monitoring tool - CIO in Finance Industry”

Reviewer Role: CIO

Company size: 1B - 3B USD

ManageEngine provides a suite of tools that have made improvements to the availability of our internal applications. From monitoring, management and alerting, we have been able to achieve peak performance within our data center.

Capterra
Getapp
Software Advice
G2
Altaleb Alshenqiti

“OpManager helps me monitor all aspects of the data-center and equipment like servers, switches and routers. It is fast, intuitive and centralized.”

Altaleb Alshenqiti

NGHA

Donald Stewart

“Donald Stewart, IT Manager of Crest Industries is happy with ManageEngine OpManager for its end-to-end network monitoring.”

Donald Stewart

IT Manager, Crest Industries