OpManager is trusted by 5000+ businesses

Saint Gobain
NASA
Time Warner Cable
Loreal Paris
Siemens
DHL

Key server monitoring capabilities supported by OpManager

OpManager features agent-based and agent-less mechanisms to monitor server devices. After scanning and discovering your devices, OpManager identifies your servers and classifies them based on various factors like vendor, type, and functionality. You can monitor server uptime, processes, services, as well as key metrics like the uptime, CPU, memory, processes, services, and disk space. Let's take a look at each of these capabilities.

Ensure 24/7 uptime with server availability monitoring

Ensure high-availability for your servers with regular uptime checks. OpManager uses ICMP, SNMP, and TCP to check the availability of your devices and maintains an availability timeline for each device. You can customize the monitoring interval for uptime checks and set up alarms for non-availability. Moreover, you can also track the response time and packet loss to ensure quality as well as availability.

Availability statistics and memory utilization in OpManager
Performance monitoring in OpManager

Get a glimpse of your server performance by tracking KPIs

Keep track of server performance with dedicated, vendor-specific performance monitors for metrics like CPU, memory, traffic, CPU temperature, and disk space. OpManager lets you set up three-level alarm thresholds for monitored metrics and generate context-rich alarms and graphs based on performance data.

Manage critical services and processes effortlessly

Get instant alarms for process and service outages. You can use OpManager to fetch all the active processes and services running in your servers and set up regular monitoring checks for them. When any process or service is not running, you get an alarm specifying the outage, the process or service, and the device. You can also configure OpManager to eliminate and restart services or processes remotely.

Monitoring the response time and KPIs for services and processes in OpManager
Server rack views and datacenter visualization in OpManager

Visualize server arrays and datacenters

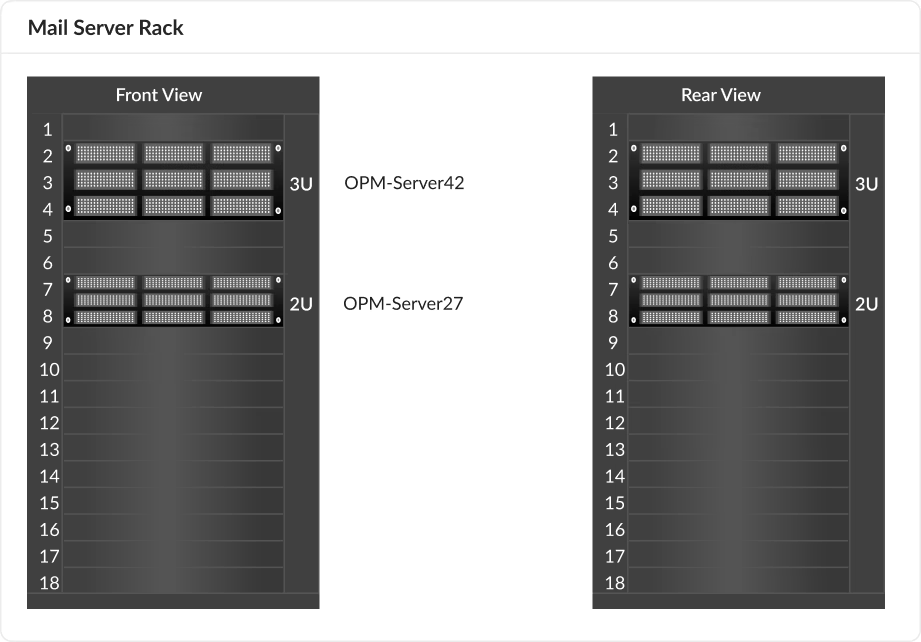
Keep an eye on server racks to enhance your monitoring capabilities. You can map server racks with rack builders, map out datacenter floors, virtual hosts and VMs, layer 2 topologies, and more with OpManager's server mapping features. You can also leverage dashboards and graphs to analyze server performance with a quick glance. Dashboards and graphs colour-code and time-stamp server information to help you obtain quick, executable insights.

Leverage automated incident response to resolve server issues

Prevent prolonged downtime and outages with OpManager's automated workflows. You can create sequential, outcome-based, workflow actions. OpManager offers over 70 actions in a code-free, drag-and-drop workflow builder. All you have to do is arrange each action based on the outcome of the previous action to create an intuitive remediation workflow. When it comes to servers, you can use workflows to execute actions like- restarting services, spinning up VMs, running scripts, and so on.

Automated workflow response in OpManager
Event log monitoring in OpManager

Keep constant watch over your servers by monitoring logs

Monitor server logs like Windows event logs and syslogs to stay aware of your servers at all times. You can set up alarms for specific Windows event logs and create rules to alert you for sys logs that fall under the rules. You can also monitor application logs with preconfigured rules for Exchange, IIS, MS SQL, and ISA servers.

What makes server monitoring with OpManager unique?


ML-powered server management

OpManager features a powerful ML engine that uses advanced algorithms to predict the performance of the monitored systems. With adaptive thresholds, you can use OpManager to calculate, set, and adjust alarms thresholds for all monitored metrics. This improves anomaly detection and eliminates alarm flooding and false positives.


Multi-vendor monitoring support

Monitor and manage your multi-vendor environment, including physical and virtual servers, effortlessly from a unified console with OpManager. Seamlessly manage physical servers from leading vendors like Dell, HP, IBM, Huawei, Oracle, and Lenovo as well as virtual servers from platforms such as VMware, Hyper-V, Nutanix, Xen, and Proxmox.


All-in-one server monitoring (MSSQL, Exchange, DC, IPMI)

Whether your servers are used for running database operations, application hosting, mail, or domain management, OpManager can monitor them. You can monitor domain controllers, use IPMI to manage server hardware, track MS SQL transactions, monitor Exchange servers, and monitor different servers with dedicated metrics.

What are the key server performance metrics to look for?

  • CPU or Memory
    Utilization:
    Percentage of CPU or RAM in use. You can set alarm thresholds for higher values to prevent bottlenecks, poor performance, or resource scarcity.
  • Active
    Transactions:
    Number of ongoing server operations. Helps identify load, potential deadlocks, or slow processes impacting performance.
  • Network
    Bandwidth Usage:
    Amount of data transferred over the network. High usage indicates heavy traffic, saturation, or data transfer operations.
  • Data
    Files Size:
    Cumulative size of application/database data files. You can track growth to perform capacity planning.
  • Packet
    Loss Rate:
    Percentage of data packets failing to reach destination. High rates indicate network issues.
  • Active Database
    Connections:
    Number of open database connections. High counts indicate application demand, connection pooling issues, or resource limits.
  • Interface
    Error Rate:
    Percentage of errors on network interfaces. High rates suggest physical network problems, impacting server connectivity.
  • Logins
    per Second:
    Rate of server authentications. Spikes can indicate high demand or potential security threats.
  • IO Read
    and Write Rate:
    Speed of disk read/write operations. High rates suggest disk-bound applications or I/O bottlenecks.
  • Transactions
    per Second:
    Number of completed server operations per second. Indicates server throughput and overall performance capacity.
  • Total
    Active Locks:
    Number of held locks on server resources. High counts indicate contention, poor concurrency, or potential deadlocks.
  • Log Files
    Used Percentage:
    Disk space consumed by log files. You can set up monitors to ensure log rotation, archiving, and to prevent disk space exhaustion.
  • Average
    Disk Latency:
    Average time for disk I/O operations. High latency indicates slow disk performance, impacting application responsiveness.
  • Average
    Lock Wait Time:
    Average time processes wait for locks. High wait times indicate resource contention, leading to performance degradation.
  • Partition Details
    of the Device:
    Information about server disk partitions. Helps with capacity planning, identifying imbalances, and space management.
  • Number of Deadlocks
    per Second:
    Frequency of deadlocks. High rates severely impact application performance and require immediate resolution.
  • Data
    Space of DB:
    Total disk space consumed by the database. Monitor growth to perform capacity planning and efficient database management.
  • Instance
    Count:
    Number of running application/service instances. Helps ensure scalability, resource allocation, and service availability.
  • Cache
    Hit Ratio:
    Percentage of requests served from cache. High ratio indicates efficient caching, faster responses, and reduced load.
  • Thread
    Count:
    Total number of active threads/processes. High counts can indicate resource contention, inefficient code, or memory exhaustion.

How server monitoring works with OpManager

Supported flavours for Windows servers Supported flavours for Linux servers Server monitoring protocols
Windows NT, 2000 Red hat enterprise SNMP v1 and v2c
Windows 2003 SUSE SNMP v3
Windows 2008, 2008 R2 Ubuntu CLI
Windows 2012, 2012 R2 Fedora WMI
Windows 2016 Debian PrismAPI
Windows 2019 CentOS APIs

FAQs on server monitoring

What are the server monitoring requirements in OpManager?


OpManager doesn't have any specific requirements for server monitoring. Servers are included in OpManager's regular device-based license. You can monitor unlimited metrics for each server in your license, including: uptime, performance, hardware, and the connected interfaces.

To discover, identify, classify, and monitor servers, OpManage uses network protocols like

  • SNMP
  • WMI
  • CLI
  • PrismAPI

You have to provide credentials for the respective servers for OpManager to reach and collect data from the servers. Alternatively, you can install a lightweight monitoring agent.

What is the recommended monitoring interval for server monitoring?


OpManager lets you set up monitoring intervals ranging from 30 seconds to one hour or more for your devices. Depending upon the criticality of the server device, you can choose the right monitoring interval.

For instance, if your server is hosting a user-facing service that requires high availability and performance, you can monitor the server at 30 second intervals. This gives you a better chance to detect issues faster.

You also have to keep in mind that smaller monitoring intervals can increase the load on OpManager's monitoring server. If you add more than the recommended amount of low intervals, performance can be impacted.

OpManager also has an option to track specific metrics at 1-second intervals. These real-time 'heart beat' monitors can be set up in dashboards to track mission-critical resources.

How to set up alarms for server performance metrics in OpManager?


How does ML-powered adaptive thresholds calculate thresholds for all metrics accurately?


OpManager uses machine learning to automate the process of setting up alarms for various performance metrics. Adaptive thresholds use algorithms to predict the 'normal' or 'expected' value for each metric. This is then set as thresholds for each metric and updated every hour automatically.

Adaptive thresholds needs up to 14 days of prior performance data to set alarms accurately, and as data collection continues, the accuracy increases. Given enough training data and time, adaptive thresholds can reach an accuracy of up to 90 - 95%.

Other than uptime and performance, what can OpManager monitor for servers?


When it comes to servers OpManager can also monitor things like:

  • Files and folders:Metrics like folder/file size, age, existence, and the presence of specific strings within files.
  • URLs:Track the availability and check for specific strings.
  • You can also create custom scripts using Perl, VB script, Powershell script, Shell script, etc and monitor specific metrics from your server devices.

How does server rack views and datacenter floor views help?


Rack views and datacenter floor views are server visualization tools used to track the location, uptime, and health of datacenter servers.

A rack view is a simulation of a server rack within which you can drag and drop server devices. Once racks are built, you can add them to a datacenter floor view. You can also add other things like walls and walkways in the floor view.

Once built, you have a visualization of your datacenter where each server can be tracked with a number on the rack and an alapha-numeric grid on the floor. So, if you want to direct your technician to a specific server, you can just tell them the exact location from the datacenter floor view. These floor views can also be rendered in 2D or 3D.

Is OpManager suited for home servers or datacenter server models?


OpManager is versatile a server monitoring tool offering extensive monitoring features.

For home servers:You can use OpManager's standard or free edition to track uptime and basic performance metrics like CPU and memory.

For datacenter servers:You can use OpManager's professional or enterprise edition to ensure 99.999 percent availability, fault resilience, and automated remediation. You get visibility into server infrastructure, hardware, hosted VMs, application performance, and service delivery architectures from the network end to the application end.

Why is OpManager considered a top choice for server monitoring?


OpManager is preferred by IT admins around the world for its simplicity, extensive feature offering, and affordable pricing.

  • OpManager monitors 300+ dedicated performance metrics for 130+ server vendors, including physical and virtual servers, domain controllers, exchange servers, MS SQL, and more.
  • Monitoring and licensing is intuitive and has little to no learning curve.
  • Most importantly, OpManager's server monitoring features are included with its network performance monitoring feature sets and don't require additional licensing. This makes server monitoring with OpManager extremely cost-effective compared to other tools.

Comprehensive server monitoring with a unified console

Loved by customers all over the world


“Easy Implementation, Excellent support & Lower Cost Tool - Team Lead, IT Services Industry”

Reviewer Role: Infrastructure and Operations

Company size: 500M - 1B USD

We have been using OpManager since 2011 and our overall experience has been excellent. The tool plays a vital role in providing the value to our organization and to the customers we are supporting. The support is excellent and staff takes full responsibilities in resolving the issues. Innovation is never stopping and clearly visible with newer versions.

“OpManager - 10 steps ahead of the competition, one step away from being unequaled - Network Services Manager, Government Organization”

Reviewer Role: Infrastructure and Operations

Company size: 5,000 - 50,000 Employees

I have a long standing relationship with ManageEngine. OpManager has always missed one or two features that would make it truly the best tool on the market, but over it is the most comprehensive and easy to use the product on the market.

“Easy Implementation with a feature rich catalogue, support has some room for improvement - NOC Manager, IT Services Industry”

Reviewer Role: Program and Portfolio Management

Company size: 500M - 1B USD

The vendor has been supportive during the implementation & POC phases providing trial licenses. Feature requests and feedbacks is usually acted upon swiftly. There was sufficient vendor support during the implementation phase. After deployment, the support is more than adequate, where the vendor could make some improvements.

“Great Monitoring tool - CIO in Finance Industry”

Reviewer Role: CIO

Company size: 1B - 3B USD

ManageEngine provides a suite of tools that have made improvements to the availability of our internal applications. From monitoring, management and alerting, we have been able to peak performance within our data center.

“Simple Implementation, Easy To Use. Very Intuitive. - Principle Engineer in IT Services”

Reviewer Role: Enterprise Architecture and Technology Innovation

Company size: 250M - 500M USD


ManageEngine support was responsive to all our queries.

Capterra
Getapp
Software Advice
G2
Altaleb

 Alshenqiti

“OpManager helps me monitor all aspects of the data-center and equipment like servers, switches and routers. It is fast, intuitive and centralized and you do not need to be an expert to deal with OpManager.”

Altaleb Alshenqiti

NGHA

Donald Stewart

“Donald Stewart, IT Manager of Crest Industries is happy with ManageEngine OpManager for its end-to-end network monitoring software. It is easy-to-use and offers fault and performance management for router.”

Donald Stewart

IT Manager, Crest Industries

John Rosser

“John Rosser, MIS Manager of Yale Chase talks about the proactive nature of ManageEngine OpManager & how his organisation gained value from it.”

John Rosser

MIS Manager


 Pricing  Get Quote