With the growing need for enterprise networks, organizations are finding it increasingly difficult to monitor and manage their network infrastructure. Network admins are turning to additional tools and resources that could make their jobs a little easier, particularly in regards to troubleshooting.
Currently, network admins largely use simple, freely available utilities like ping tools, Syslog forwarders, and ipconfig to assist their network monitoring and troubleshooting efforts. One of the most crucial tools being used in network troubleshooting is the traceroute, and it is widely used to check connectivity and continuity issues within your network. Read through to unwrap everything about the network traceroute tool.
Get to know:
- What is the purpose of a network traceroute tool?
- How does traceroute work?
- How is the traceroute tool useful for troubleshooting network issues?
- Integrated traceroute capabilities with OpManager
What is the purpose of a network traceroute tool?
In the simplest sense, a network traceroute tool for Windows/Linux is used to check the continuity of a network connection from a source to a destination device. It sends a specific amount of data to your end device and checks if the data transmission occurs without any issues to and from the device. A tool for traceroute can be used for the following purposes:
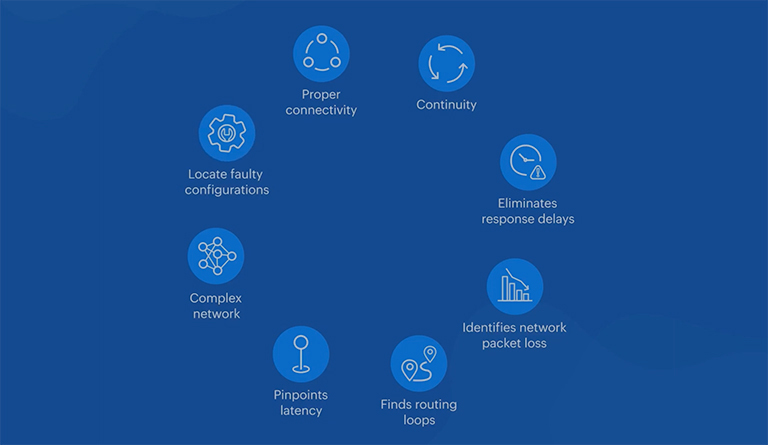
- To ensure proper connectivity between devices by tracing each step along the transmission path.
- To identify network latency or packet loss issues along the path.
- To locate faulty configurations that create network loops, resulting in total packet loss.
- To accurately identify the source of the response delay.
Hence, the traceroute test tool is mandatory in a network.
How does traceroute work?
Traceroute analysis is a very simple network operation, but it provides many valuable troubleshooting data for admins. When you run a Windows traceroute tool or Linux traceroute tool, these are the technical actions that are carried out:
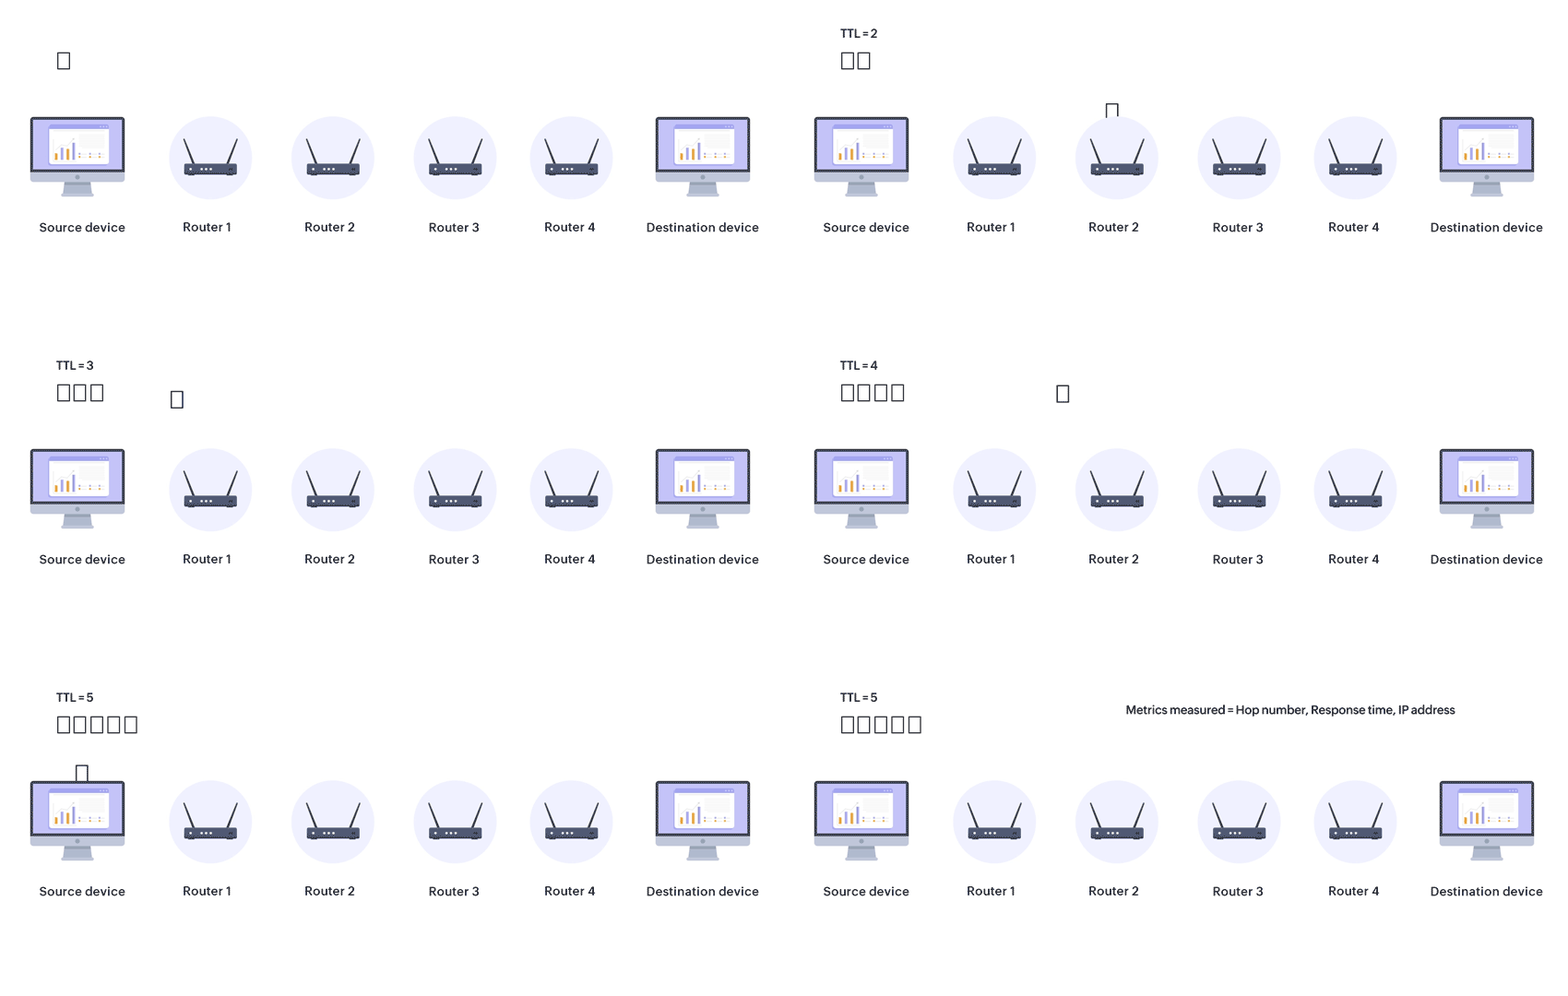
- Once a destination IP/DNS is provided and the command is executed, the device identifies the shortest path to the destination and sends four packets of data to the nearest device on the path. This is performed using the IPMI protocol.
- The nearest device successfully receives the traceroute request and sends back the four packets. Now the IP of that device is recorded, along with the number of hops to reach that device (one in this case) and the response time.M
- The same process is repeated for all devices along the path, with the number of hops progressively increasing as the packets move towards the destination. For each step, all the metrics mentioned above are recorded.
- To ensure that the data is as accurate as possible, each packet is sent to every device a total of three times, and for each attempt, the average response time for the four packets is displayed in the results.
- Once the packets reach the final step, the destination device sends the packets back to the source one last time. Now the device's IP, the number of hops, and the response times are aggregated and displayed in a table, starting from the closest device and ending with the destination device.
- If any packet loss issues were detected on the path, some or all of the corresponding response time values would be displayed as empty. Similarly, if there were latency issues for a device on the path, the response times would be significantly high, which will help you identify the faulty device.
Hence, a dedicated network analysis tool for traceroute capabilities is essential.
How is the traceroute tool useful for troubleshooting network issues?
Assume that you are a member of a network administration team for a large enterprise. A few employees working from a remote location have a server on the premises of the organization with critical application data, and this server has been responding very slowly for the past 30 minutes or so, resulting in a poor user experience. This has been reported as critical, and you have been asked to troubleshoot this issue.
In this case, you can initially perform traceroute monitoring of the server from the premises to identify local connectivity issues. If no issues show up, you can then try again from an end user's device to find where the response is getting slowed down or lost. By tracing every step along the path, the traceroute tool for networking will give you detailed data that will enable you to accurately identify which part of the network is causing the issue. For example, by looking at the individual response times for each hop, the admin can determine which part or device in the network has the highest response times and initiate the troubleshooting actions from that point.
Learn about OpManager's highly potential traceroute monitoring tool below.
Integrated traceroute capabilities with OpManager
With OpManager, our integrated network monitoring solution, you need not look far to make use of traceroute in your troubleshooting processes. The traceroute software is integrated into the product by default, and it can be accessed from the Device Snapshot page of any device that has been discovered in OpManager.
With OpManager's best traceroute tool, built right into the framework of the product, your troubleshooting tasks become much easier and more efficient. Simply click the traceroute button on the Device Snapshot page, and OpManager will run a thorough traceroute action from the server where the product is installed to the end device and display the critical metrics mentioned above.
The response times from the server to the destination device will be displayed for every device along the path, along with the number of hops. This will help you get a quick idea of the underlying network issues between your end device and OpManager's traceroute tool, as well as where the response times are the highest, thereby helping you identify performance bottlenecks and underperforming devices.
FAQs on Traceroute tool
What is a traceroute tool?
+How to do a traceroute?
+What is traceroute used for?
+Why is a traceroute tool important?
+Try our integrated traceroute solution as a part of OpManager's comprehensive network monitoring software.
Download 30-day free trialCustomer reviews
Case Studies - OpManager
Awards & Honors
- Recognized as a May 2019 Gartner Peer Insights Customers' Choice for Network Performance Monitoring and Diagnostics Software
- Recognised as an April 2019 Gartner Peer Insights Customers' Choice for IT Infrastructure Monitoring Tools.
- Network Management and Monitor Vendor of the Year 2018, 2019
- Entered the 2019 Gartner NPMD Magic Quadrant.
- Ranked #2 in the Infotech Research Software Reviews Data Quadrant 2018.


