Uptime is a measure of system reliability, expressed as the percentage of time a machine has been working and available. When referring to an IT network, uptime is the measure of availability of network devices, websites, and other services. Network uptime is often measured in percentiles, such as “five 9s,” meaning a system that is operational 99.999 percent of the time. The goal of network uptime monitoring is to have 99.999 percent availability, which is less than five minutes of downtime per year. Downtime is the period of time when a system is not operational, the opposite of uptime.
The need to monitor network uptime
A network uptime monitoring tool proactively monitors your entire IT network environment to ensure that it is available and working. Think of uptime monitoring as your 24/7 trusted online security guard. When the network uptime monitor notices a network device or service is down, it instantly notifies you, from a single dashboard so that your network administrators can resolve the underlying problem before it becomes too serious. The objective of network uptime monitoring is to ensure your network operations are uninterrupted as much as possible.
The terms network uptime and downtime are used to define the level of success provided by IT services. A service level agreement (SLA) often includes uptime and downtime ratios that show how much time a service is expected to remain operational. IT professionals use uptime to refer to a total consecutive amount of operational time.
How does network uptime monitor work?
Network uptime monitoring gives you the visibility you need to stay one step ahead of potential issues. By showing live network performance data in an easy-to-read interface, network uptime monitoring software helps you identify outages that could cause bottlenecks. Being able to detect threats in real time means you can be informed whenever and wherever, and instantly take a corrective or defensive stance. You save both time and money, and you no longer need a physical system administrator to be present all the time to perform manual checks. Network uptime monitoring tools:
- Track the availability of network devices (network device uptime monitoring) and bandwidth usage to detect any potential bottlenecks.
- Monitor your servers’ uptime, including that of the DNS server, SQL server, mail server, FTP server, and virtual servers.
- Monitor your website’s availability and checks for broken links.
- Identify the root cause of downtime and network performance issues.
- Report on SLAs: Generates SLA reports to help you track availability and performance so you can meet your SLA commitments with your clients.
ManageEngine OpManager: The best network uptime monitor for your websites, servers and devices
ManageEngine OpManager, a network uptime monitor, helps ensure that all the network devices, services, and websites are up and running 24/7 continuously. OpManager's interface provides real-time statistics about network uptime and the availability of individual services. The dashboard displays reports on the status and health of network devices, services, and websites using visual cues like green, yellow and red indicators that help you zero in on key metrics.
OpManager can monitor various aspects of your network uptime including:
Network uptime monitoring: Devices
Continuously monitors your entire network for its uptime and network availability. OpManager's network uptime monitor sends a ping to the monitored devices every two minutes. If there is no response after two consecutive pings, then OpManager will consider the device unavailable. The number of pings and their time interval can be assigned depending on business need.
OpManager polls the device for availability using ICMP Ping. The ping serves as an effective tool to detect the availability of devices for an IT admin.
For non-ICMP environment, especially to monitor uptime for your edge router or DMZ zone devices, you can use Telnet instead. The default availability polling interval is five minutes and you can customize it to a specific device group or for a particular device, based on your need.
Network uptime monitoring: Interfaces
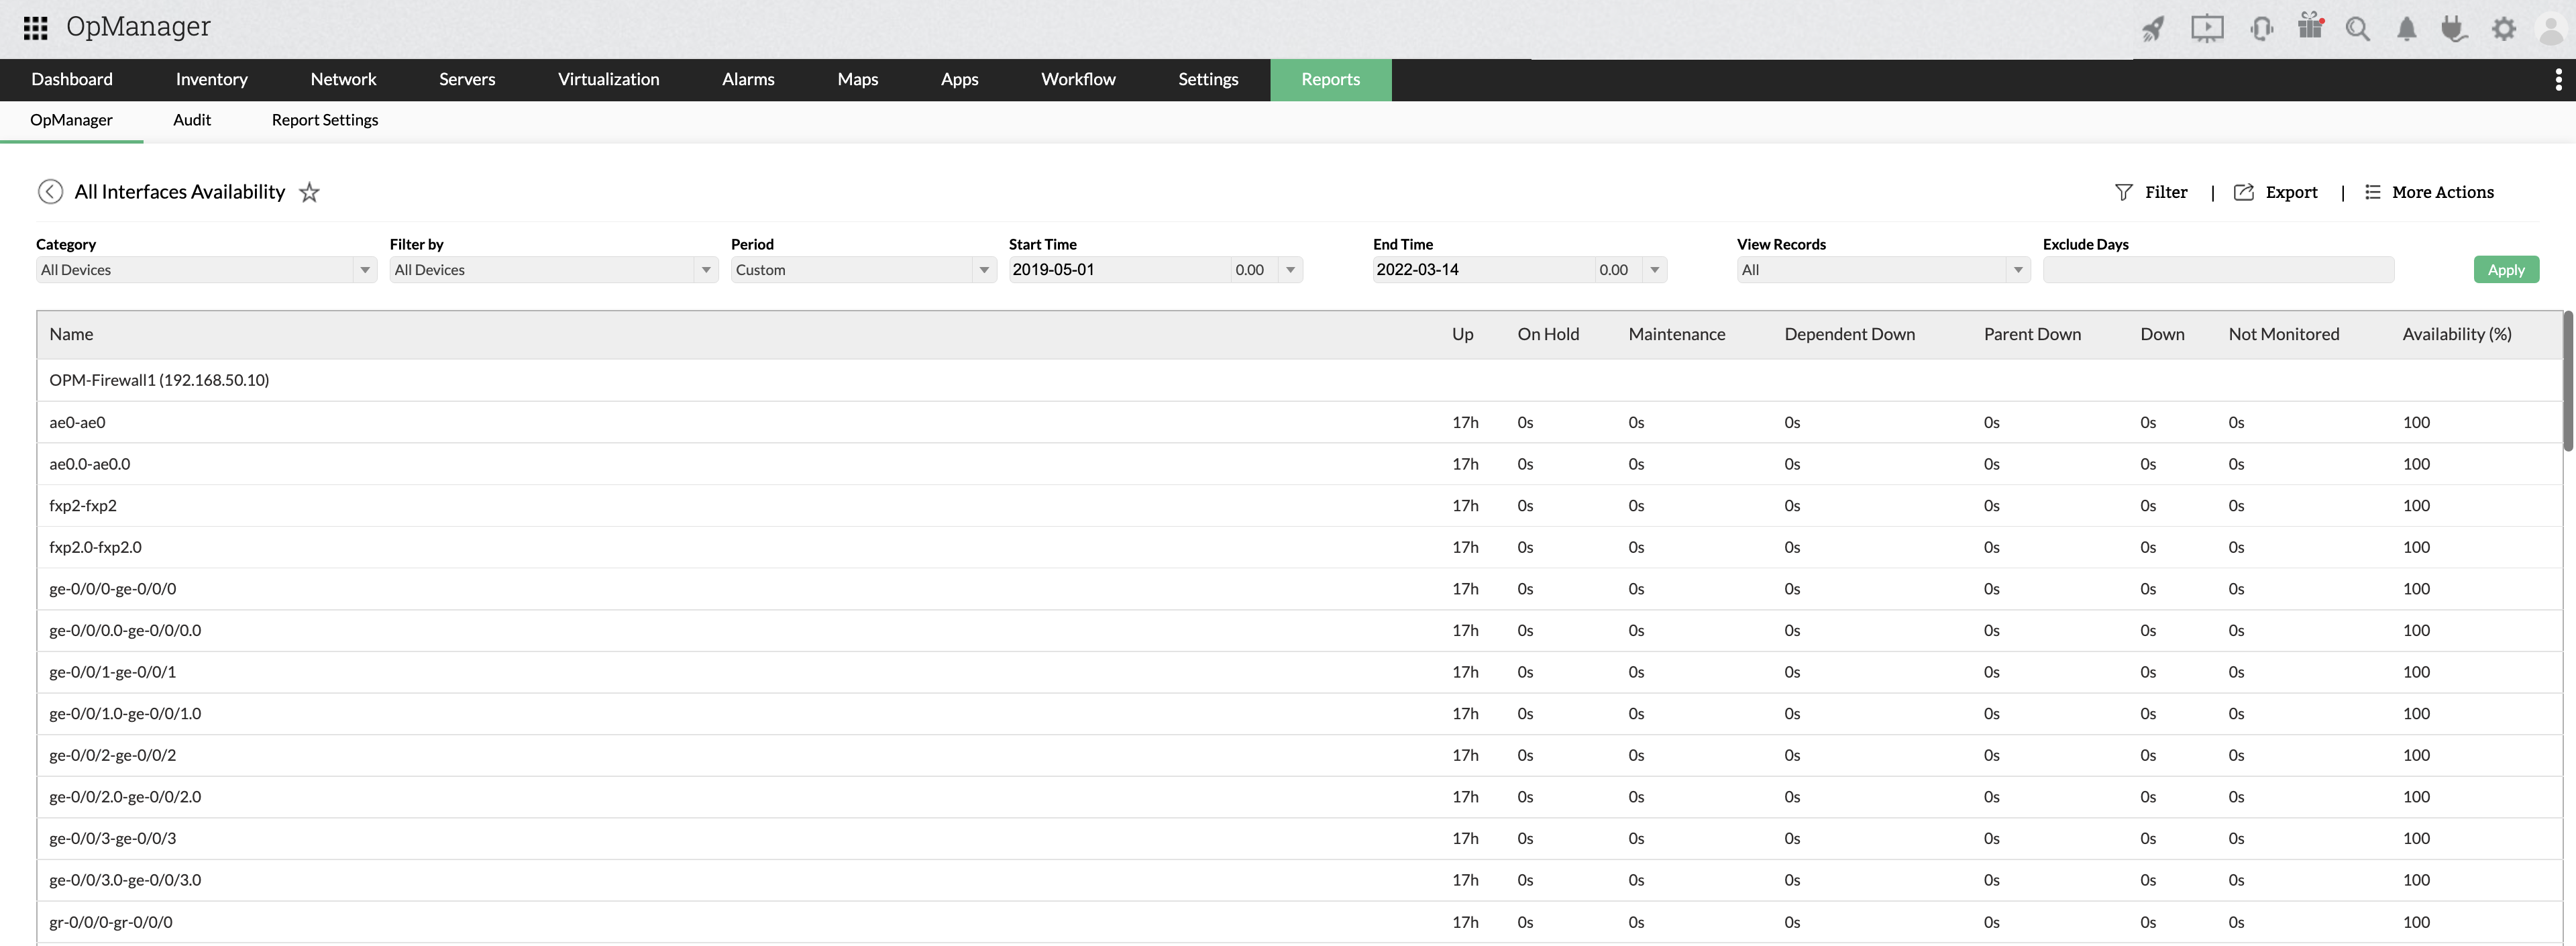
OpManager's network uptime monitor provides an monitoring Agent based or SNMP based monitoring to check interface uptime and port availability for each element in the enterprise network and IT infrastructure. It provides uptime report showing interface availability on a daily, weekly, monthly, or custom period to measure your network level availability and ensure that your SLAs are being met. These interface or port statuses are propagated across multi facets through individual device status, Layer 2 network maps, business view or custom device groups, and network weather maps.
Network uptime monitoring: Servers
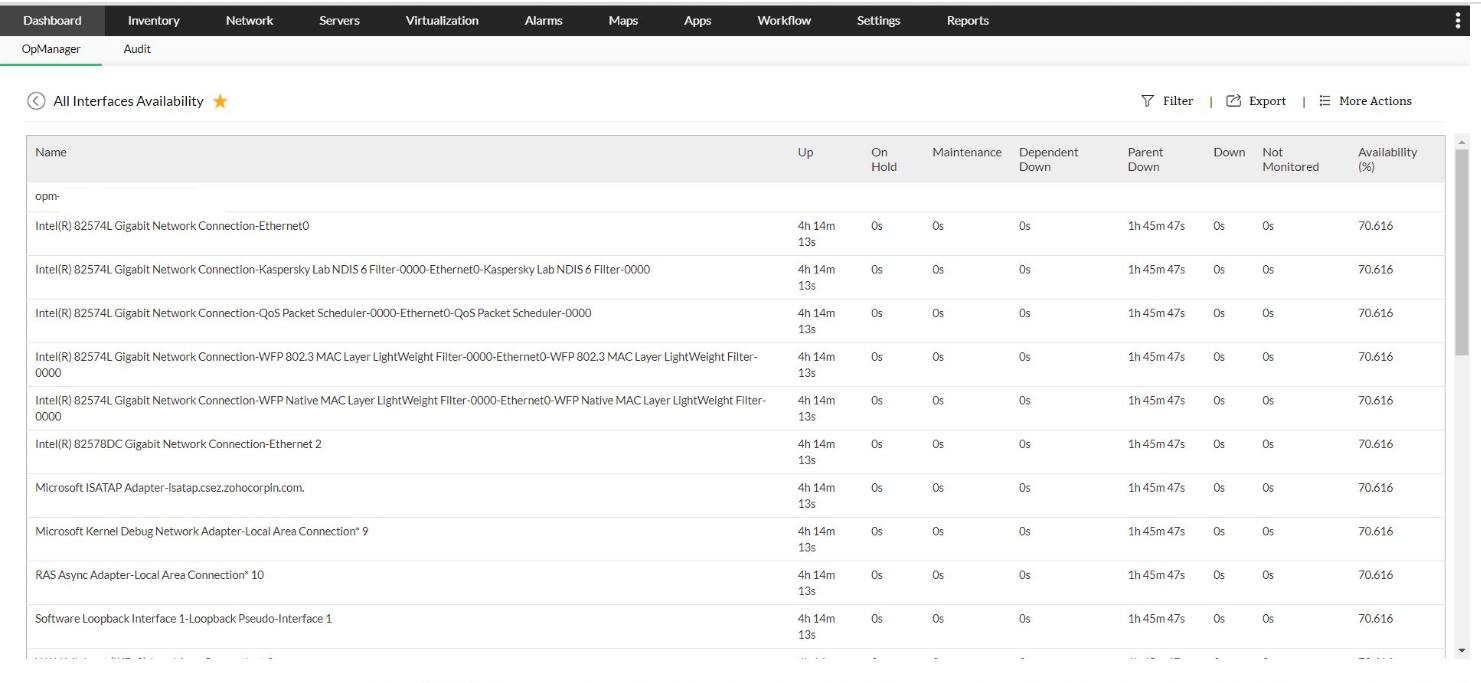
Servers are the core elements of any IT infrastructure. It is vital that they always be accessible, to ensure the smooth running of internal processes and the availability of your services. Server uptime, or the amount of time your servers are available to users, is one of the most important factors for optimizing network performance.
OpManager's server uptime monitoring feature provides you with detailed graphs and reports about availability and response time of Transmission Control Protocol (TCP) services that are monitored. The service monitoring functionality in OpManager is customizable and you can choose the intended service for monitoring.

Network uptime monitoring: Windows services
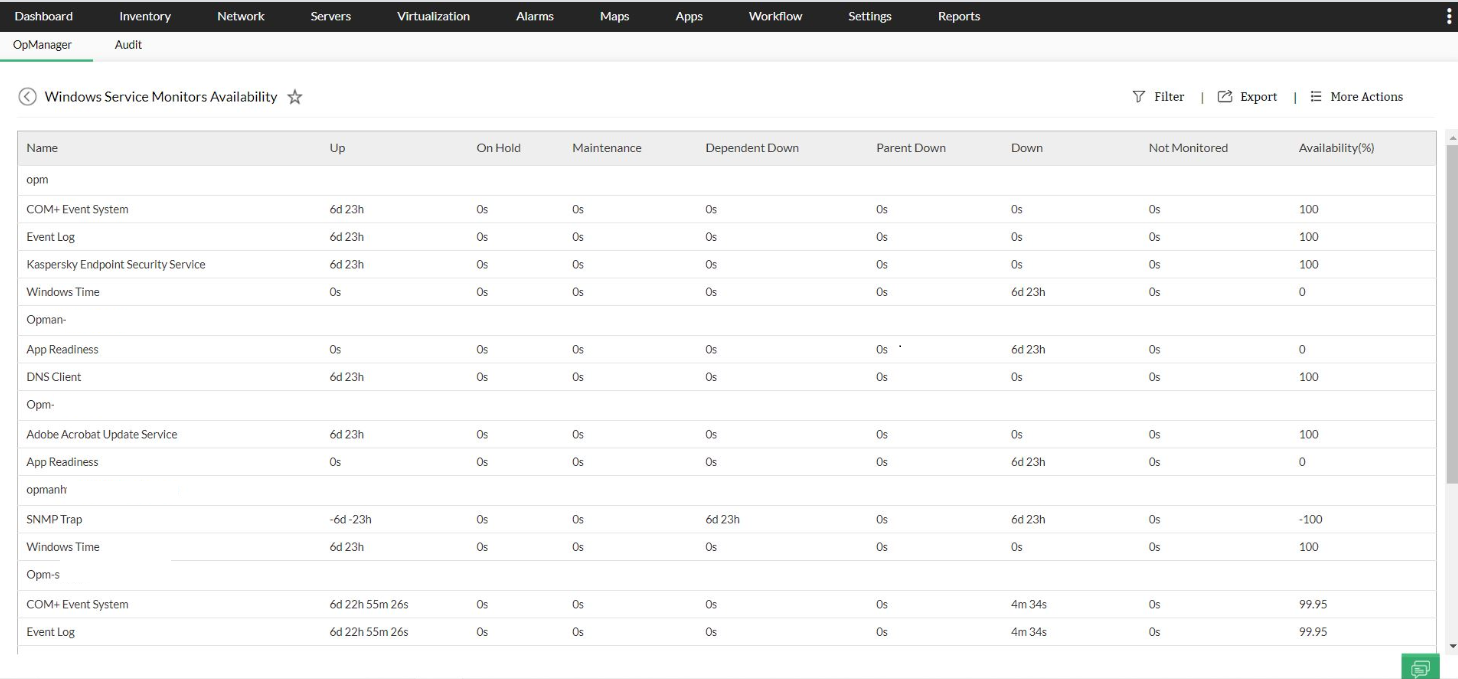
OpManager offers windows network uptime monitoring by supporting monitoring of system level services like Windows services using Windows Management Instrumentation (WMI). Similar to the system level services monitoring, you can discover any Windows services and monitor them using OpManager. Further the administrators can configure OpManager to automatically restart the service or the server when the Windows service is found to be down from the operations console. Learn More >>
Network uptime monitoring: Websites
ManageEngine OpManager's network uptime monitor performs the crucial task of monitoring your website for availability around the clock, 365 days per year. It monitors HTTP/ HTTPS URLs, intranet sites, web server farms, web applications with a login, Windows NT LAN Manager (NTLM) authenticated websites, and many more. Apart from URL uptime monitoring, you can also check for a particular content in your website. Website availability monitoring ensures the website is not under the attack by hackers.
Network uptime monitoring: Processes
OpManager's process uptime monitoring enables administrators to remotely monitor and manage processes that are running on servers. OpManager uses a variety of protocols, such as SNMP, WMI, and CLI, to monitor the processes running on Windows, Linux, Solaris, UNIX, HP UX, IBM AIX, ESX and VMware servers and virtual machines, etc.
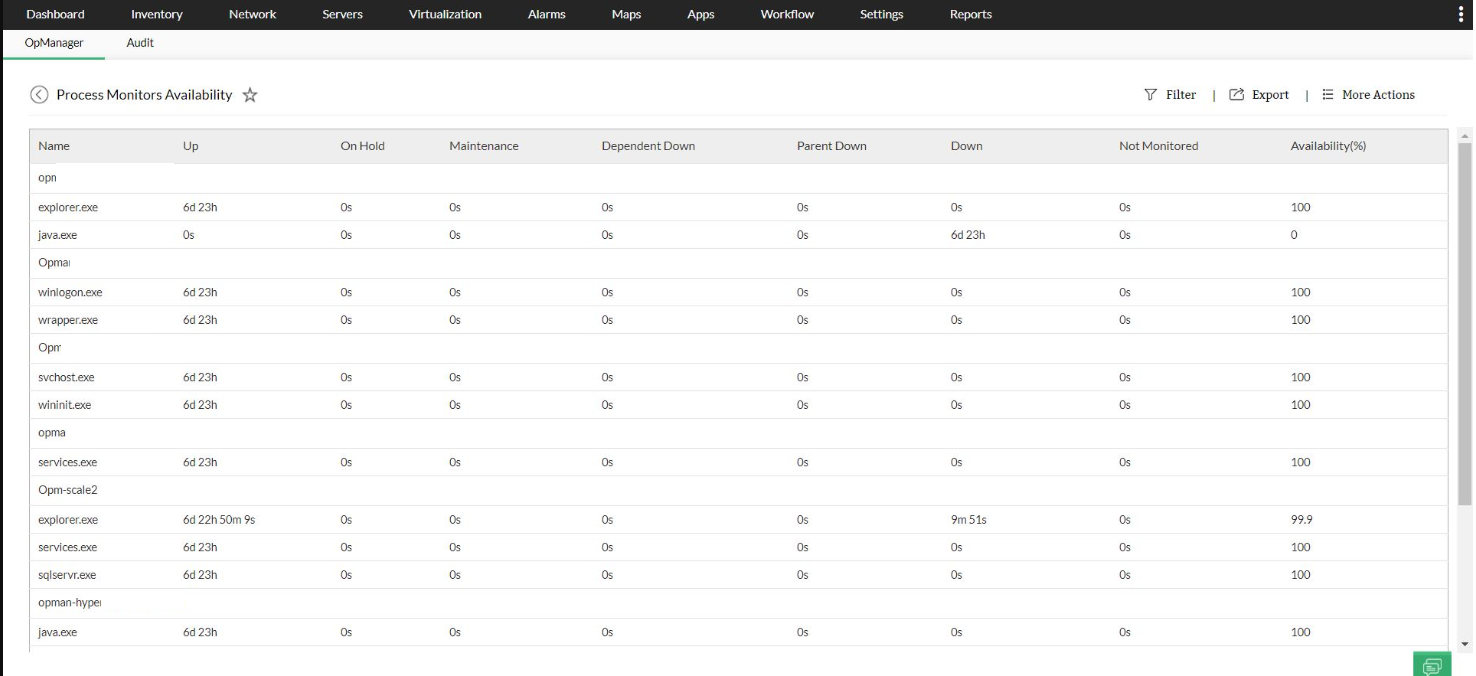
Learn more about OpManager's Process Availability Monitoring.
How is the uptime of a device calculated?
Let's consider a device monitored for a week and calculate its uptime.
Number of seconds the device was down: 3600 seconds.
Number of seconds the device was monitored: 6,04,800 seconds
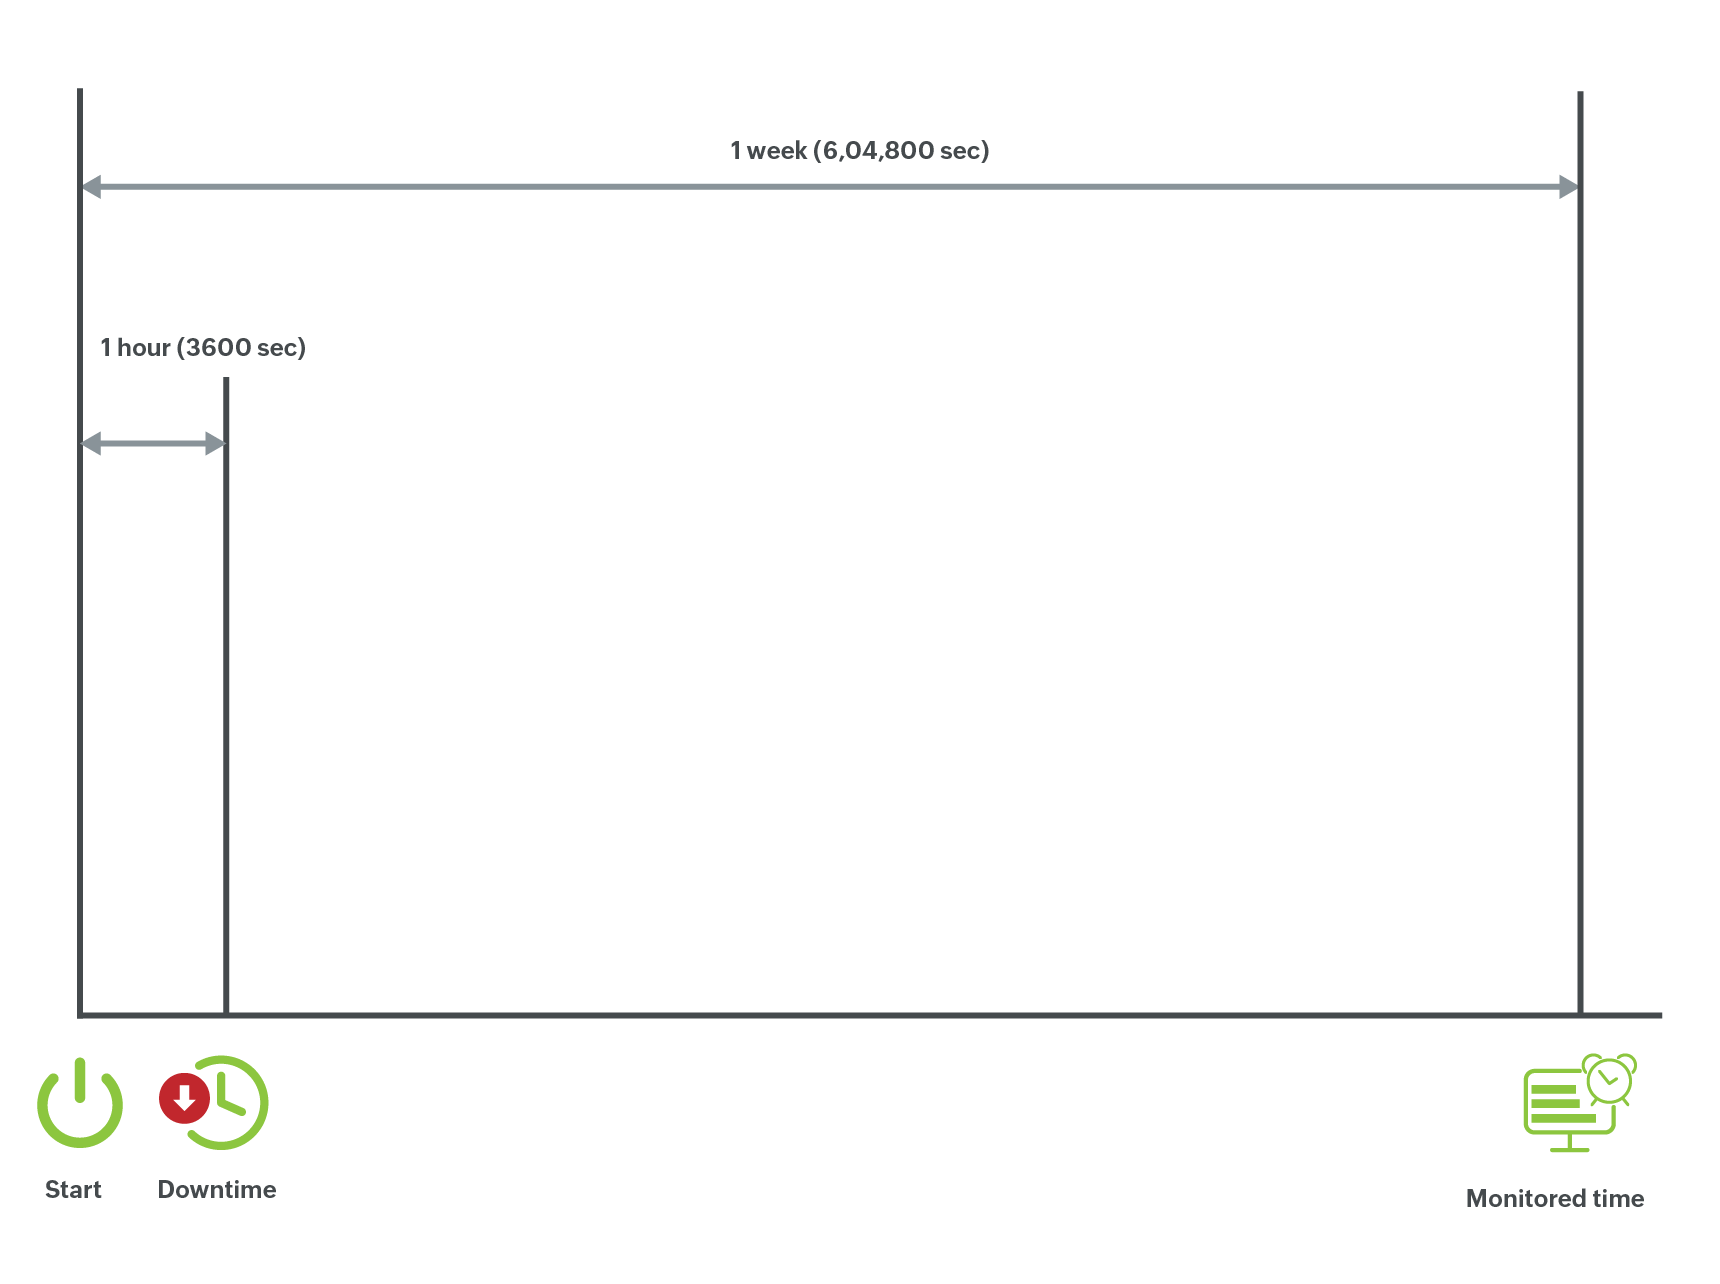
Downtime = Number of seconds device was down / Number of seconds device monitored
= 3600/ 6,04,800 = 0.0059
Downtime %= 0.59%
Uptime % = 100 - Downtime % = 100-0.59 = 99.41 %
Note: On Hold, Maintenance, Dependent Unavailable, Down, Not Monitored is calculated as Device Down duration.
