Hyperconverged infrastructure solutions help you to manage a hyperconverged infrastructure environment. You can manage the various hypervisors in your network and allocate resources, manage storage systems and control the virtual machines linked to the hypervisor. Hyperconverged infrastructure (HCI) technology abstracts and pools the underlying resources, then dynamically allocates them to applications running in VMs.
Hyperconverged infrastructure has eliminated the need for hardware defined data centers that are becoming complicated, expensive and difficult to manage. With networks constantly evolving, it is important for organizations to stay responsive and scalable to meet the changing needs and demands of the business.
Nutanix pioneered hyperconverged infrastructure (HCI) technology, and has continued to evolve the platform. In Nutanix HCI, a collection of nodes is called a cluster and each HCI node in a cluster operates a hypervisor. The HCI management feature operates as a separate virtual machine on every node and is designed to scale resources when new nodes are added. This is called the Nutanix Prism and it allows easy, simplified HCI management from a single view and eliminates the need for separate management solutions for servers, storage, and virtualization. By monitoring the Prism using OpManager, you can monitor all the elements grouped under the specific HCI. HCI requires a minimum of three nodes to maintain high availability. Nutanix also offers a custom hyperconverged infrastructure (HCI) software to manage a HCI environment. The Nutanix HCI software provides a basic interface to monitor HCI.
OpManager is a comprehensive Hyper converged infrastructure monitoring software that uses basic SNMP to monitor HCI. It helps you to monitor various important metrics like bandwidth, latency and CPU usage of your HCI with and gives you an option to drill down to the specifics. OpManager offers alarm notifications (SMS and email), and provides color coded alarms to help you detect and troubleshoot the root cause of network bottlenecks. Take control of your network by setting thresholds and generate graphs to analyze trends over a specific time-period using OpManager.
OpManager comes bundled with over 9000 device templates which carry the initial configurations to classify the devices into the pre-defined categories and to associate monitors to them. OpManager's predefined device-specific performance monitors help you instantly monitor a particular parameter of your devices or interfaces and also gives you the option to drill down on specifics. The monitoring interval for availability can also be defined to reduce the usage of system resources. You can apply configurations in bulk across multiple devices with the help of device templates.

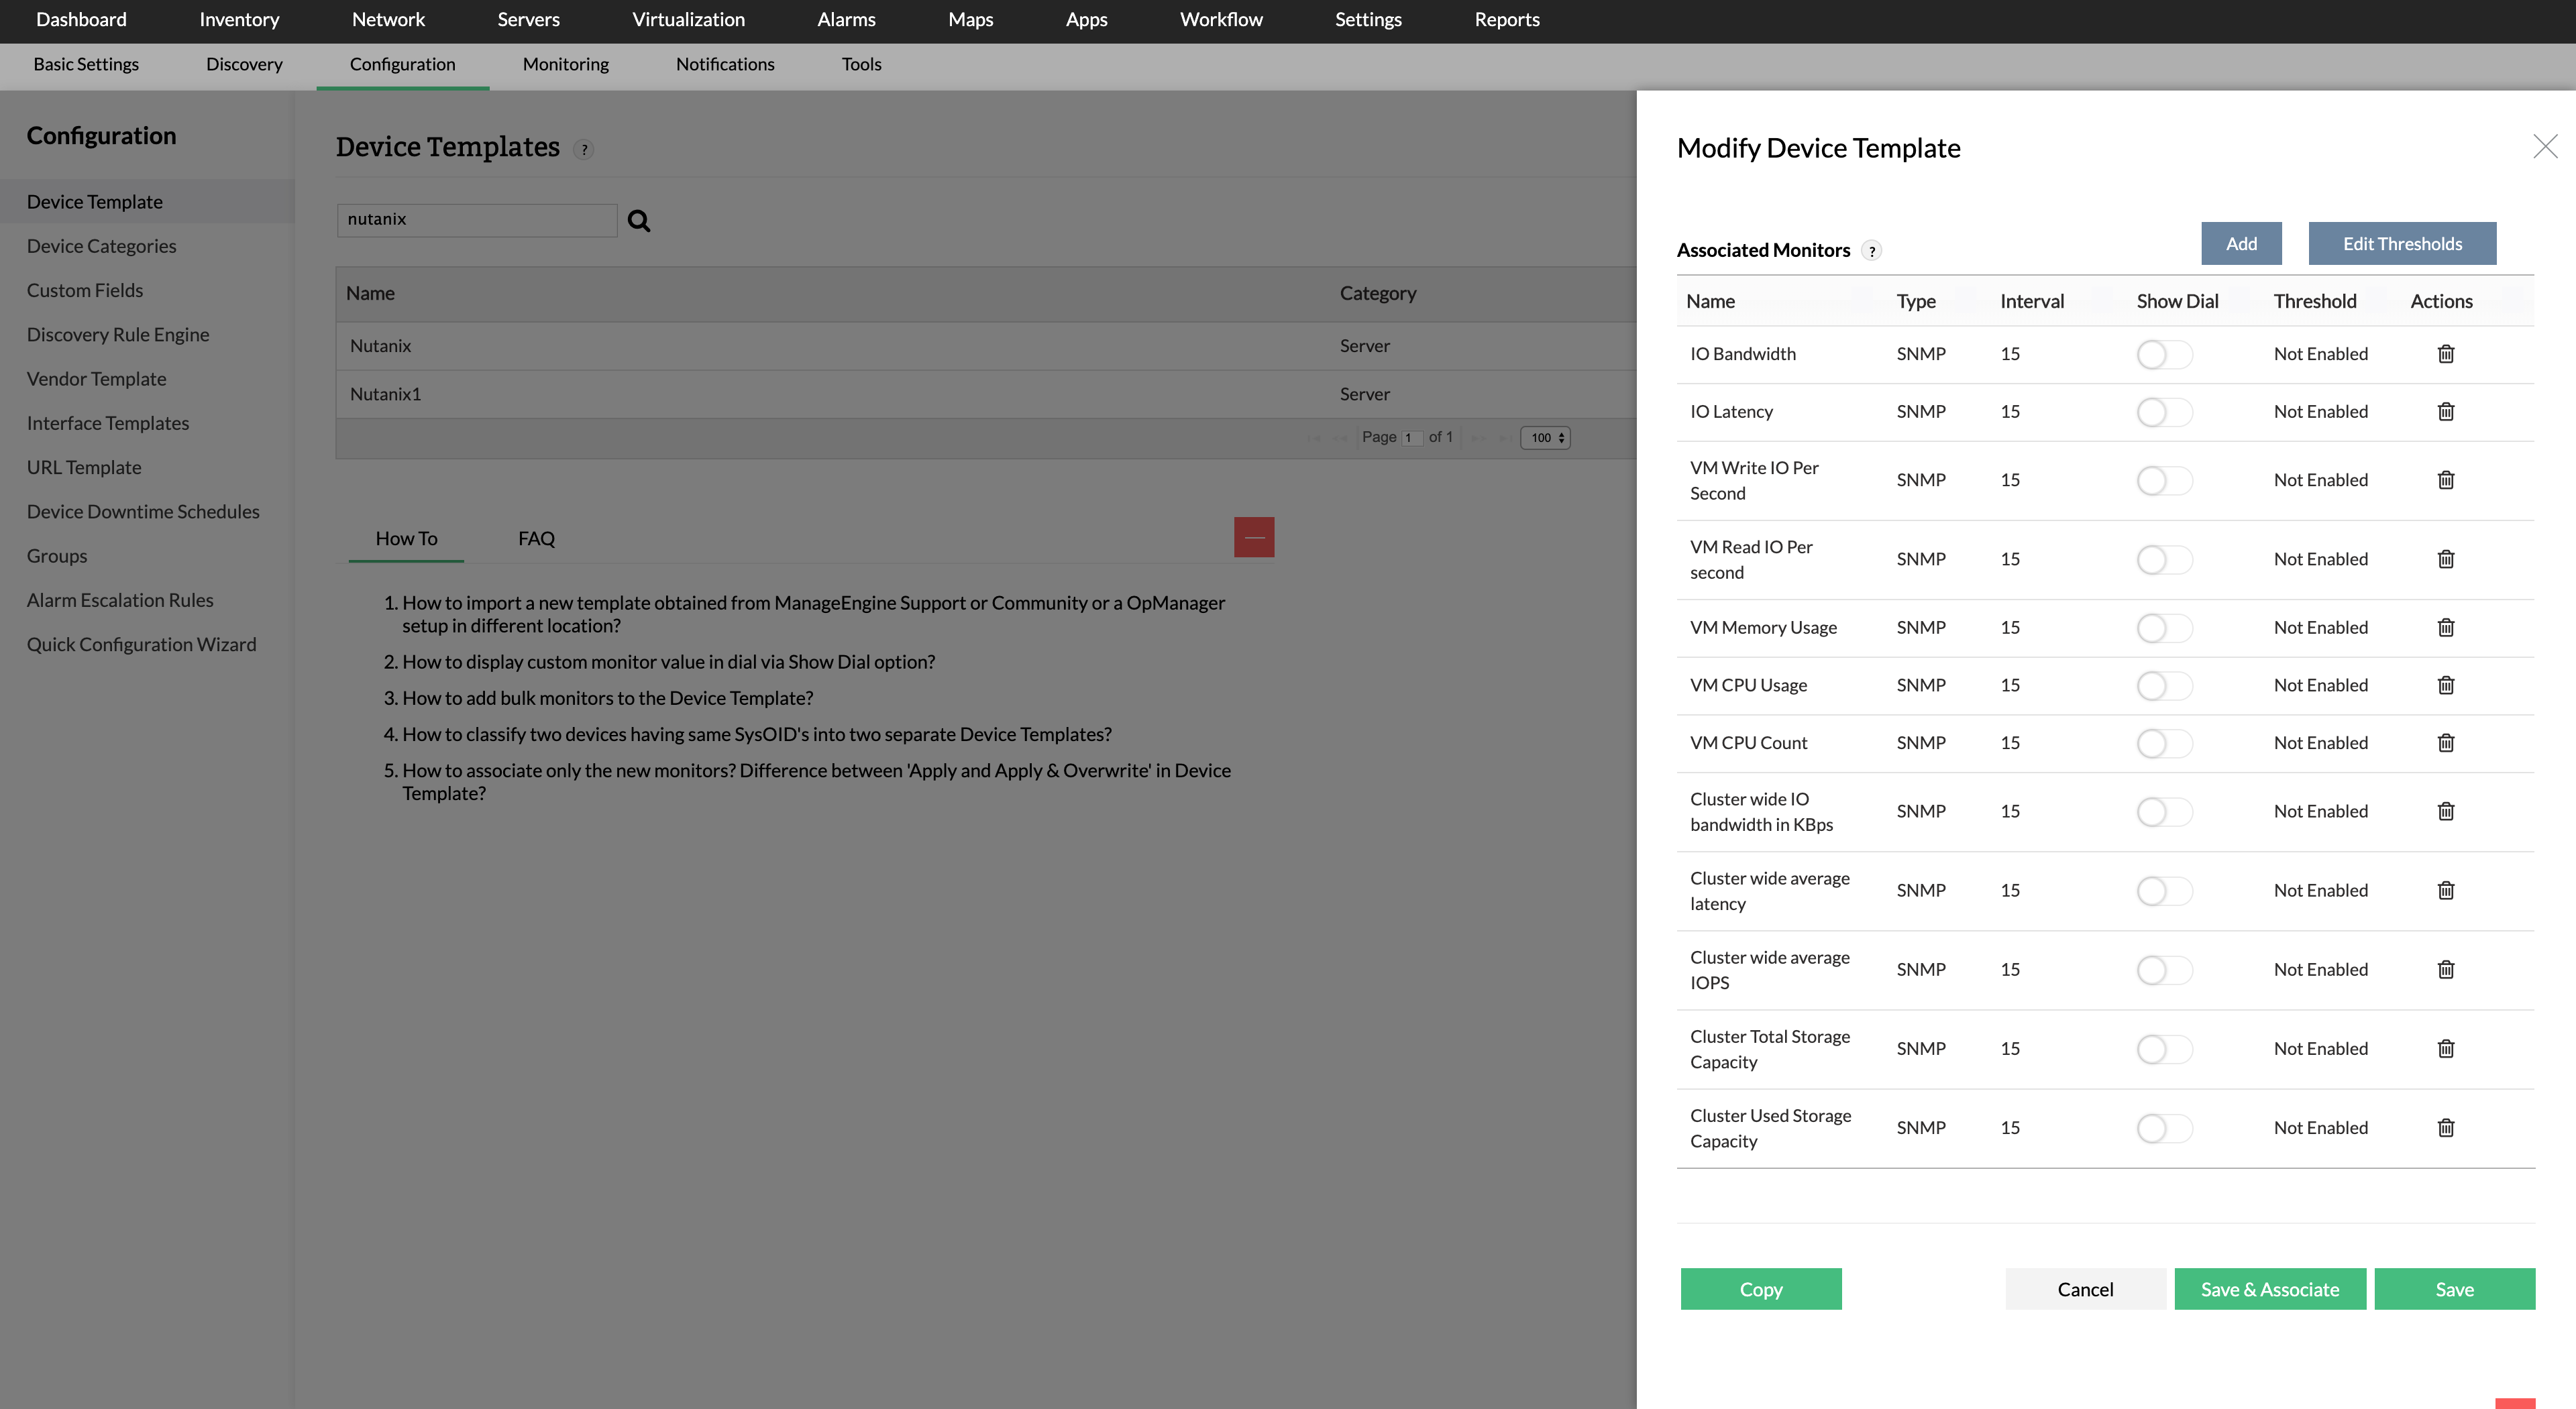
For in-depth hyper converged infrastructure performance for Nutanix devices, OpManager offers the following pre-defined monitors out-of-the-box:
| Monitor | Function |
| IO Bandwidth | Monitor the input/output bandwidth of Nutanix HCI |
| IO Latency | Monitor input/output latency of Nutanix HCI |
| VM Write IO Per Second | Monitor VM write for input/output operations |
| VM Read IO Per second | Monitor VM read for input/output operations |
| VM Memory Usage | Monitor memory usage for VMs |
| VM CPU Usage | Monitor CPU usage for VMs |
| VM CPU Count | Monitor number of cores for VMs |
| Cluster wide IO bandwidth in Kbps | Monitor input output bandwidth in Kbps across the cluster* |
| Cluster wide average latency | Monitor average latency across the cluster |
| Cluster wide average IOPS | Monitor average IOPS** across the cluster. |
| Cluster Total Storage Capacity | Monitor the total storage capacity across the cluster. |
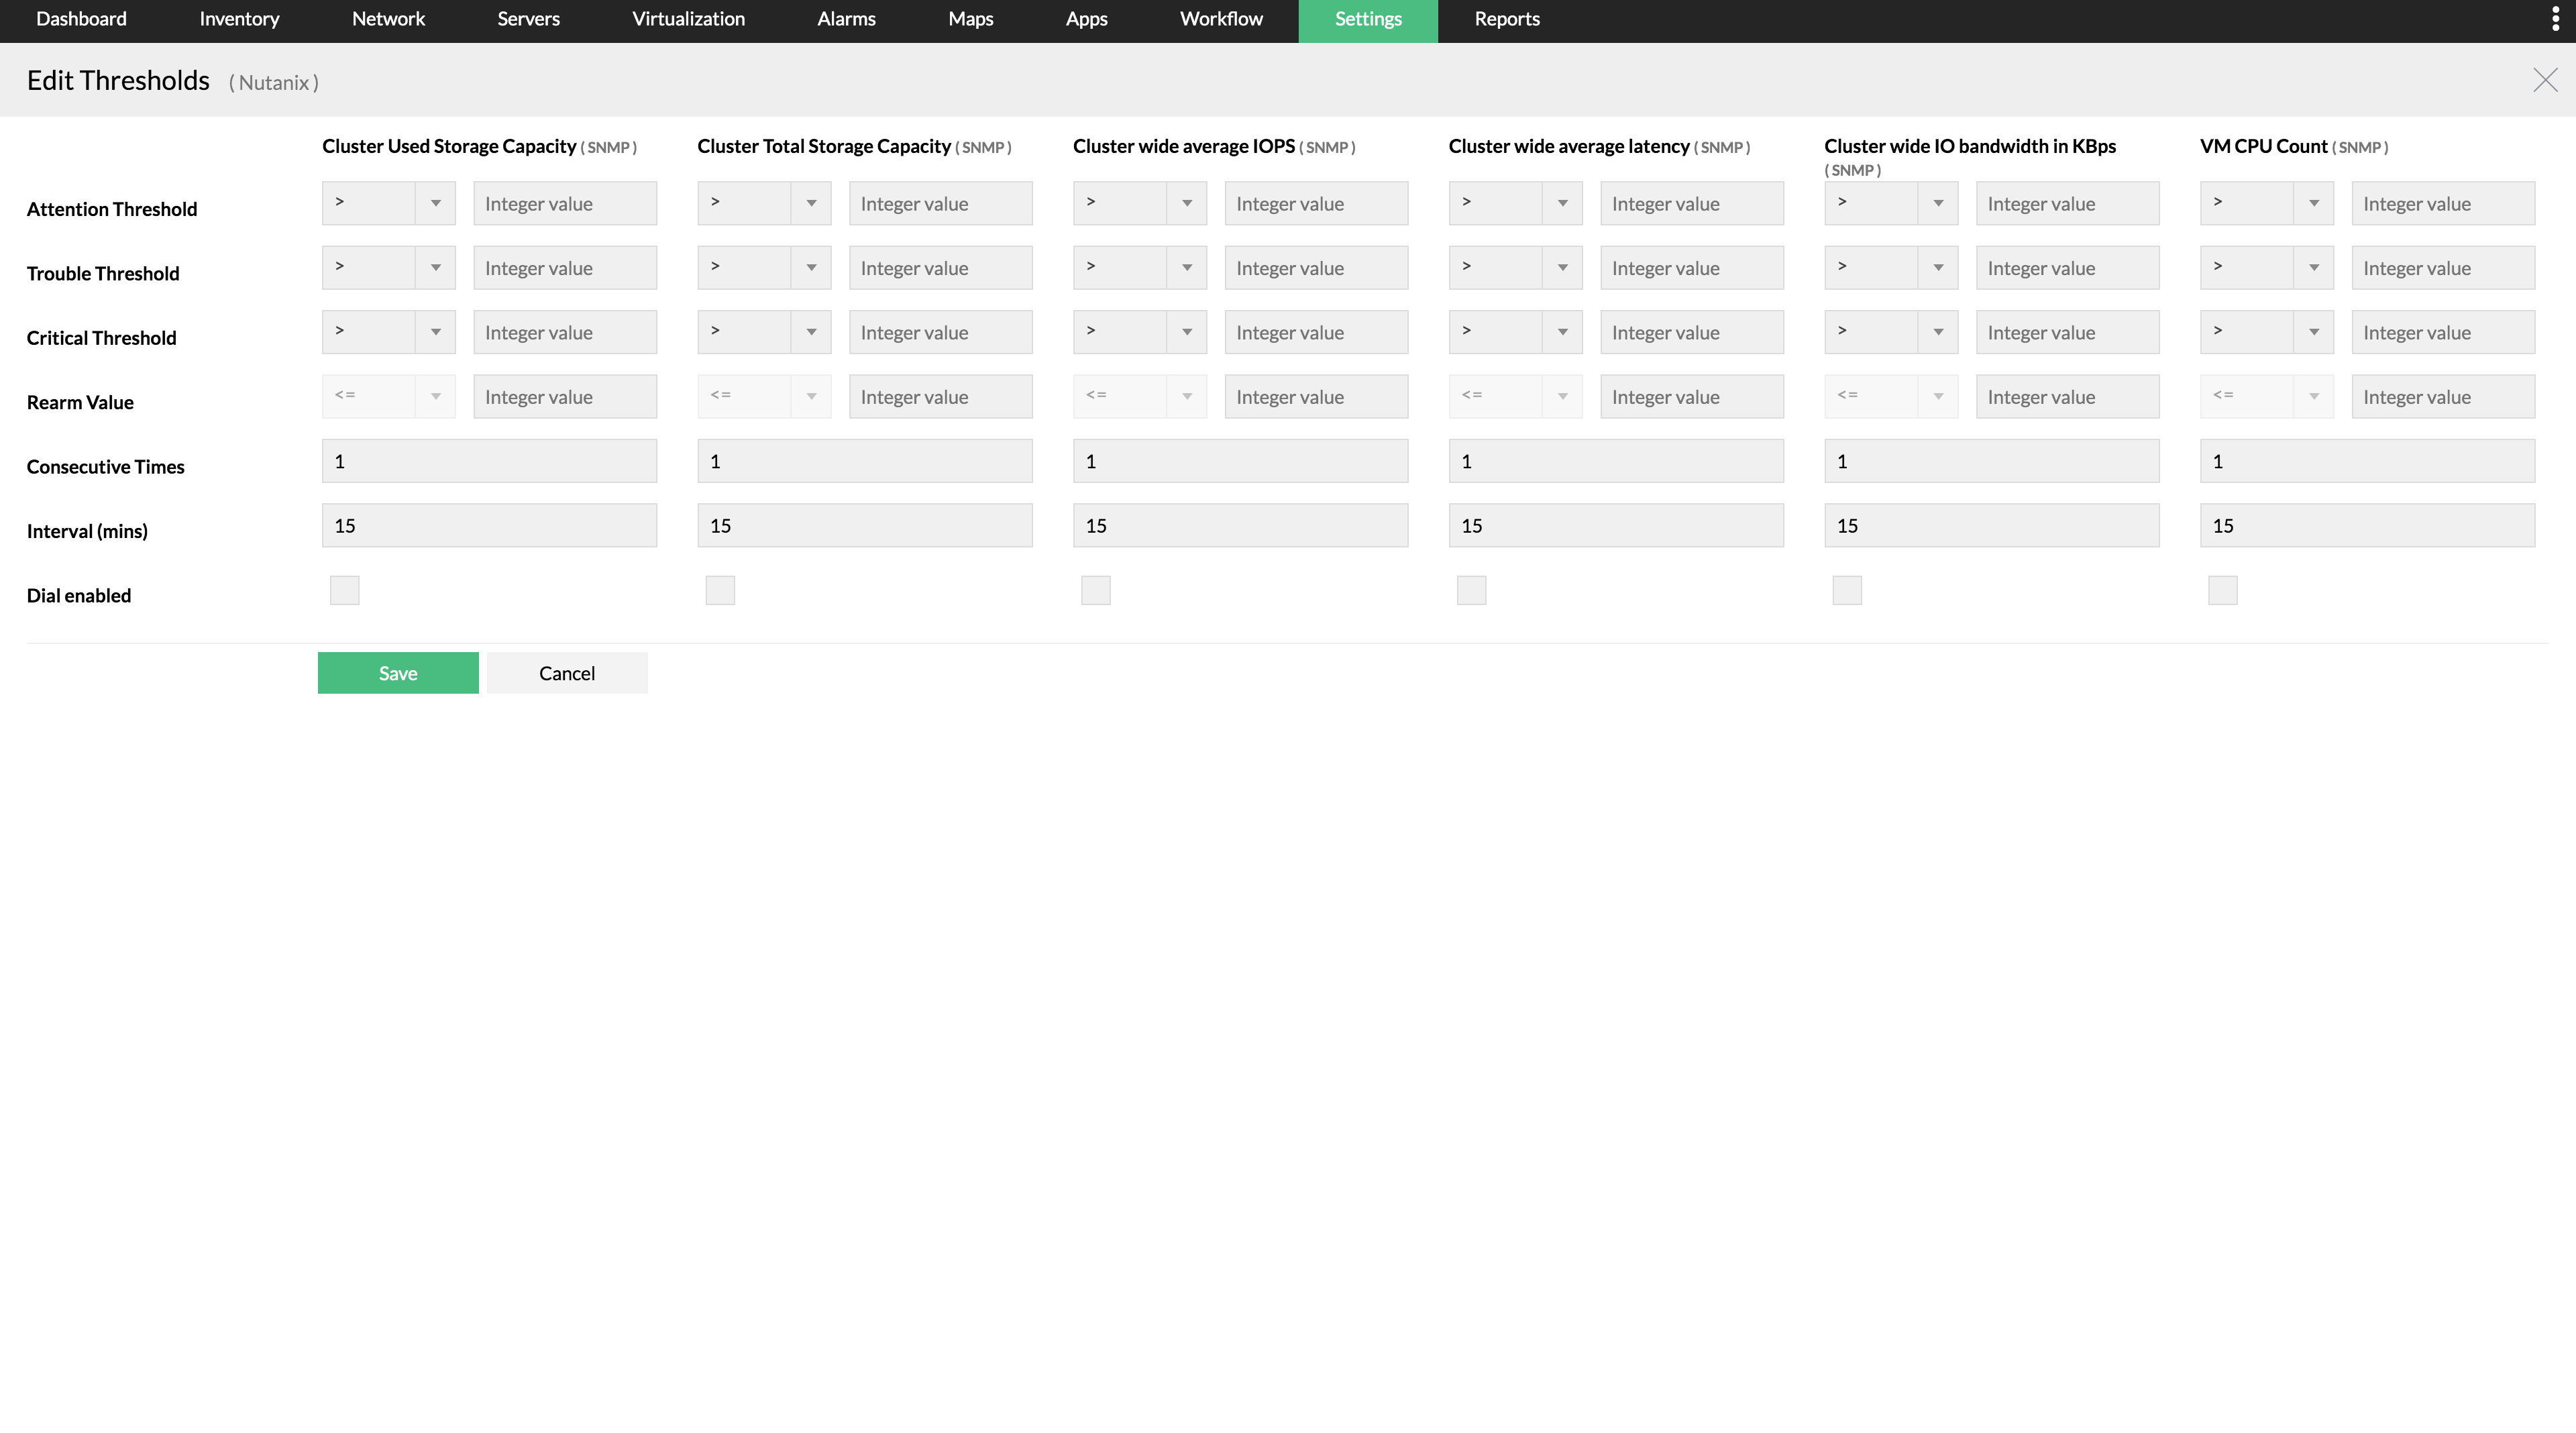
OpManager allows you to configure thresholds for the various monitors and you can receive alerts when the thresholds are violated. The alerts can be configured to be sent to your phone as a SMS or via email. This helps you to monitor your network on the go. You can generate the data as a report using OpManager. The data can also be viewed as a graph for a particular time-period.

OpManager will extend support for extensive HCI monitoring using APIs in the coming months. Take a look at the functionality and enhancements in the road-map for hyper-converged infrastructure monitoring:
We'd love to hear from you on what metrics you'd like to monitor in a hyperconverged infrastructure environment to ensure optimum performance and maximum visibility for your network. Share your valuable feedback here.