Refine your application management tactics with an integrated infrastructure management tool
When a business-critical order-processing application slows down and sales personnel in branch offices are unable to process orders, there will be major consequences, including disturbance in cash flow, a help desk flooded with calls, and stalled business. And when there's a lack of an integrated approach in the IT infrastructure, finding the root cause of the issue can be difficult. The application team, the server team, and the network team will spend a lot of time drilling down to the spark that caused the fire, and to further fuel the chaos, each has their own reports that may show their assets were highly available during the time of the application lag.
Reason for chaos: False security assured by point products
The primary cause of chaos in monitoring networks, systems, and applications stems from managing them as separate entities without adequate integration. Furthermore, relying on individual tools may provide a false sense of security by asserting the availability of each entity during issues. However, the real-time user experience is influenced by various factors, such as the server from which they are served, the health of that server at the time, the actual availability of the application, and the response time relative to that server. Poor application performance could be due to many reasons, including:
- At the network level
- Non-availability of the primary WAN link between the head office and the branch office
- Longer round trip time experienced in the WAN link due to congestion
- Performance issues on router leading to increased latency
- At the server level
- Insufficient resources (CPU, memory, etc.) on the server due to increased loads
- Hard disk or NIC card errors resulting in slow or poor server performance
- Unusually high traffic activity on the server at certain times (peak hours)
- At the application level
- Application’s data persistence module was not optimized, causing intermittent connection problems
- Application went through a major revamp and was crashing often—likely wasn’t well tested before deployment
- Application load shot up at the particular moment, causing poor performance for everybody
How to fix this
The initial action to stop this chaos involves steering clear of the deceptive reassurance offered by individual products that are unable to accurately pinpoint the core reason of an issue when a storm hits your IT environment. An integrated approach offers the ability to gain real-time visibility into the performance of your network, servers, and applications, and pinpoint the root cause of a failure when it occurs.
For example, an integrated infrastructure management solution would assign higher importance to the server, which runs the application, and would escalate the disk space utilization issue through appropriate alarms and notifications.
ManageEngine OpManager: An integrated, cost-effective solution for your business
ManageEngine offers an affordable range of products that provide an integrated management experience when clubbed with centralized trouble ticketing software.
Tools for WAN visualization and monitoring: For the network team
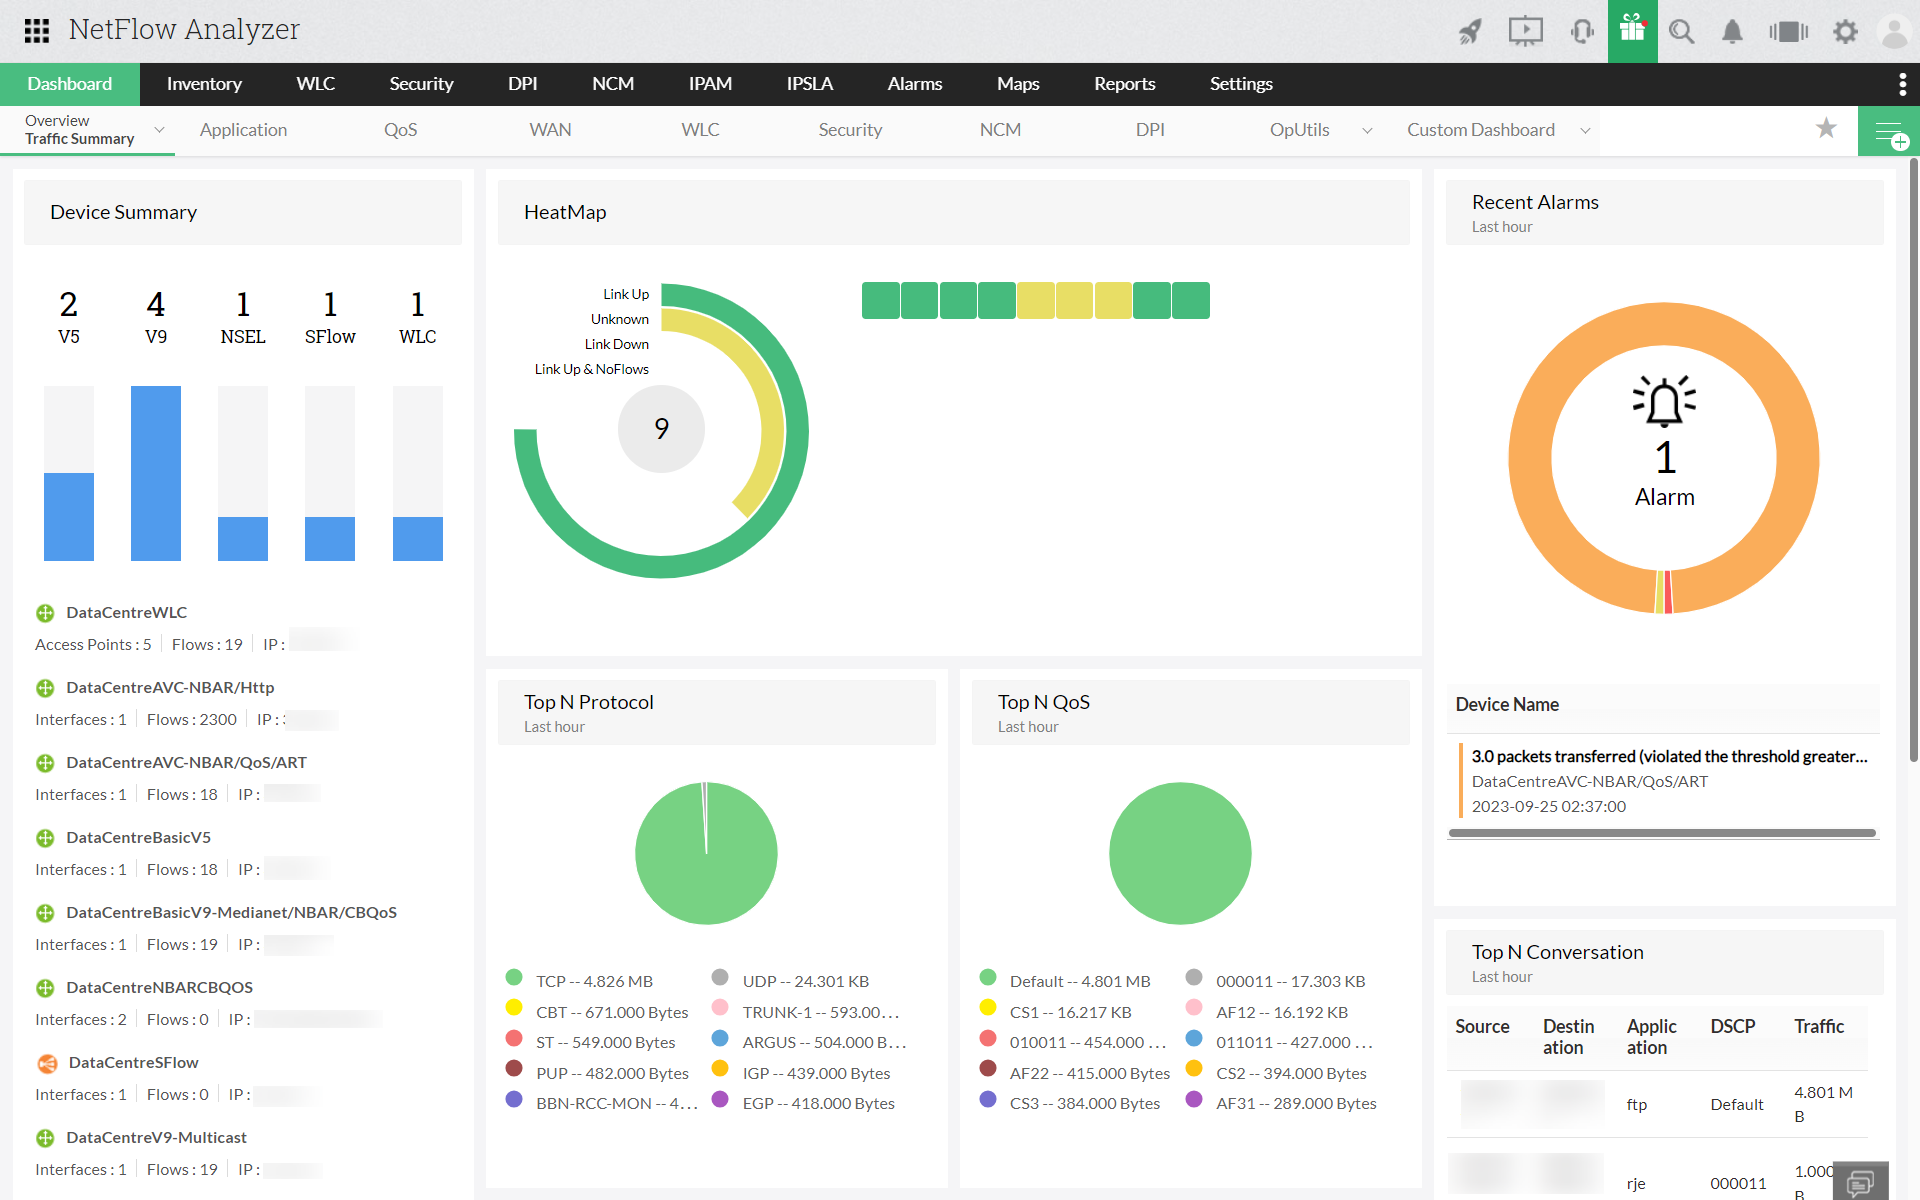
OpManager's Network Traffic Analyzer add-on furnishes comprehensive insights into network traffic patterns and bandwidth utilization, leveraging advanced flow protocols like NetFlow, sFlow, j-Flow, IPFIX, and more. This granular tool facilitates real-time bandwidth monitoring, accompanied by detailed traffic reports that enable quick and precise identification of bandwidth issues before they impact end users. Beyond this, empowering administrators to expedite the resolution of bandwidth issues and reduce the mean time to repair (MTTR), OpManager stands as a multifaceted solution for network optimization.
This well-equipped tool can help network teams to visualize their WAN links running across the branch offices. Individual link performance, statistics on bandwidth usage, router latency issues, etc. can be identified using NetFlow Analyzer.
Tools for server monitoring: For the server team
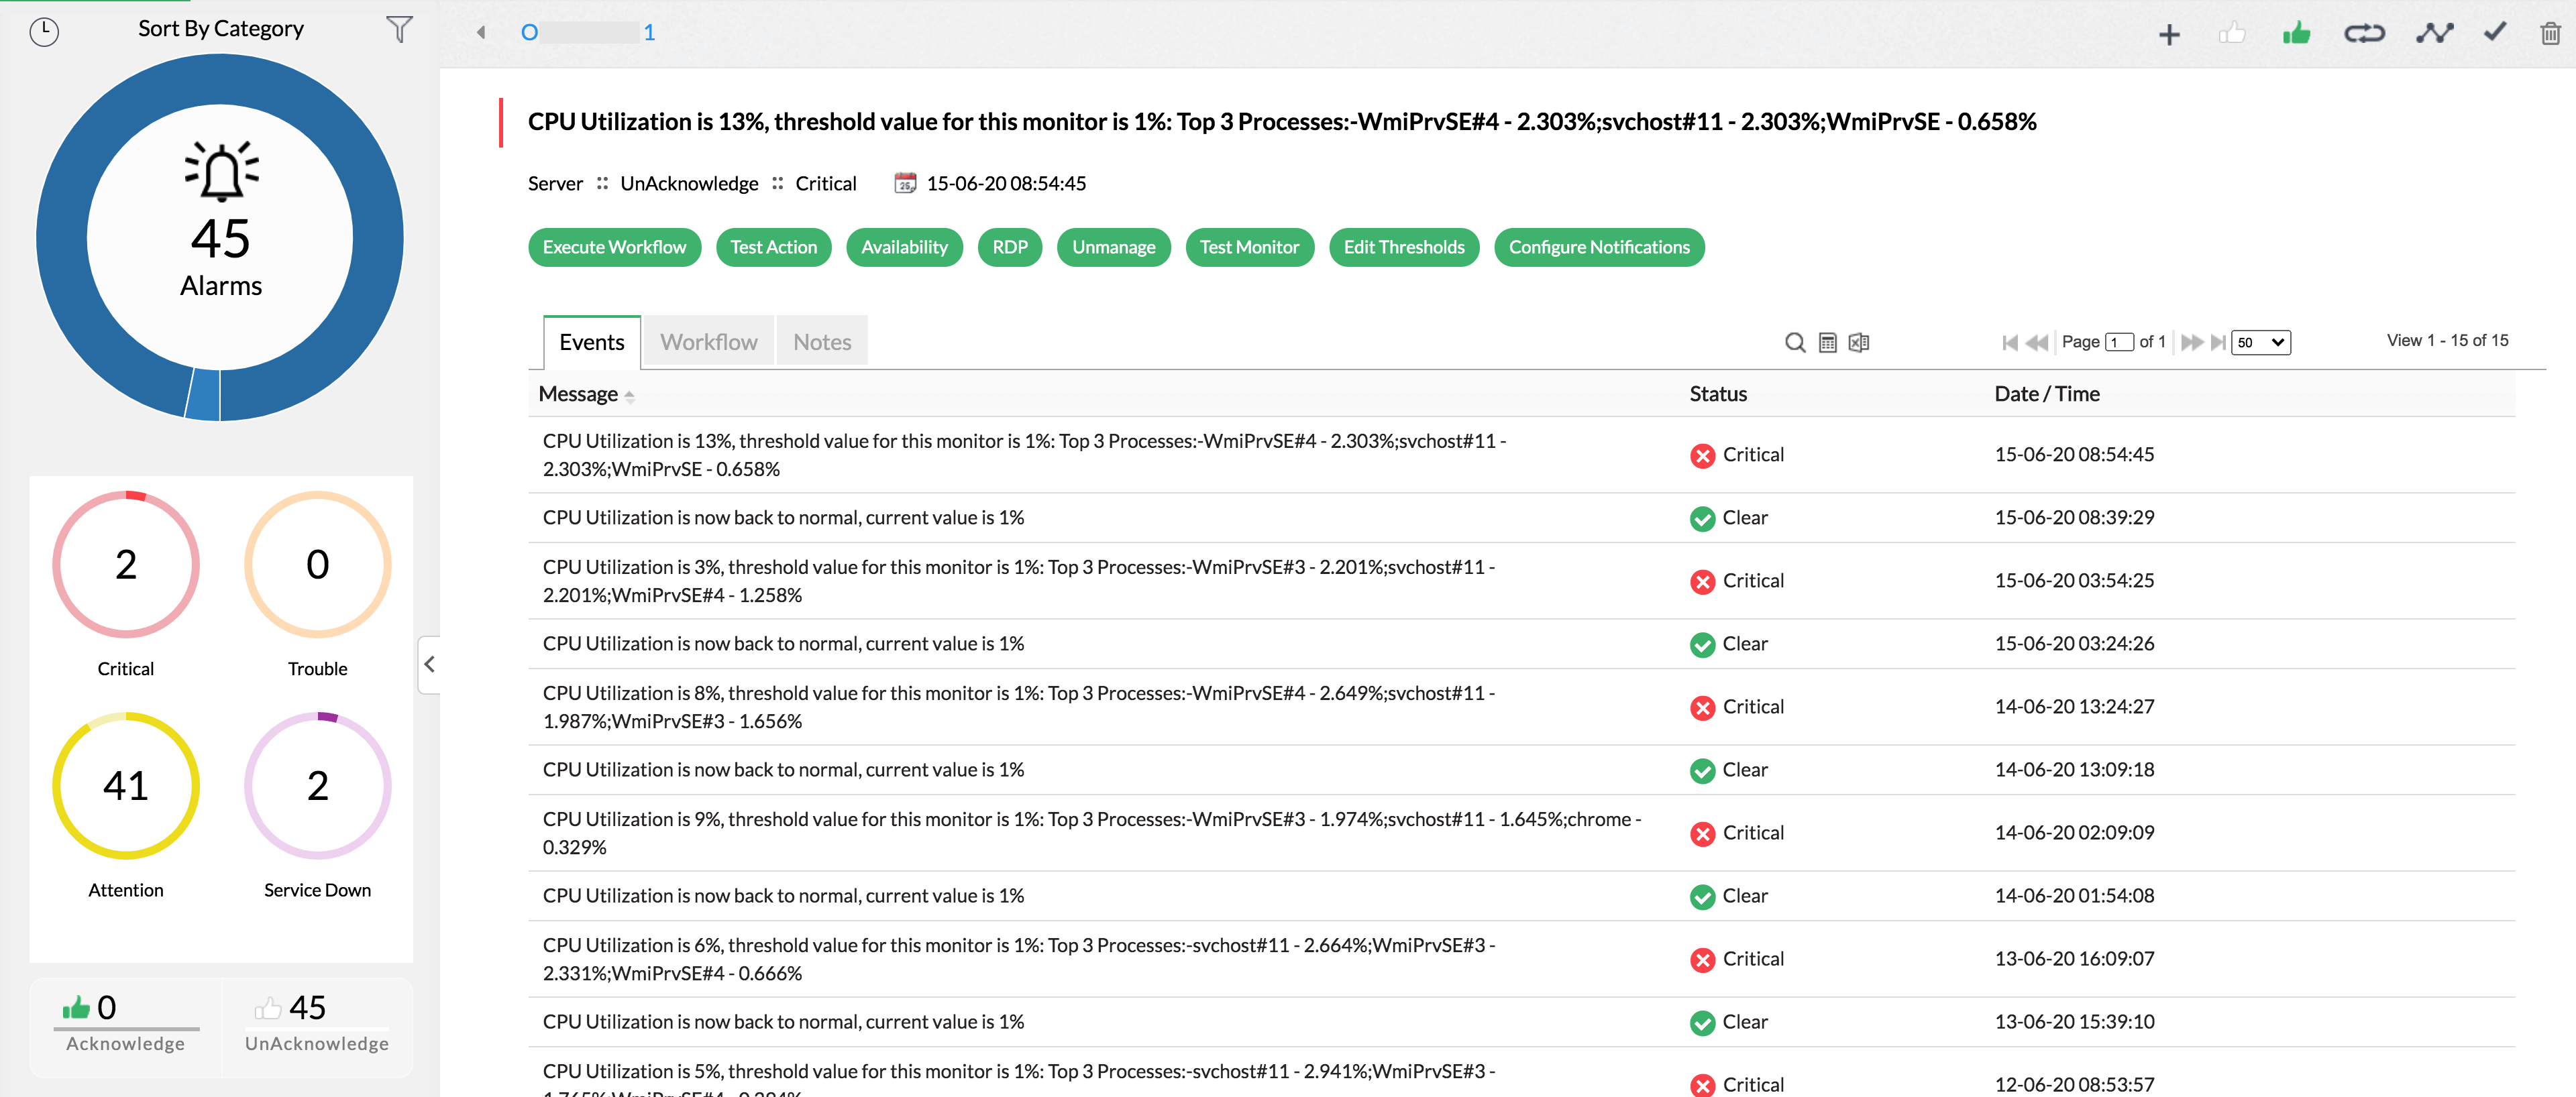
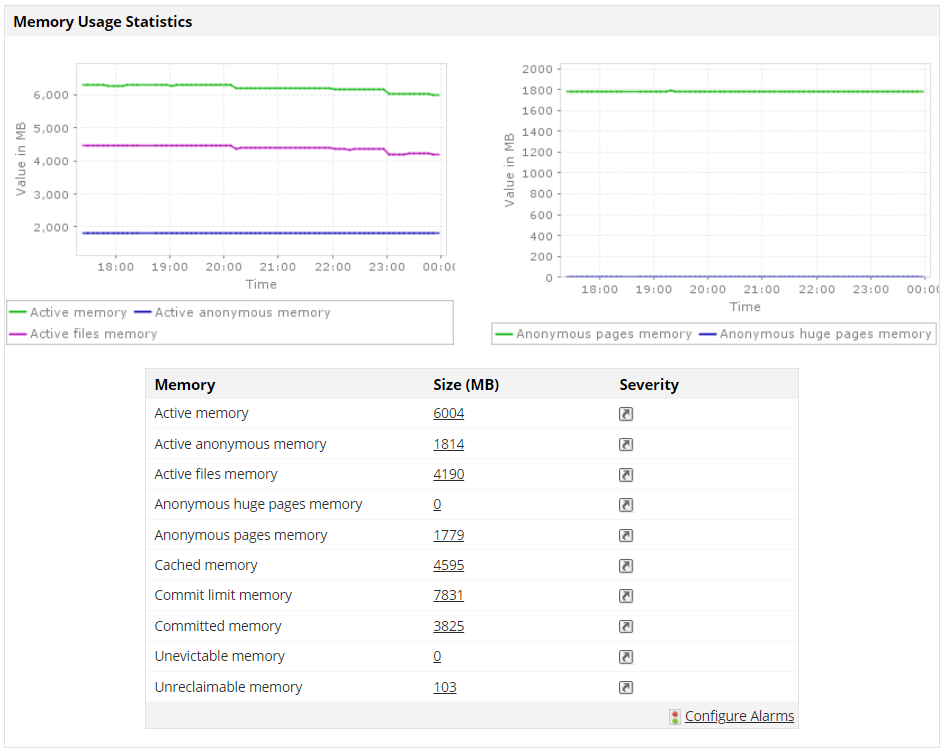
OpManager monitors key health parameters of your servers such as CPU, memory, and disk utilization and proactively alerts you on low disk space, high CPU utilization, etc. Additionally, the platform provides extensive multi-vendor support, facilitating 24/7 monitoring of servers, critical applications, and associated services and processes.
Employing SNMP and WMI protocols, it systematically oversees servers to guarantee uninterrupted operation and helps squeeze out optimal performance. This tool not only provides real-time, in-depth insights into server performance but also maintains a comprehensive repository of historical data for performance tracking and troubleshooting. By consolidating these functionalities, OpManager obviates the necessity of purchasing separate server monitoring tools.
Tools for applications management: For the applications team
OpManager's Applications Manager plug-in exemplifies exhaustive application and database monitoring. This tool proves invaluable for application support teams, as it offers precise insights to admins into response times across diverse usage scenarios. It provides profound visibility into the performance and user experience of pivotal applications and infrastructure components.
With expansive monitoring capabilities, it enables swift identification and resolution of performance issues throughout the entire application stack, from URL to code. Businesses can reap the benefits of OpManager to refine and automate IT and DevOps processes. This can guarantee optimal end-user experiences and yield better performance.
ServiceDesk Plus: An integrated console for IT troubleshooting
ManageEngine ServiceDesk Plus is a single console for IT troubleshooting. Alarms generated in tools like OpManager, Applications Manager, and NetFlow Analyzer can be automatically converted into tickets in ServiceDesk Plus.
For example, let's say one of your servers is experiencing poor response time due to low disk space. Two tickets would be automatically generated for the same server: one from OpManager for low disk space and the other from Applications Manager for poor response time. These tickets will provide the full context of the problem and help in gaining a unified view. Moreover the administrator can merge these two tickets into a single problem and work on resolving the issue.
The single console for IT maintenance helps in knowledge sharing and developing a knowledge base over a period of time. ServiceDesk Plus' offers a web-based knowledge-base portal, which accumulates the notes added so far and offers a helping hand for anyone starting out.
For more details on ManageEngine OpManager and how it can help you manage your application, systems, and network seamlessly, request a personalized demo from our product experts or download a free trial to experience it firsthand.