- Log360 Cloud
- Admin Settings
- Storage Tiers
- Using Stats Analysis
Using Stats Analysis
In this page:
Overview
This section covers how to access and use Stats Analysis in ManageEngine Log360 Cloud. Stats Analysis provides a clear view of how log data is distributed across Storage Tiers, helping you monitor trends, identify high-volume contributors, and drill down into details by size or count. You can apply filters and export reports to focus on relevant data and refine your storage and Storage Tier configurations effectively.
Viewing Stats Analysis
- Log in to your Log360 Cloud account.
- Go to the Settings tab and select Admin.
- In the left pane, navigate to Data Storage and click Storage Tiers.
- On the Storage Tiers page, select View Stats to analyze the trends for any Storage Tier of your choice.
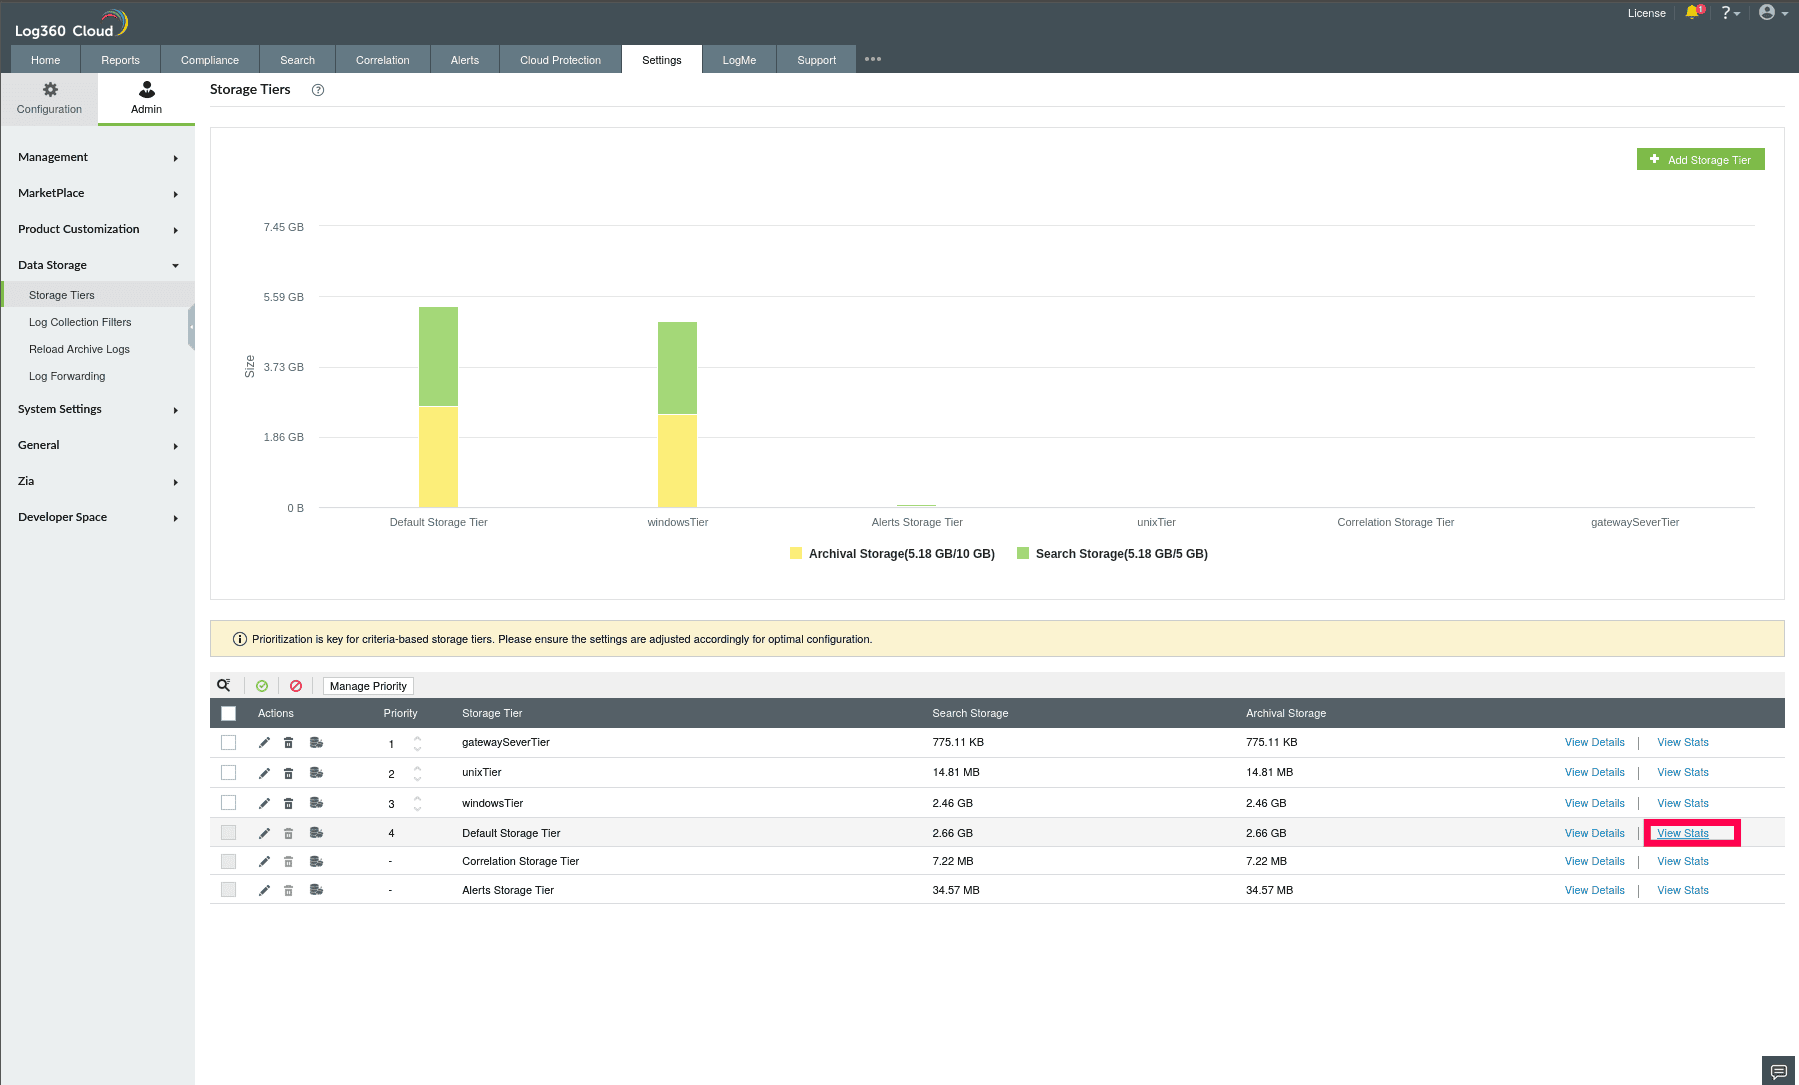
Figure 1: Viewing Stats of a Storage Tier
- Once you click View Stats, the Stats Analysis page opens.
- The Storage Trend tab displays a graph showing log trends categorized by log type: Deleted, Archived, and Searchable logs for the selected Storage Tier.
NOTE: The Views Stats graph in the Stats Analysis page and the graph in the Storage Tiers page provide different insights, with each highlighting distinct aspects of usage.
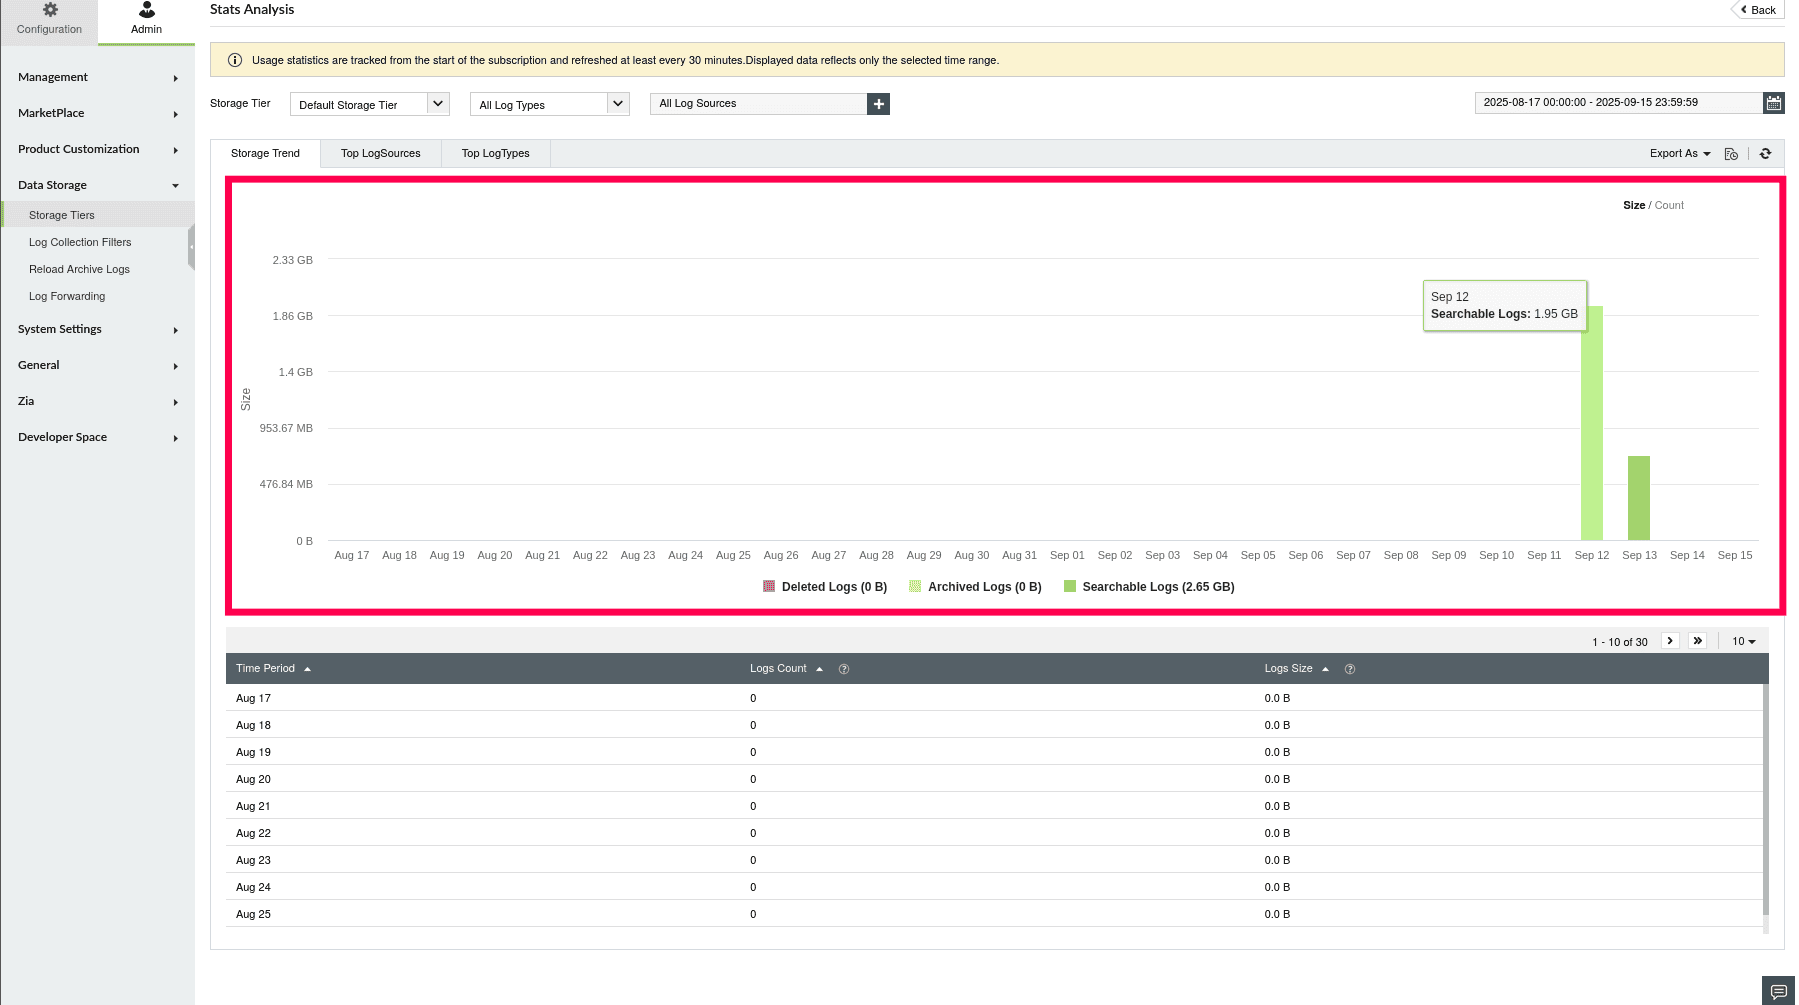
Figure 2: Viewing Stats of a Storage Tier
- Click a bar in the graph to view data grouped by day for the selected month.
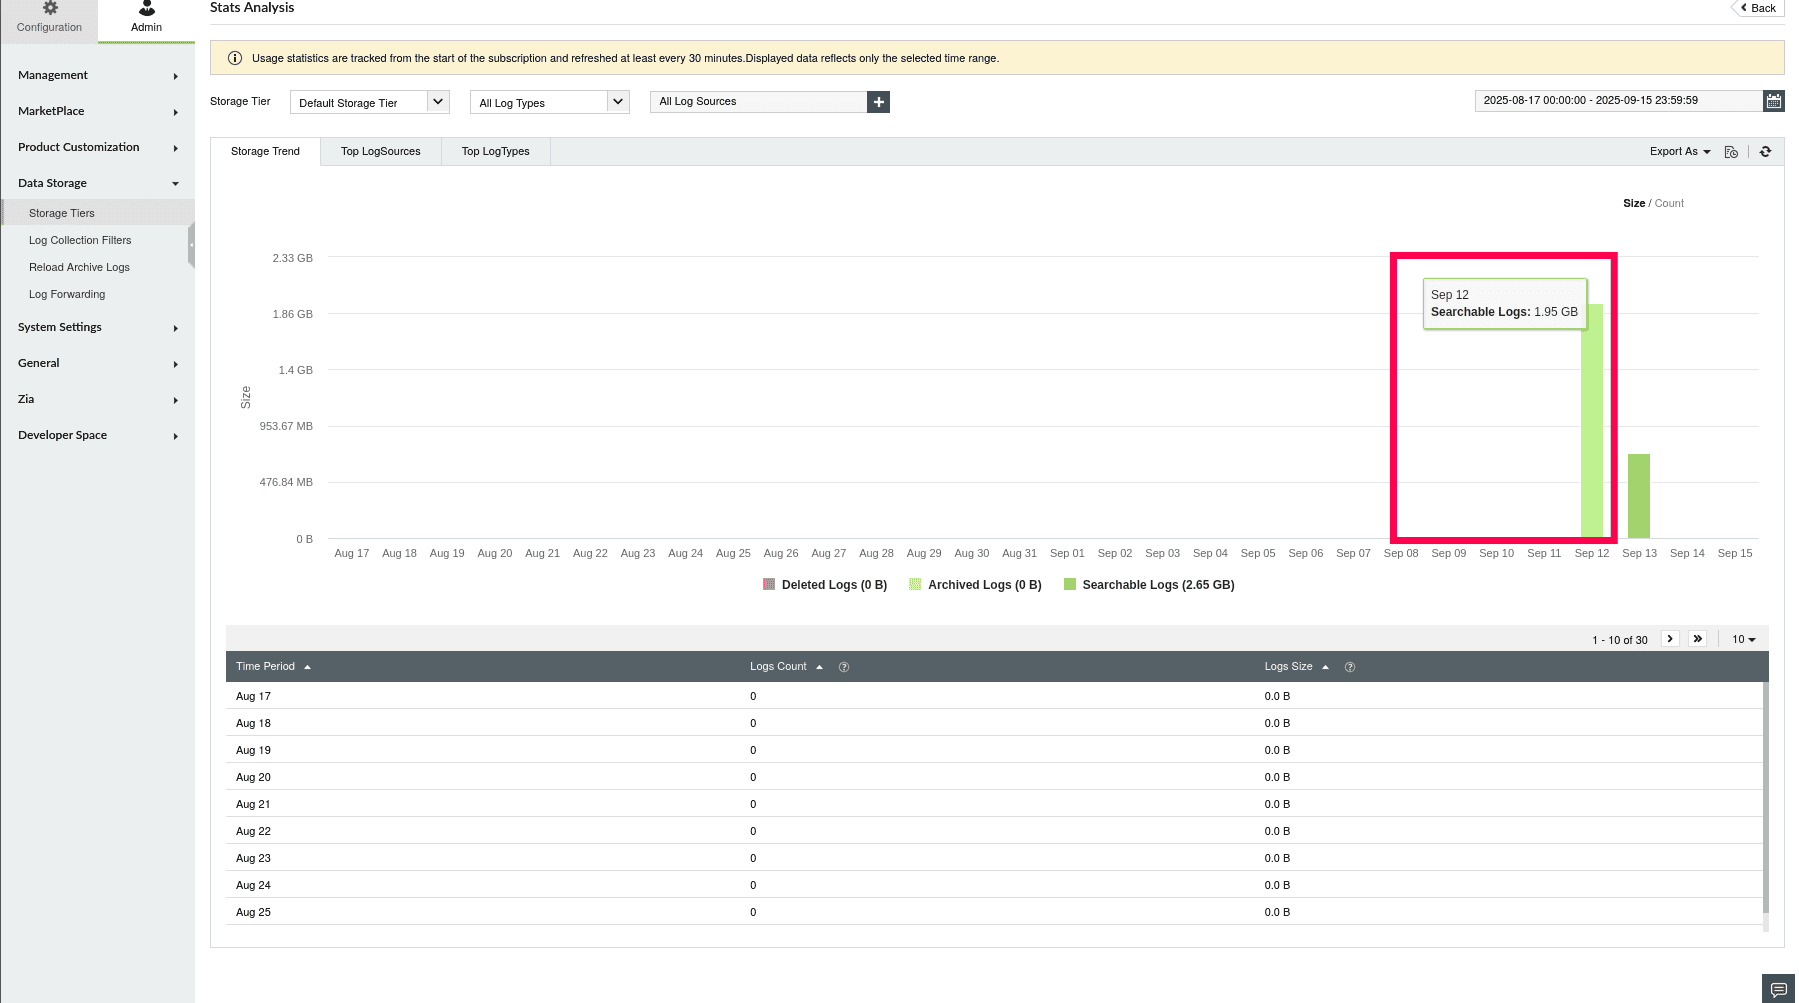
Figure 3: Daily log trends and metrics
- Click a bar in the day view to see data grouped by hour for the selected day.
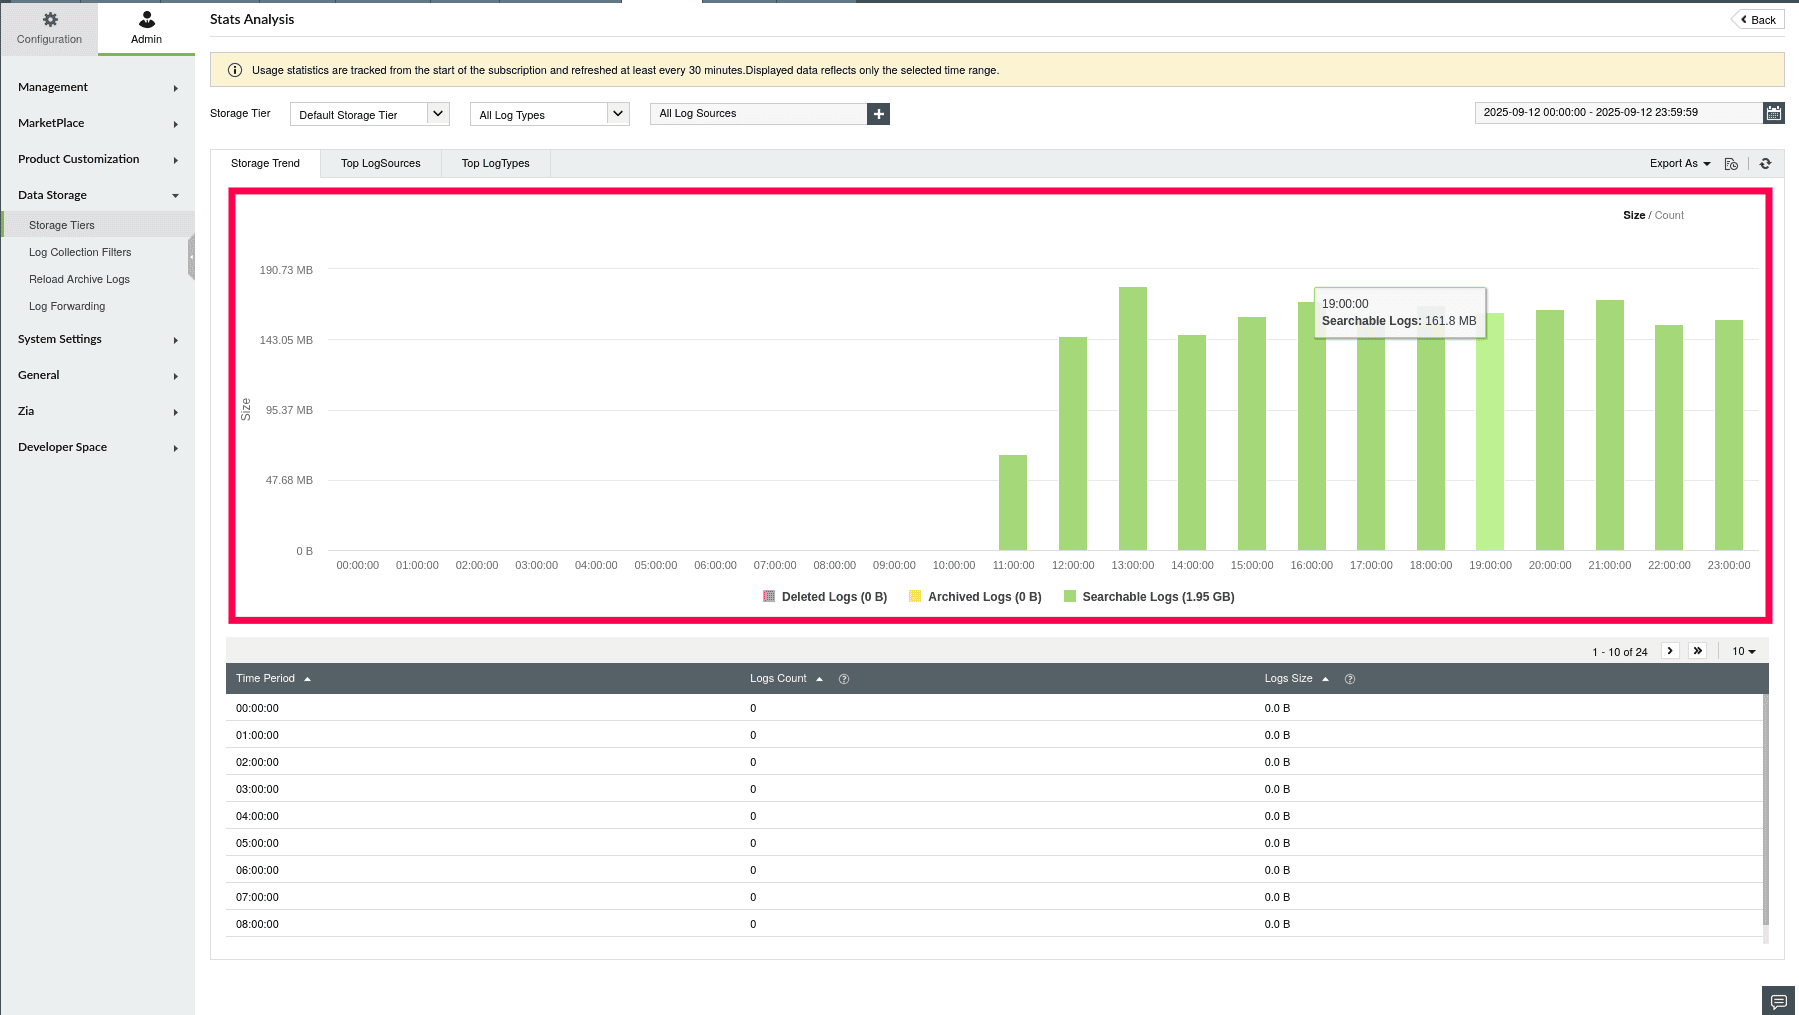
Figure 4: Hourly log trends and metrics
NOTE: The graph supports drill-down from year to month, month to day, and day to hour views.
- Below the graph, a table displays detailed metrics for the selected period:
- Log Size refers to the total size of all collected logs, including Archived, Deleted, and Searchable Logs. Typically shown in MB or GB.
- Log Count refers to the number of individual log entries collected, including Archived, Deleted, and Searchable Logs.
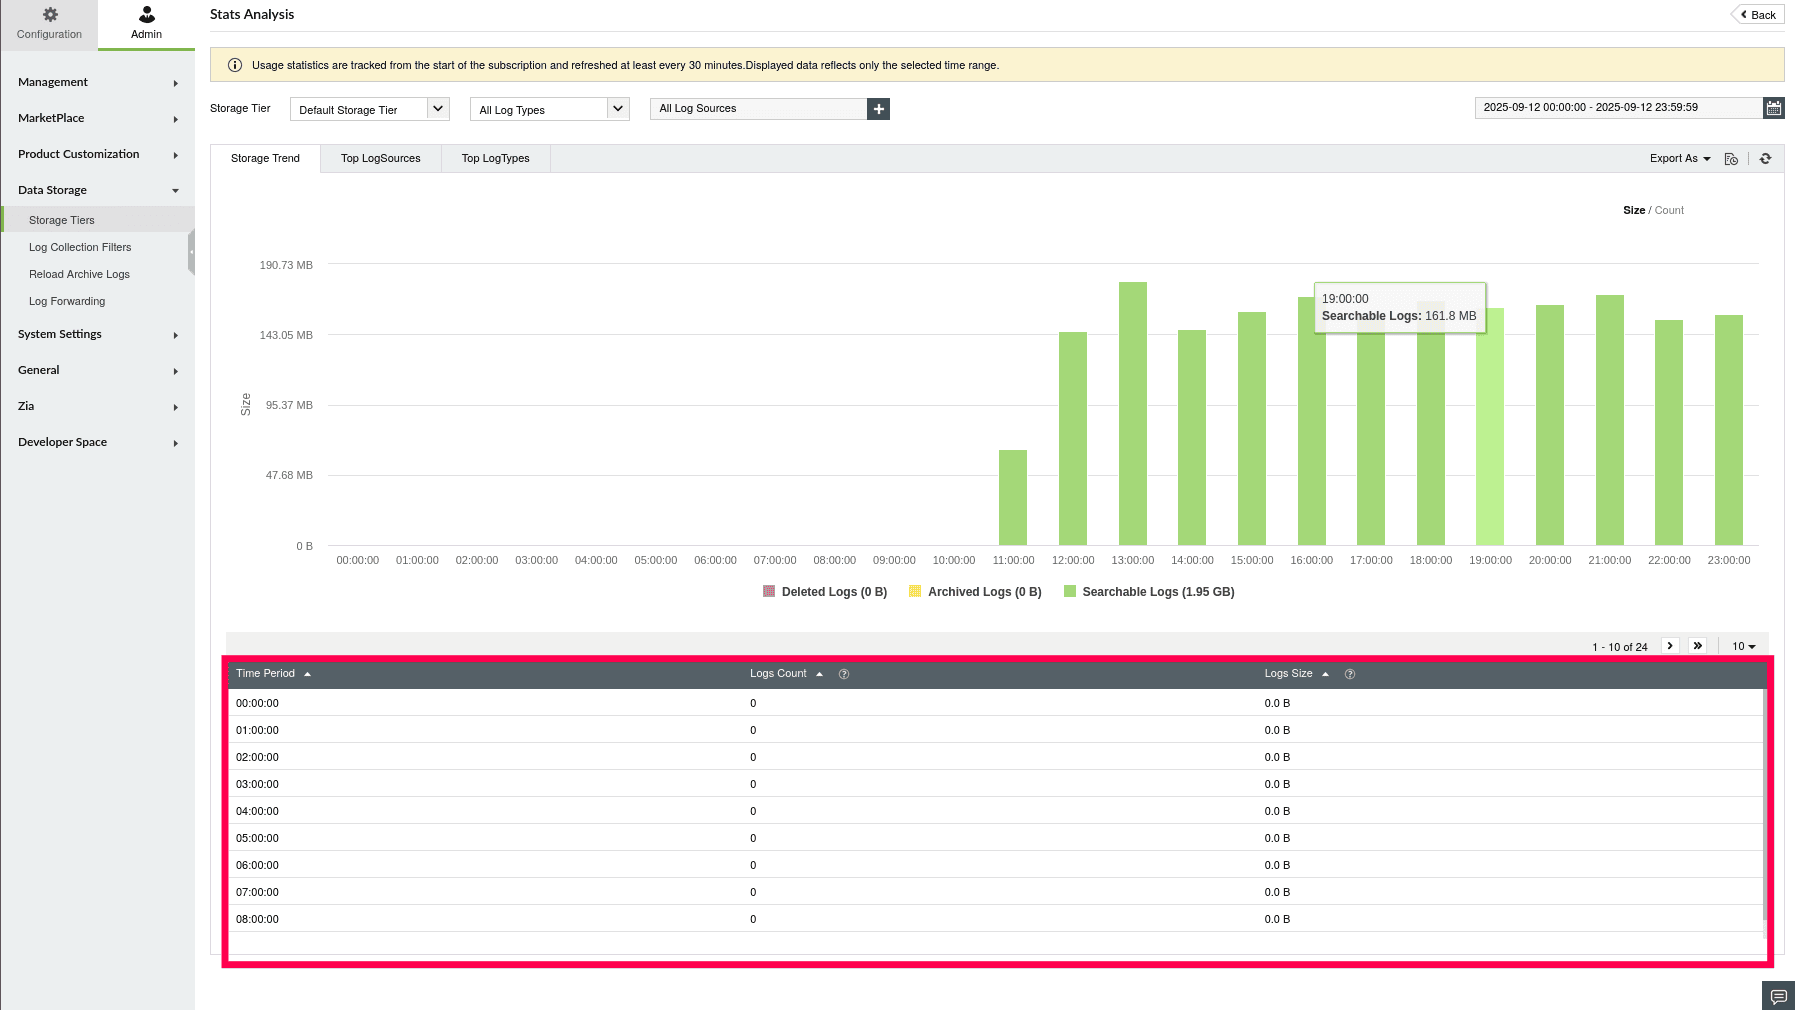
Figure 5: Tabular view of log trends
- The table updates automatically based on the selected drill-down level (year, month, day, or hour).
- Switch to the Top Log Sources tab to view the log size and count from the top contributing sources.
- The graph displays log trends for each source, segmented by Archived, Deleted, and Searchable Logs.
- The table below lists each source name, along with corresponding log size and log count.
NOTE: If configured sources, log types, rules, or profiles are deleted, the related stats logs will be categorized and displayed as Unknown.
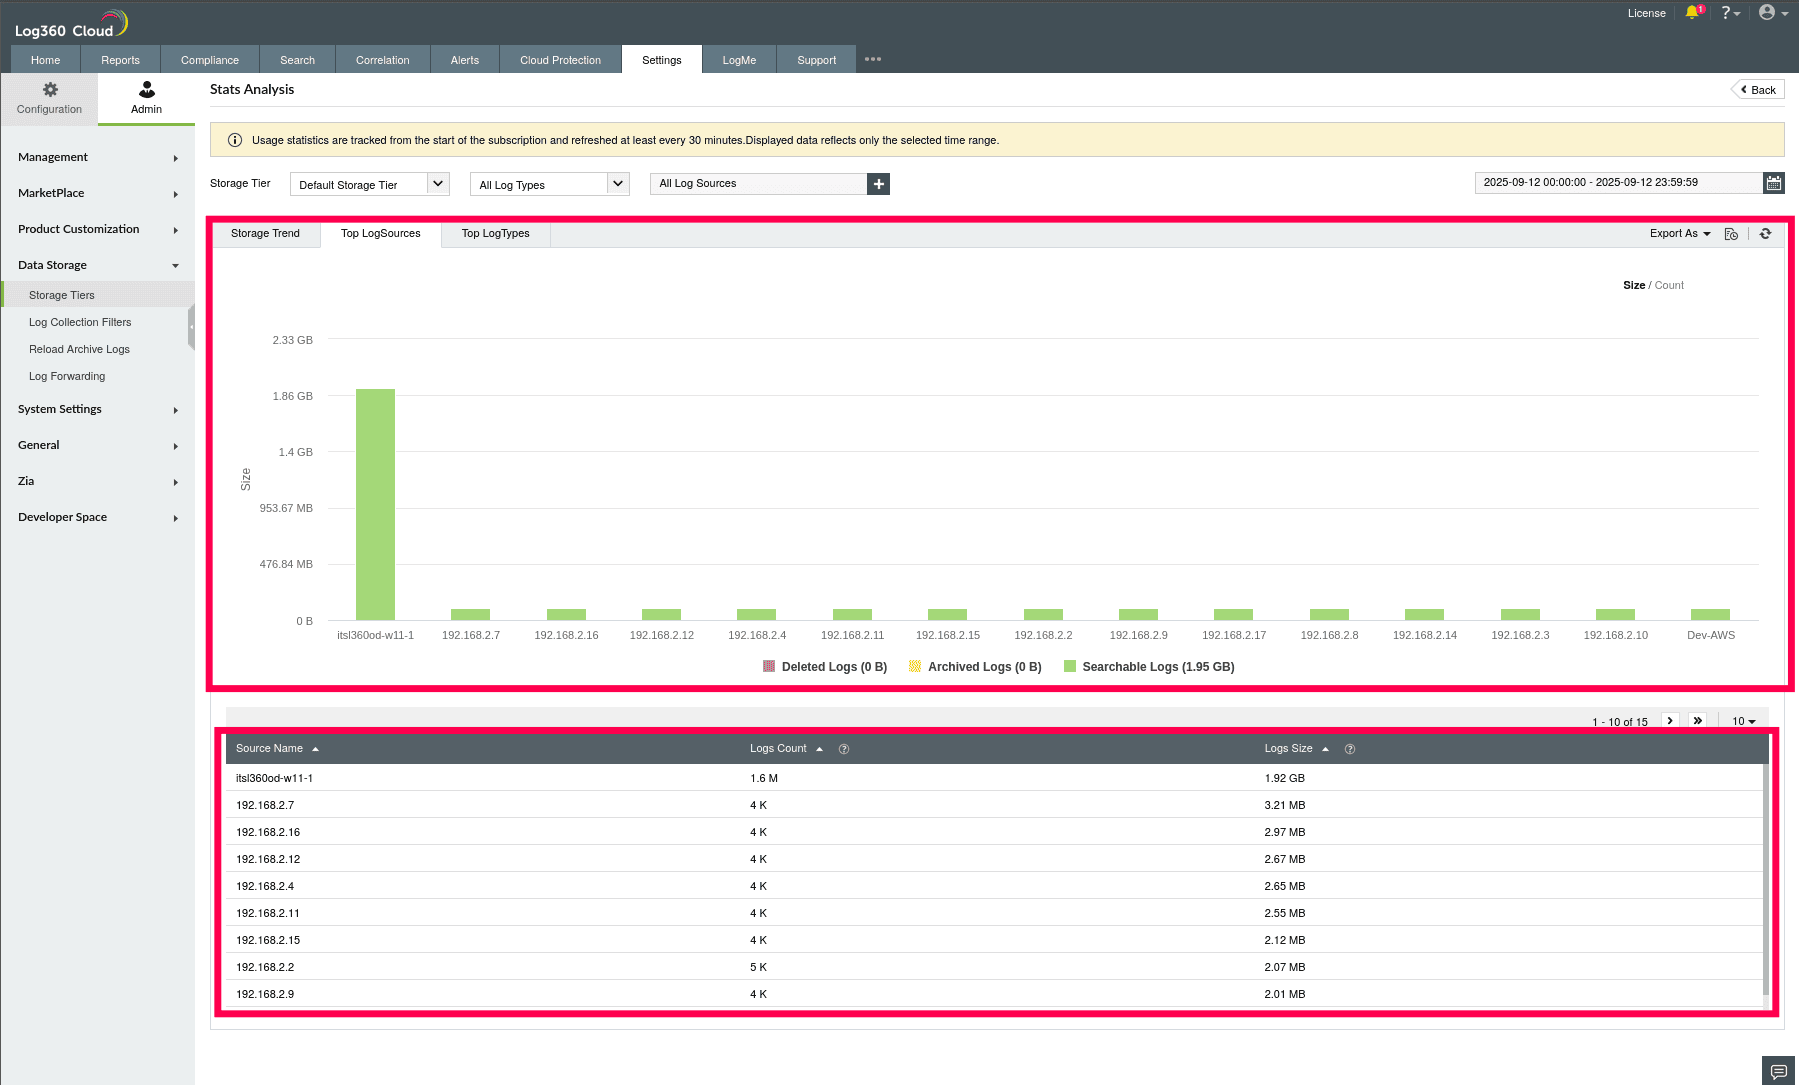
Figure 6: Log metrics by Top Log Sources
NOTE: The graph displays only the top 30, while the table will contain the complete list.
- Switch to the Top Log Types tab to analyze the log volume generated by each log type.
- The graph shows a comparison of log trends across types, segmented by Archived, Deleted, and Searchable Logs.
- The table below shows each log type with its log size and log count.
NOTE: The available tabs and filters in the Stats Analysis view vary based on the selected Storage Tier:
- For Default Storage Tier and Custom Storage Tiers, you can view Top Log Sources and Top Log Types, and filter statistical data by Log Type and Log Source.
- For the Alert Storage Tier, the Top Alert Profiles tab highlights the alert configurations that matched the highest number of logs. Filters are based on Alert Profiles
- For the Correlation Storage Tier, the Top Rules tab lists the rules that matched the highest number of log entries. Filters are based on Correlation Rules.
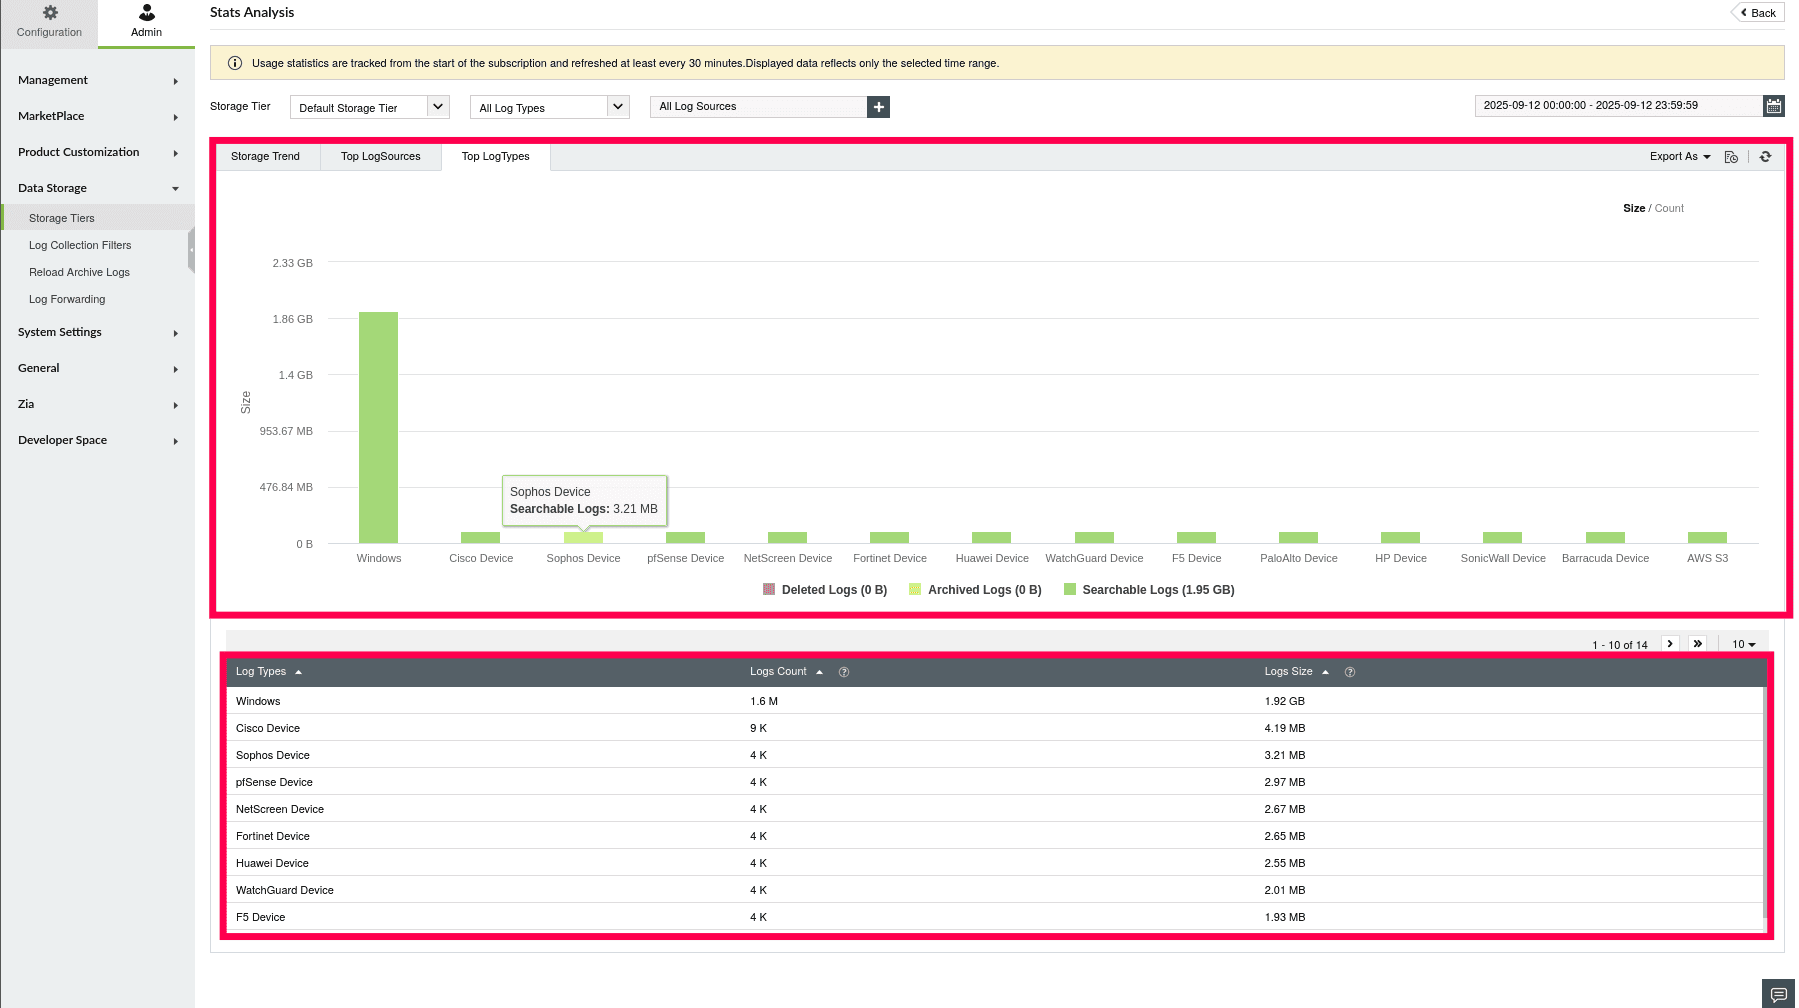
Figure 7: Log metrics by Top Log Types
NOTE: The graph displays only the top 30, while the table will contain the complete list.
- Click Count above the graph to switch from a size-based view to a count-based view.
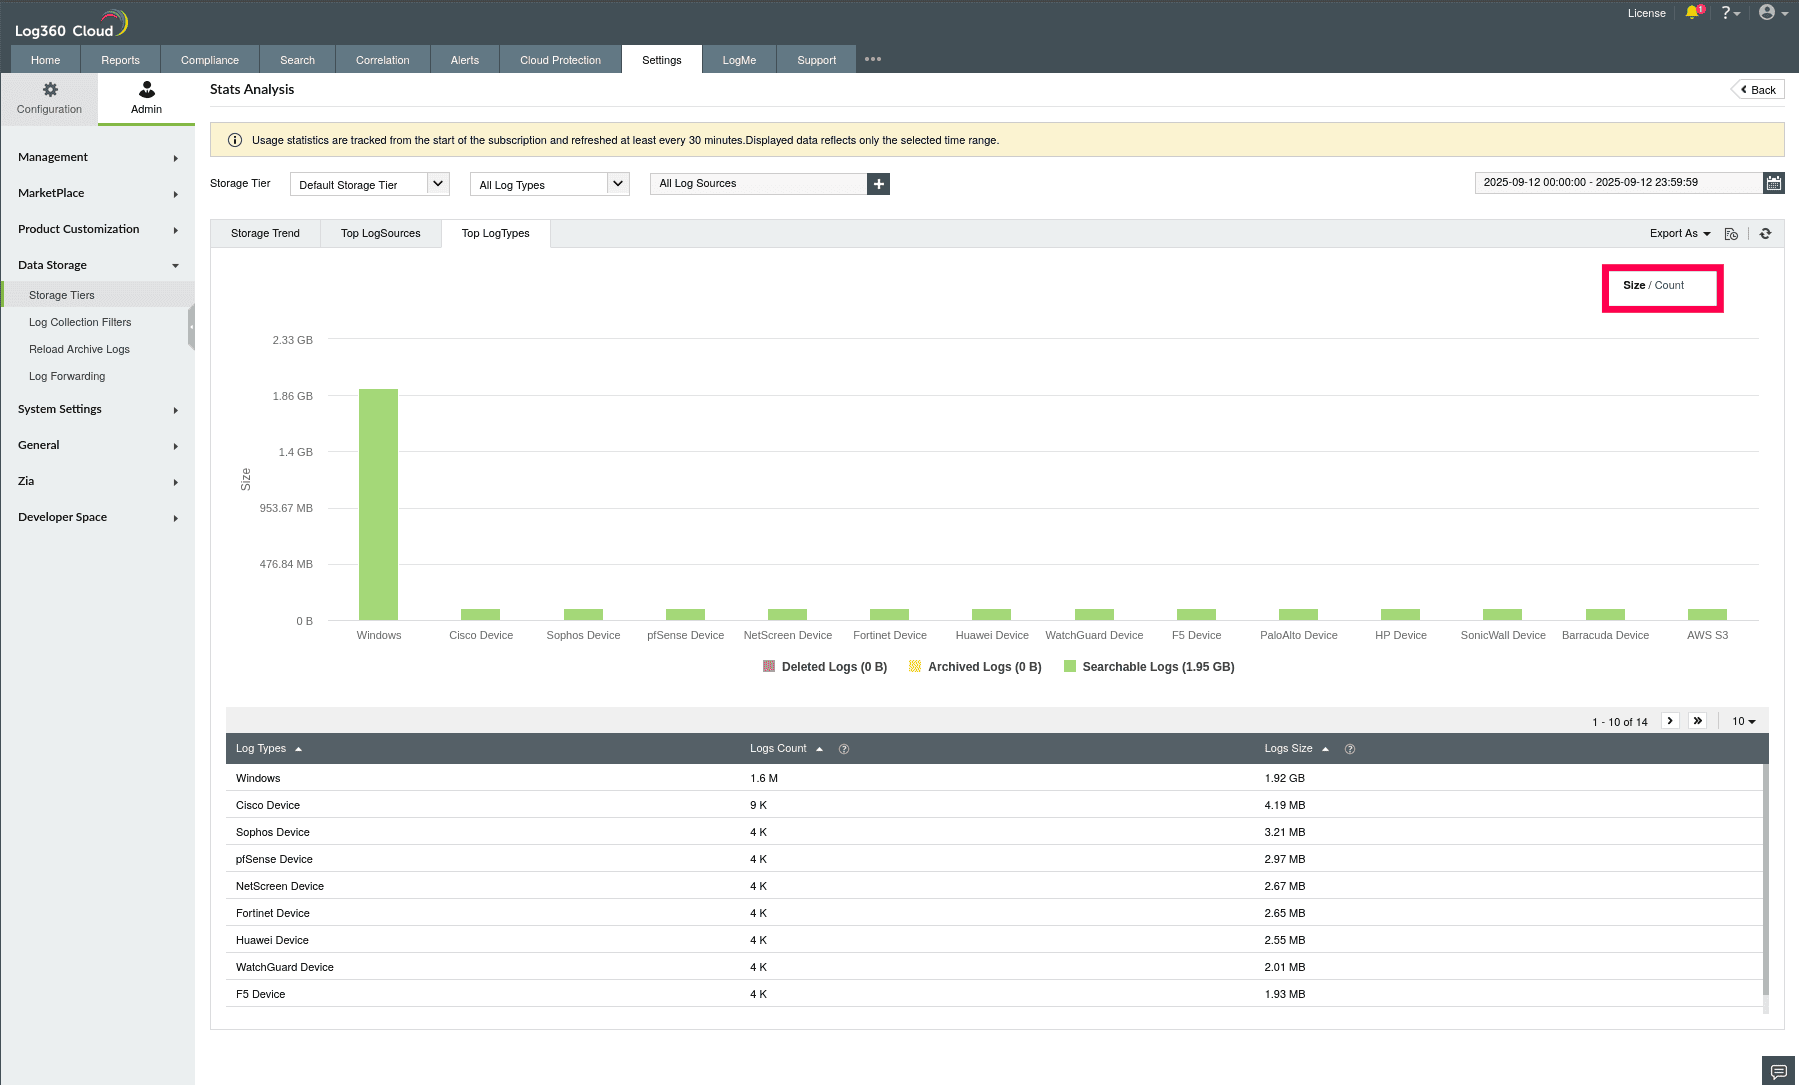
Figure 8: Viewing Logs by Count
- This allows you to analyze the number of log entries instead of total log volume.
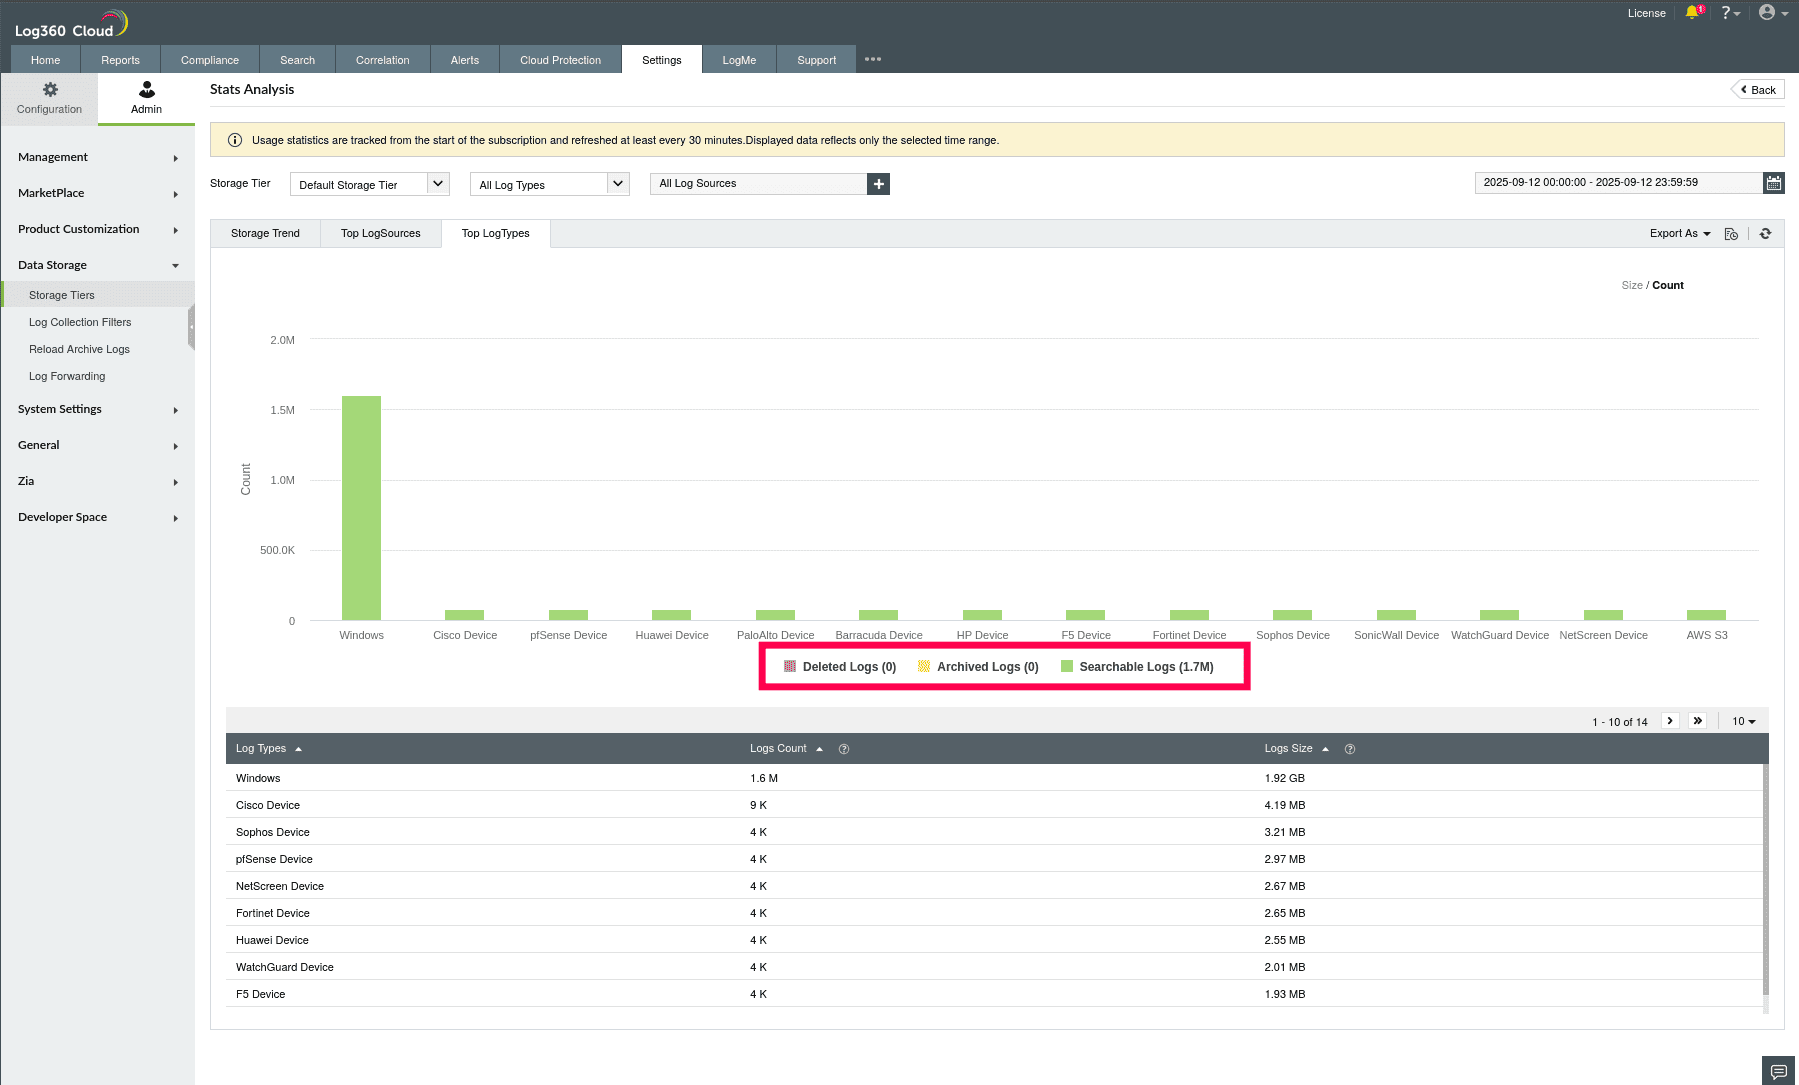
Figure 9: Viewing Logs by Count
Exporting Stats Analysis
- In the Stats Analysis page, click the Export As dropdown located at the top-right corner of the chart area.
- Select Export as PDF or Export as CSV to download the stats analysis.
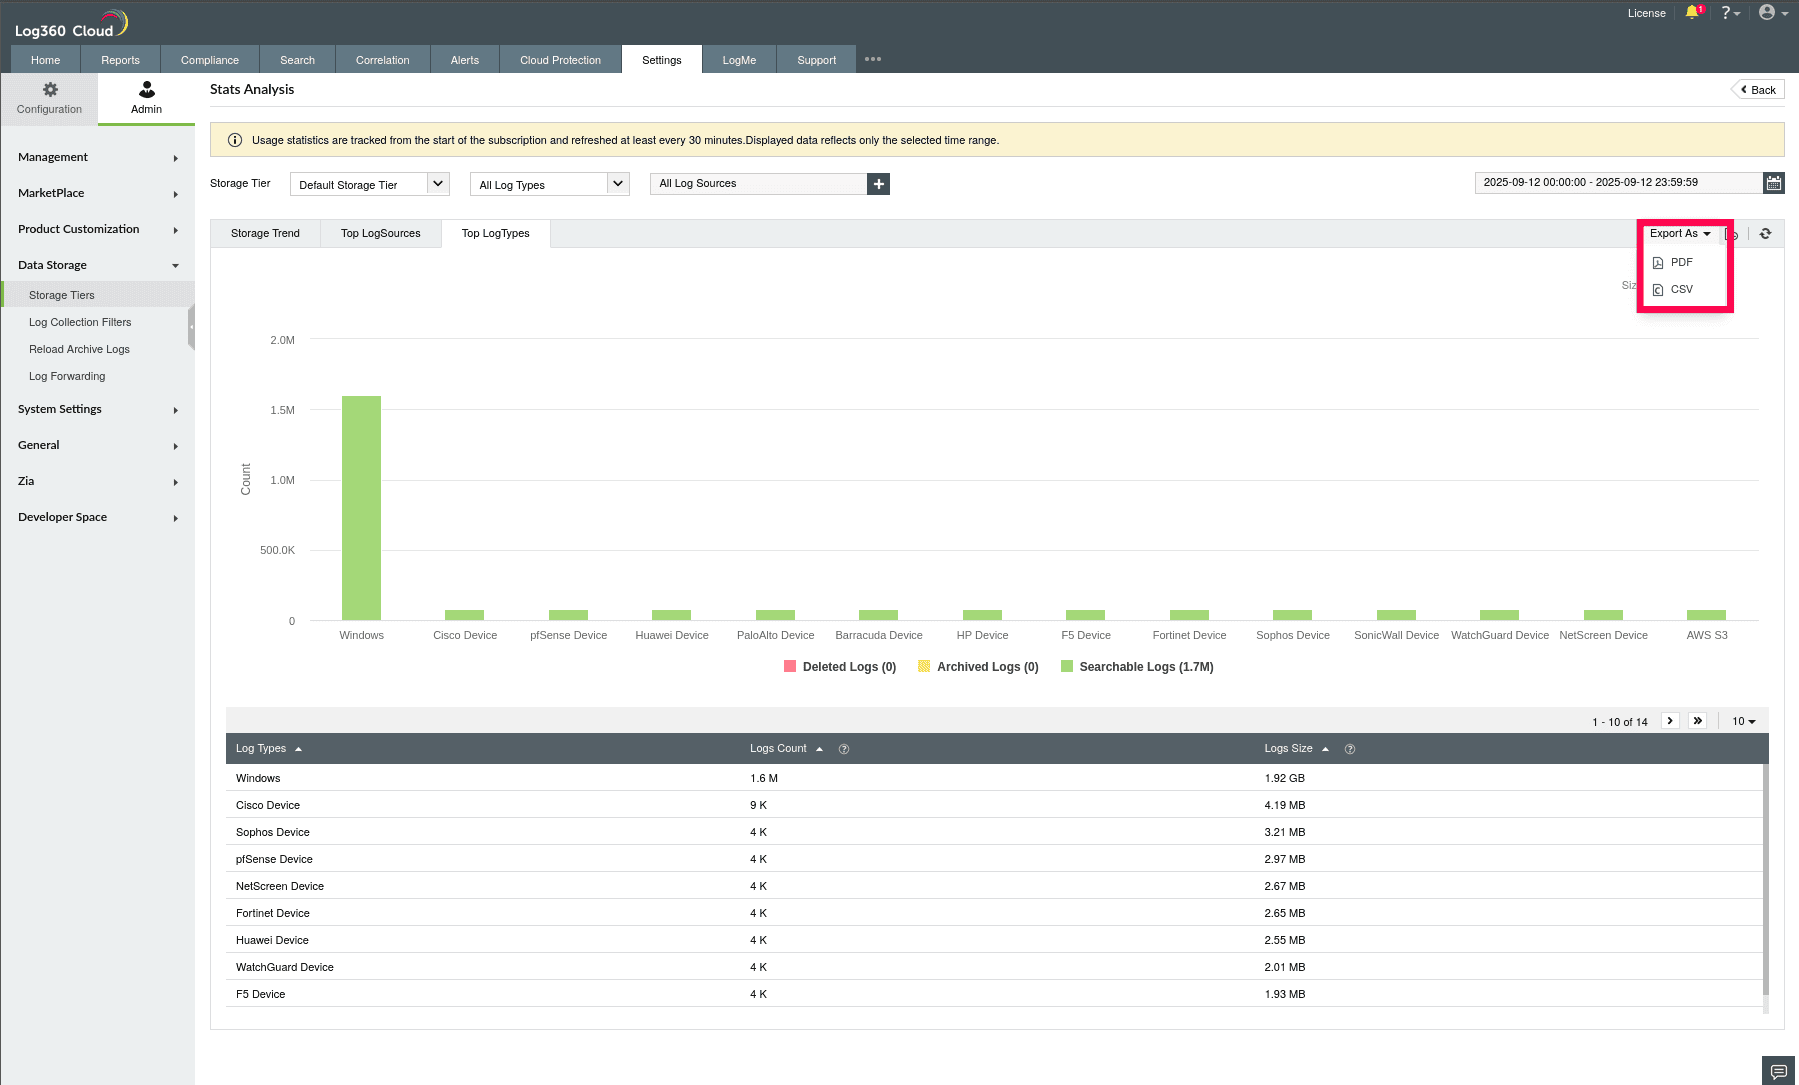
Figure 10: Exporting Stats Analysis
- Click the
 icon to view the status of your export progress.
- Hover over an entry. Click Download to download the file, or click Clear to remove the entry.
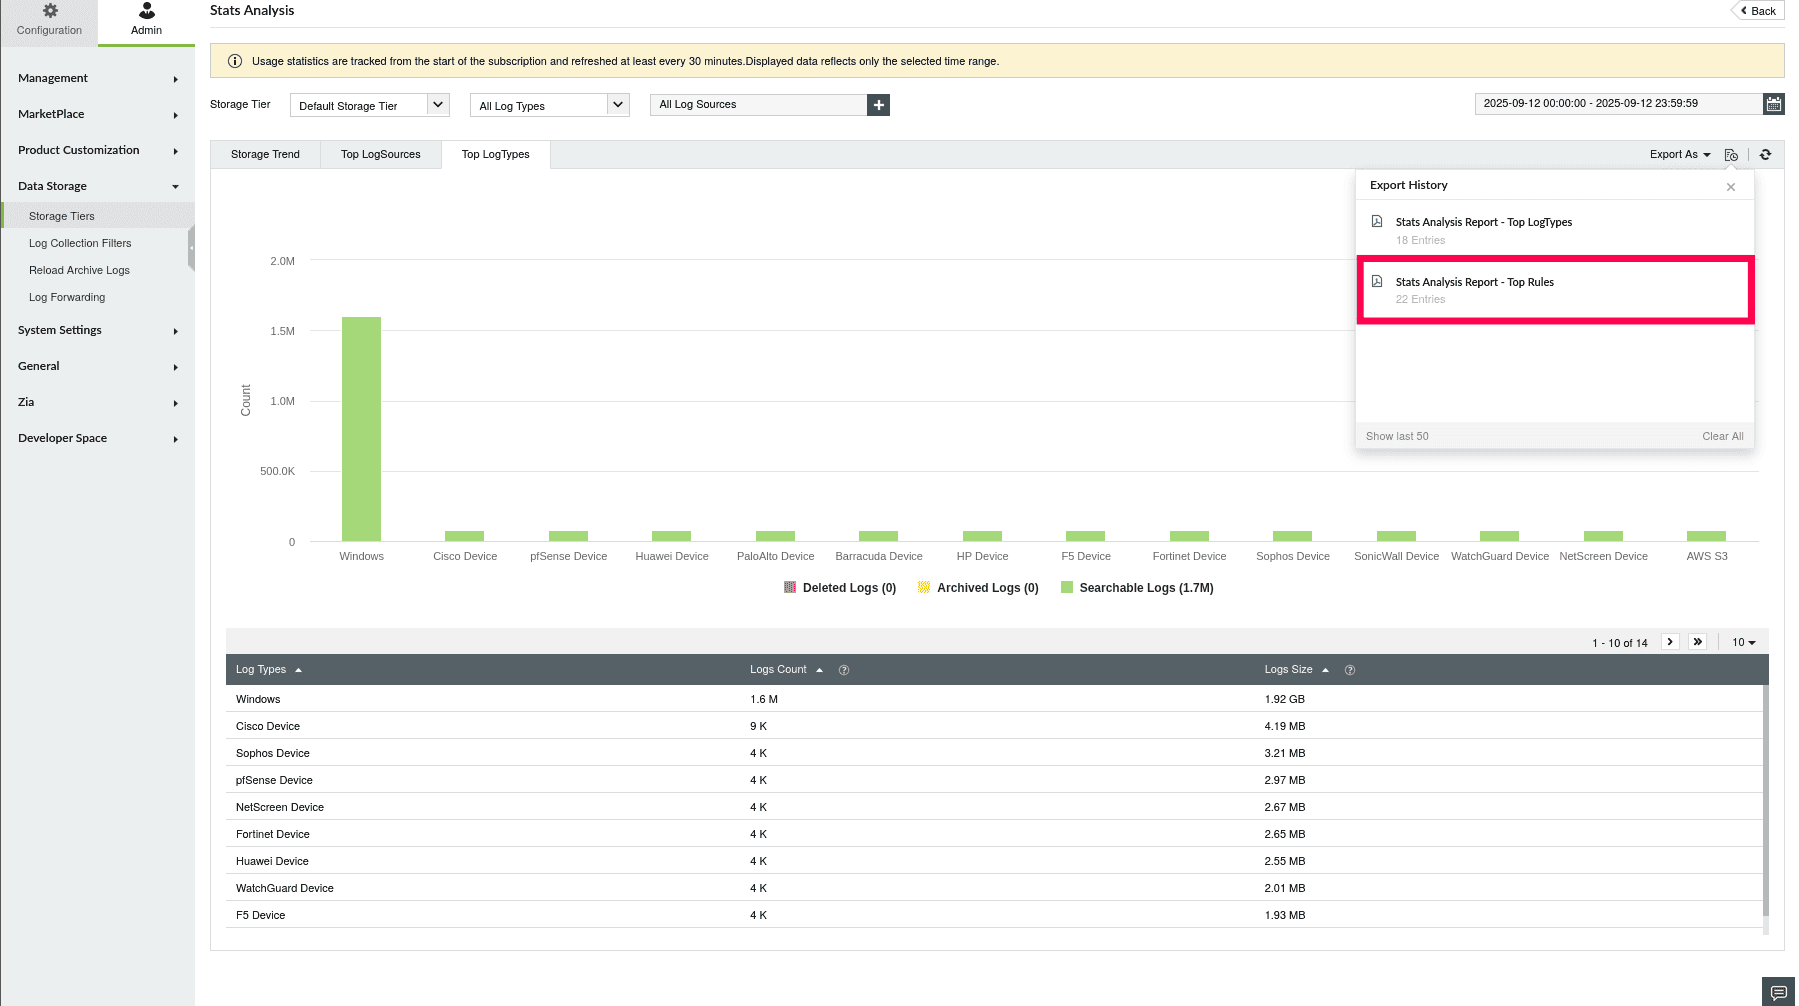
Figure 11: Status of export progress
Filtering Stats for Default Storage Tier
- In the Stats Analysis page, click the dropdown under Storage Tier.
- Under Log Management, select Default Storage Tier.
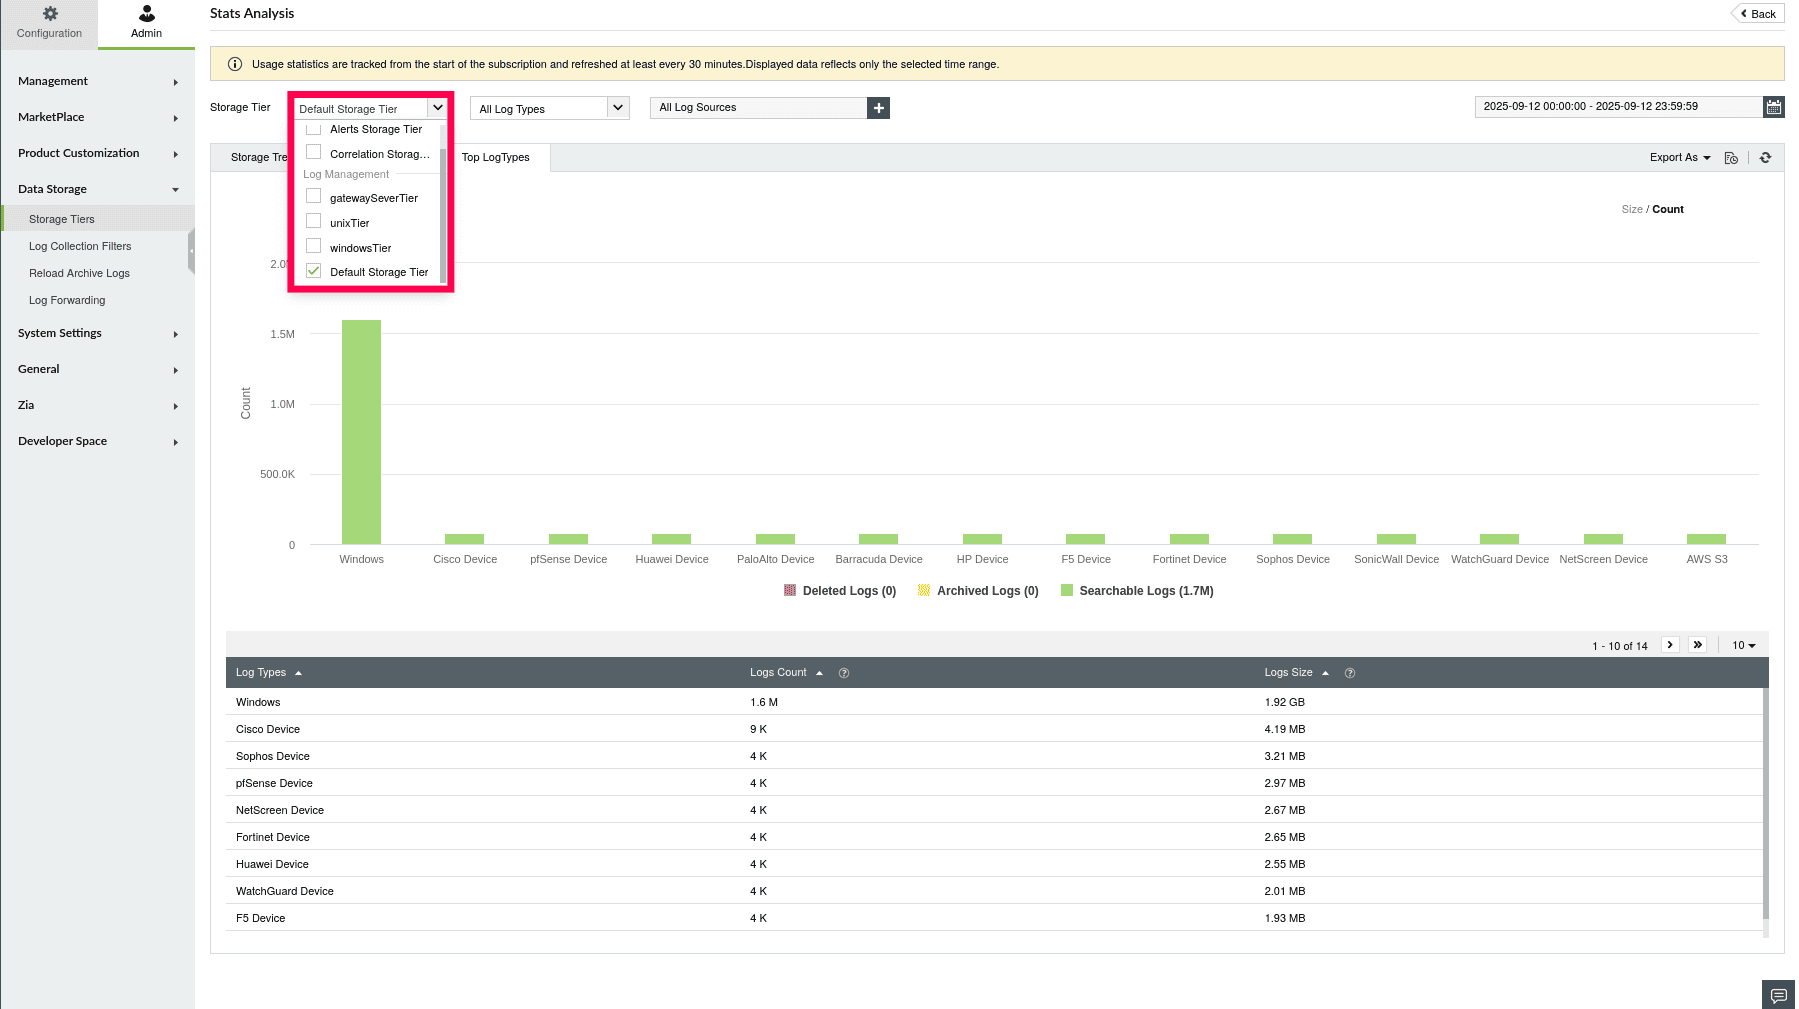
Figure 12: Filtering Stats for Default Storage Tier
- Use the Log Type dropdown to select Log Types of your choice. You can select up to 50 Log Types.
NOTE: By default, all Log Types and Log Sources are selected.
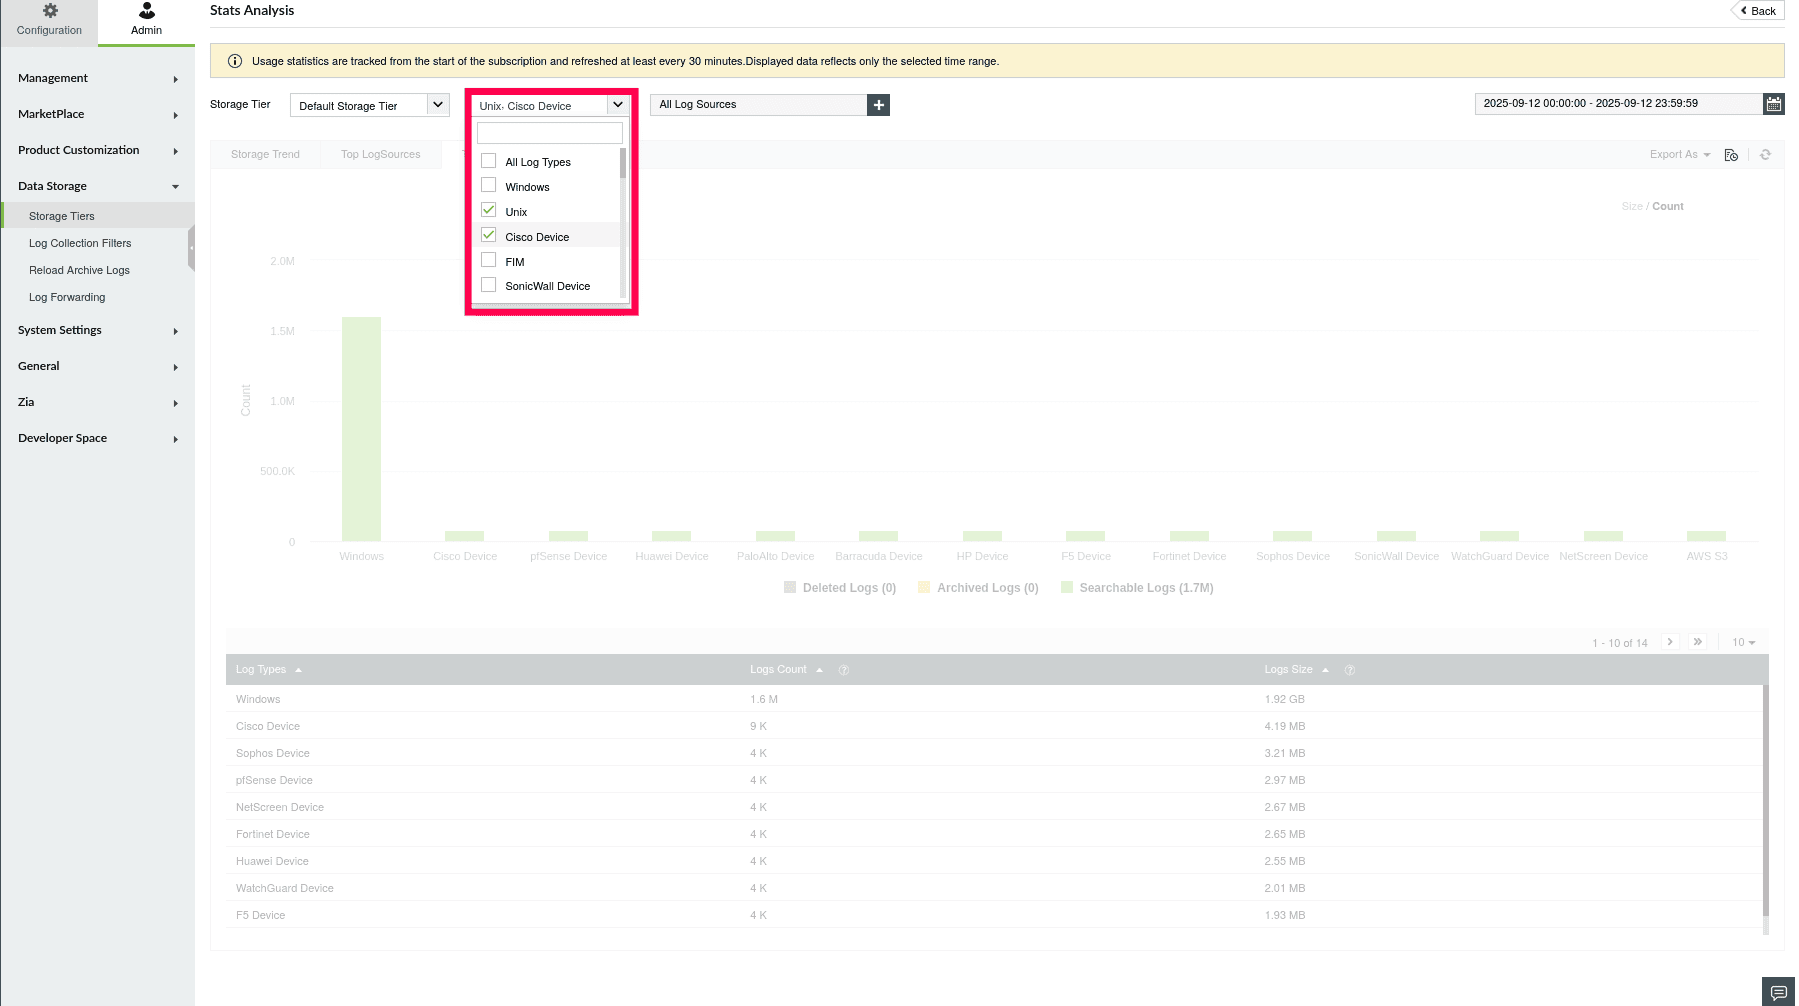
Figure 13: Selecting Log Types
- Click the
 icon to select Log Sources.
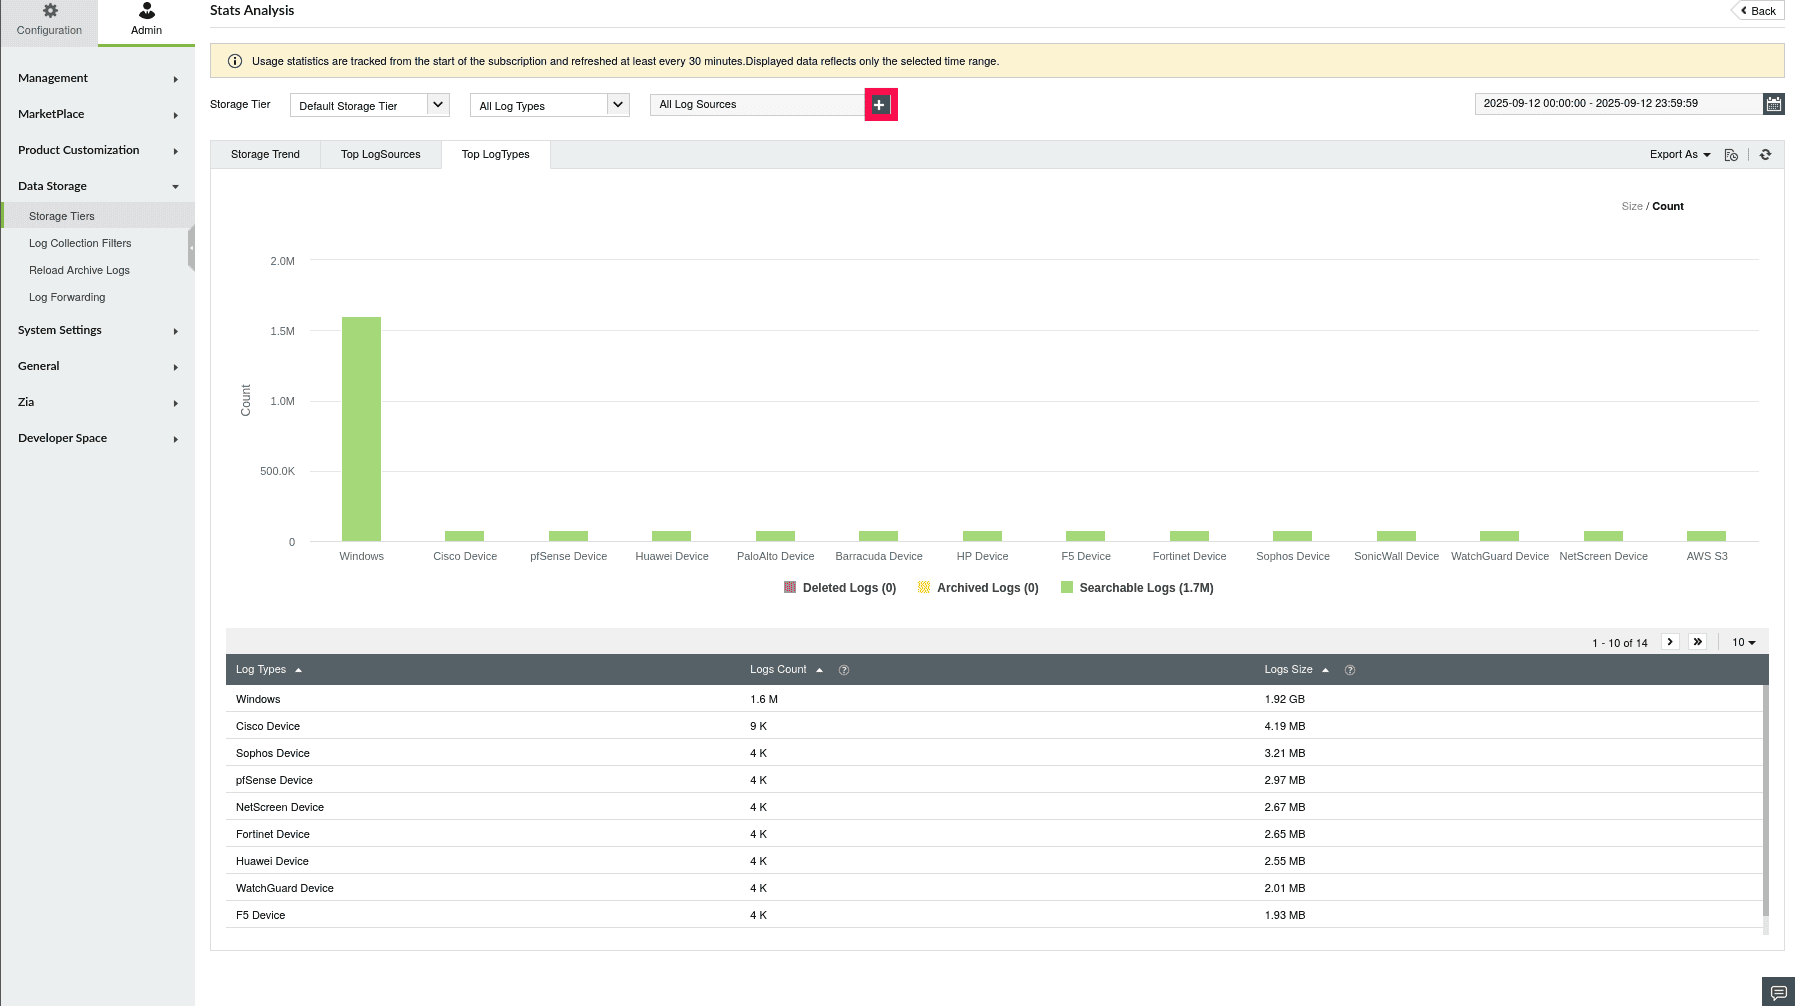
Figure 14: Selecting Log Sources
- Choose the required sources and click OK. You can select up to 300 Log Sources.
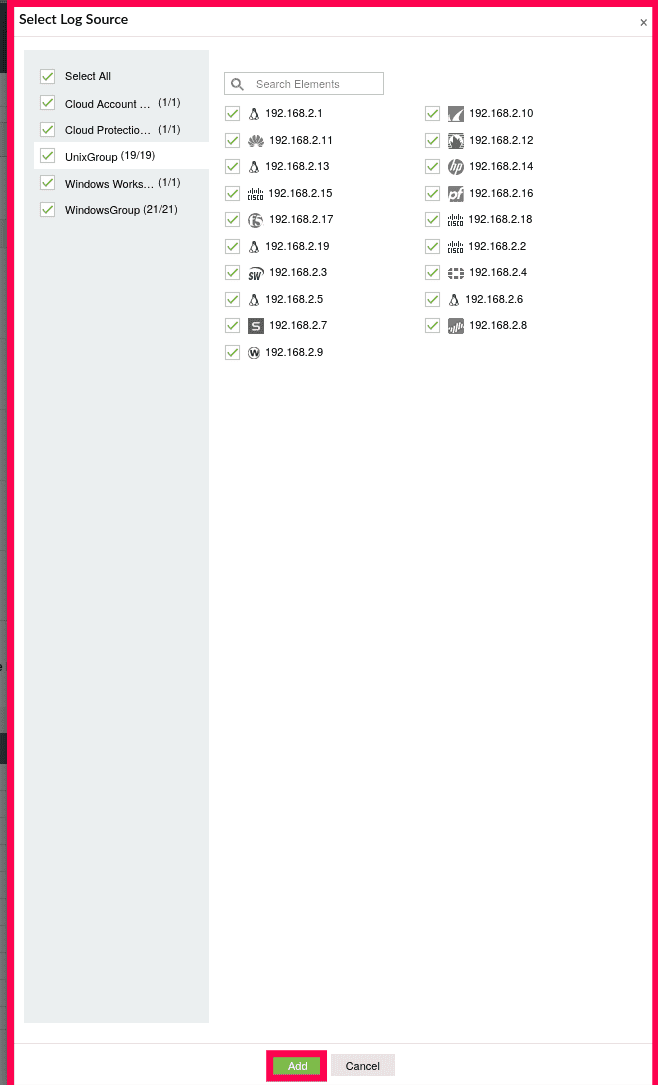
Figure 15: Selecting Log Sources
- The page will refresh to display statistical data for logs routed to the Default Storage Tier.
Filtering Stats for Correlation Storage Tier
- In the Stats Analysis page, click the dropdown under Storage Tier.
- Under Log Analytics, select Correlation Storage Tier.
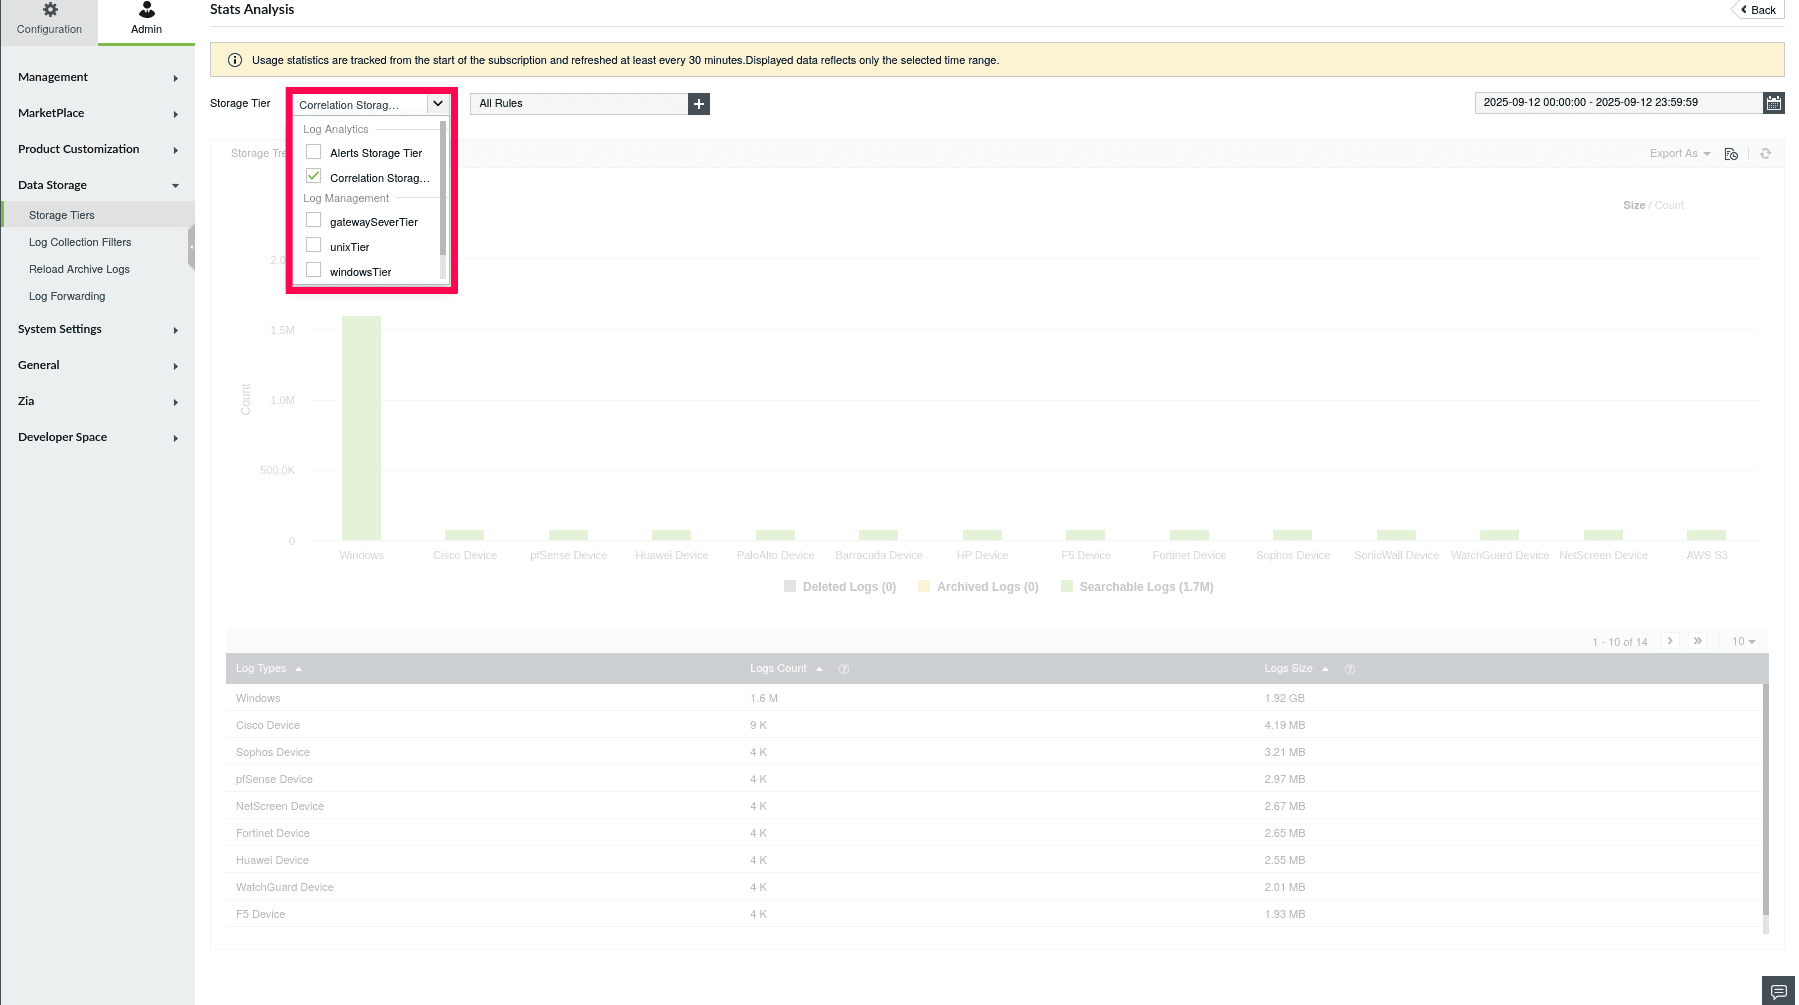
Figure 16: Selecting Log Sources
- Click the icon to select the Correlation Rules.
NOTE: By default, all Correlation Rules are selected.
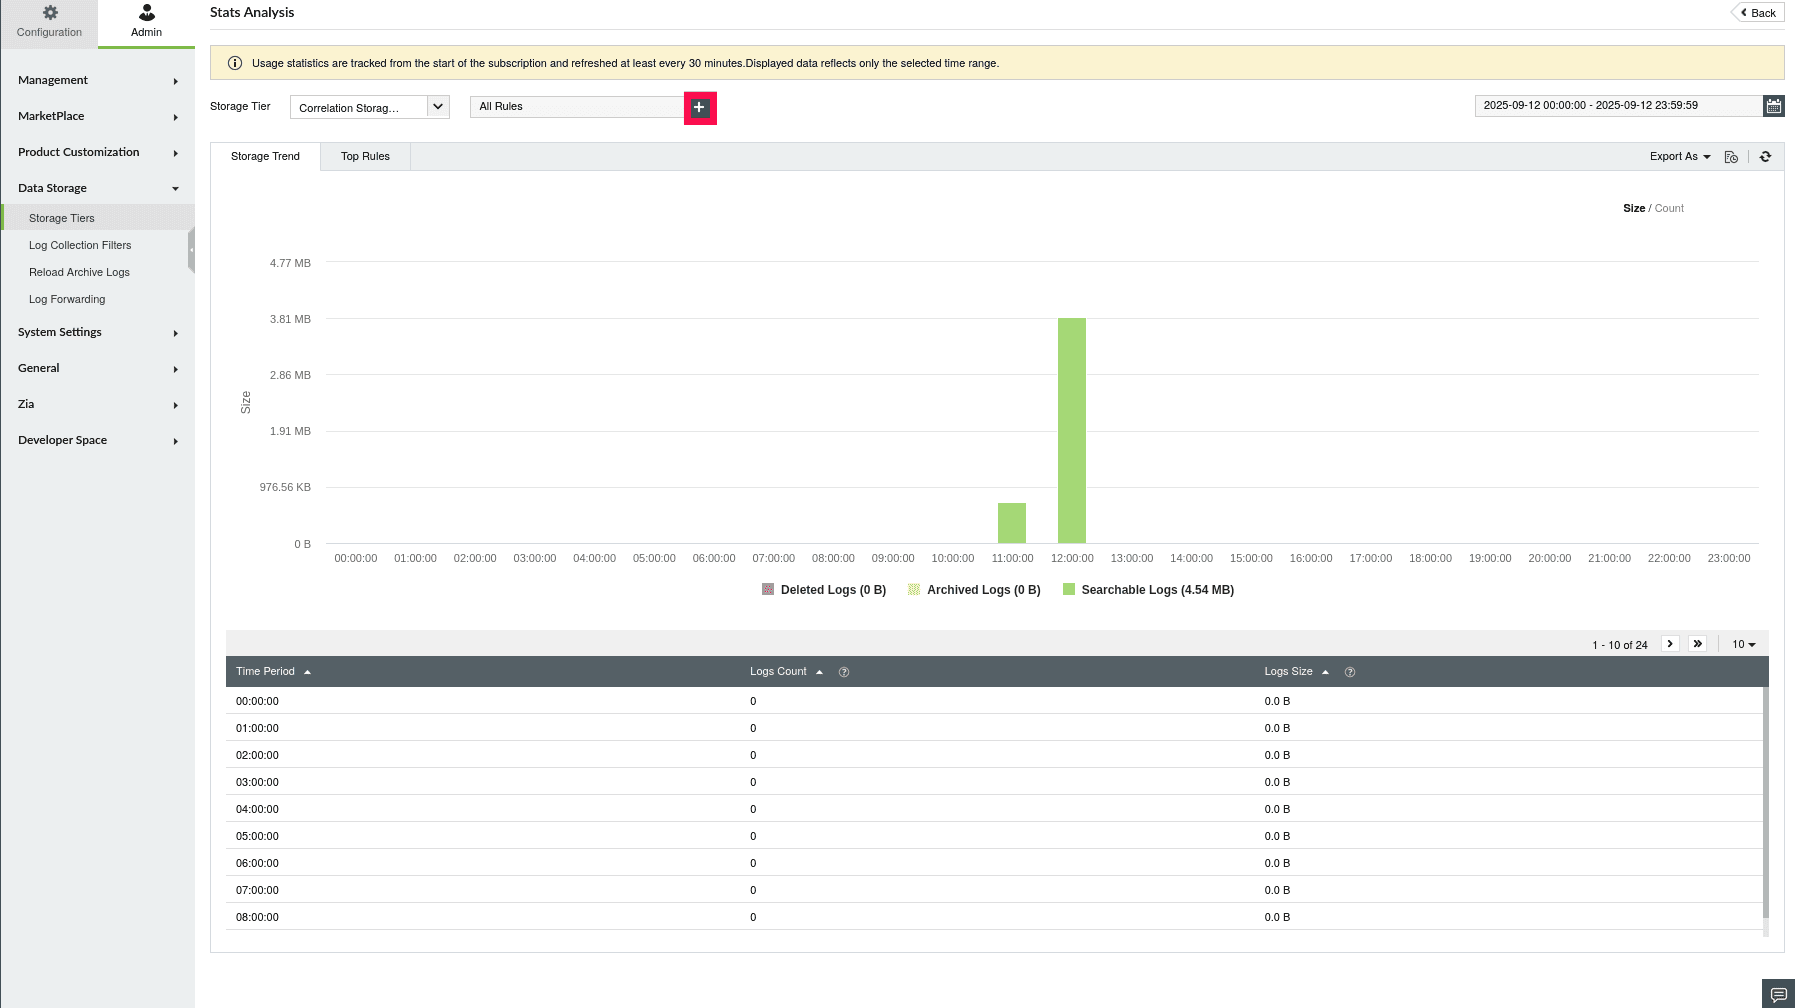
Figure 17: Selecting Correlation Rules
- You can also use the
 icon to search for specific Correlation Rules by name.
- Choose the required Rules and click Apply. You can select up to 100 Rules.
NOTE: Refer to
this document to create or manage correlation rules.
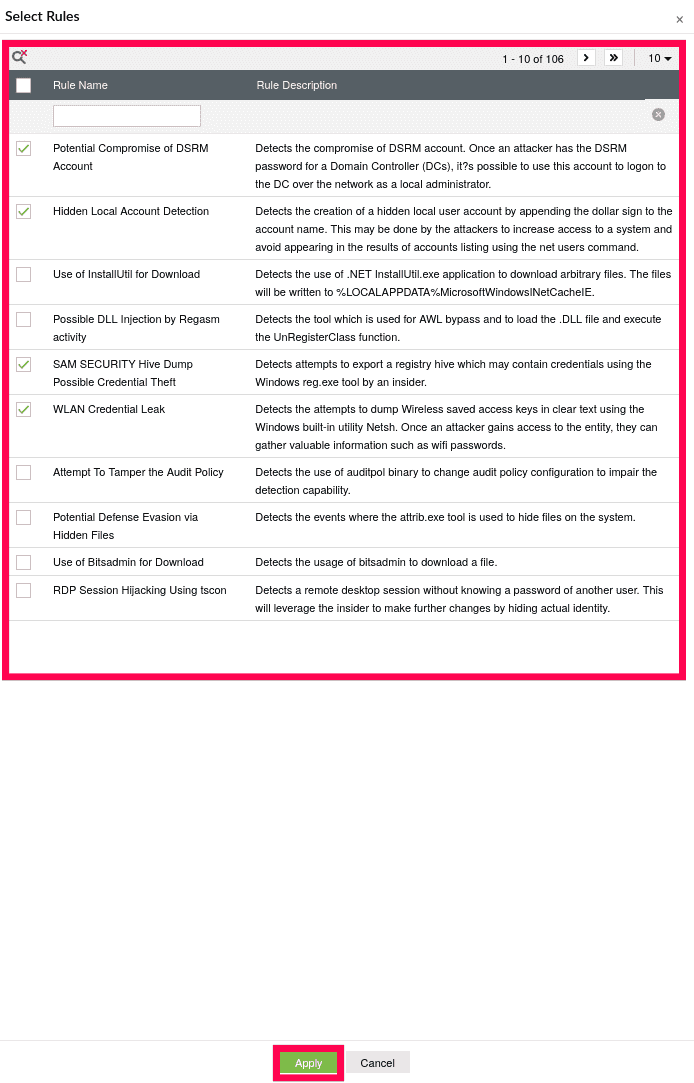
Figure 18: Selecting Correlation Rules
- The page will refresh to display statistical data for logs routed to the Correlation Storage Tier.
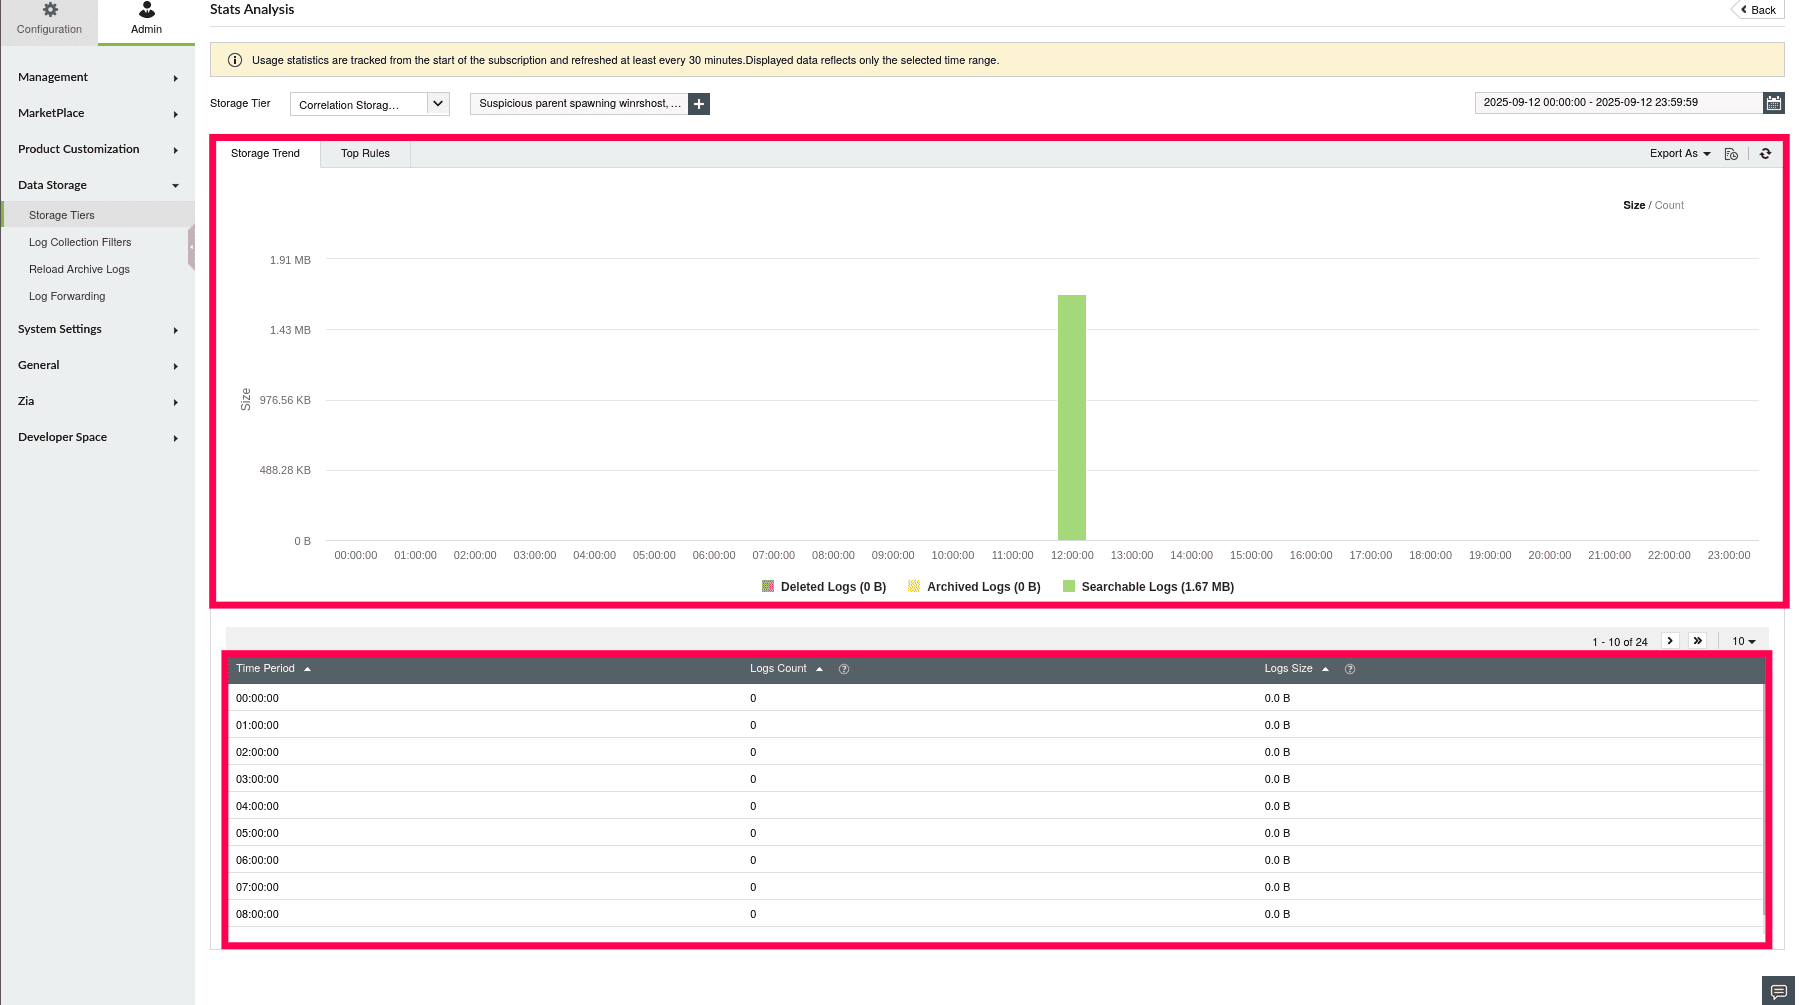
Figure 19: Statistical data for selected Correlation Rules
Filtering Stats for Alert Storage Tier
- In the Stats Analysis page, click the dropdown under Storage Tier.
- Under Log Analytics, select Alert Storage Tier.
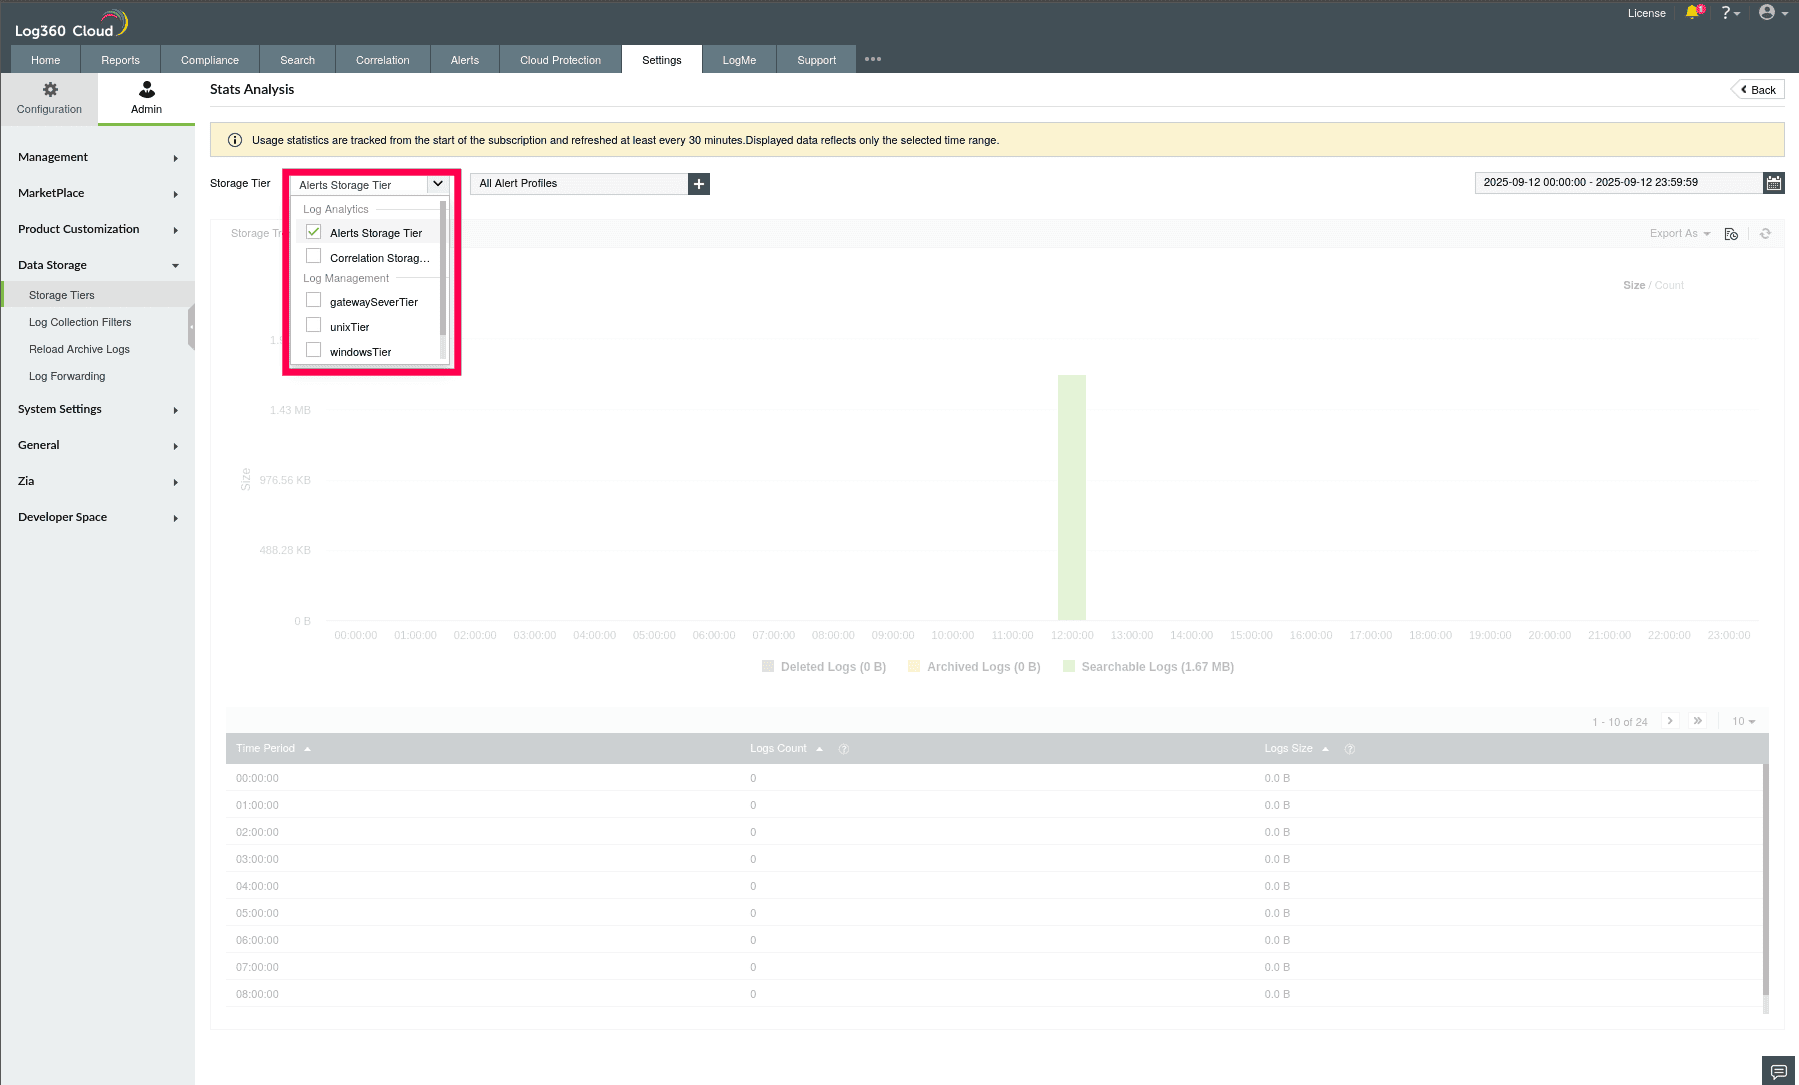
Figure 20: Filtering Stats for Alert Storage Tier
- Click the icon to select the Alert Profiles.
NOTE: By default, all Alert Profiles are selected.
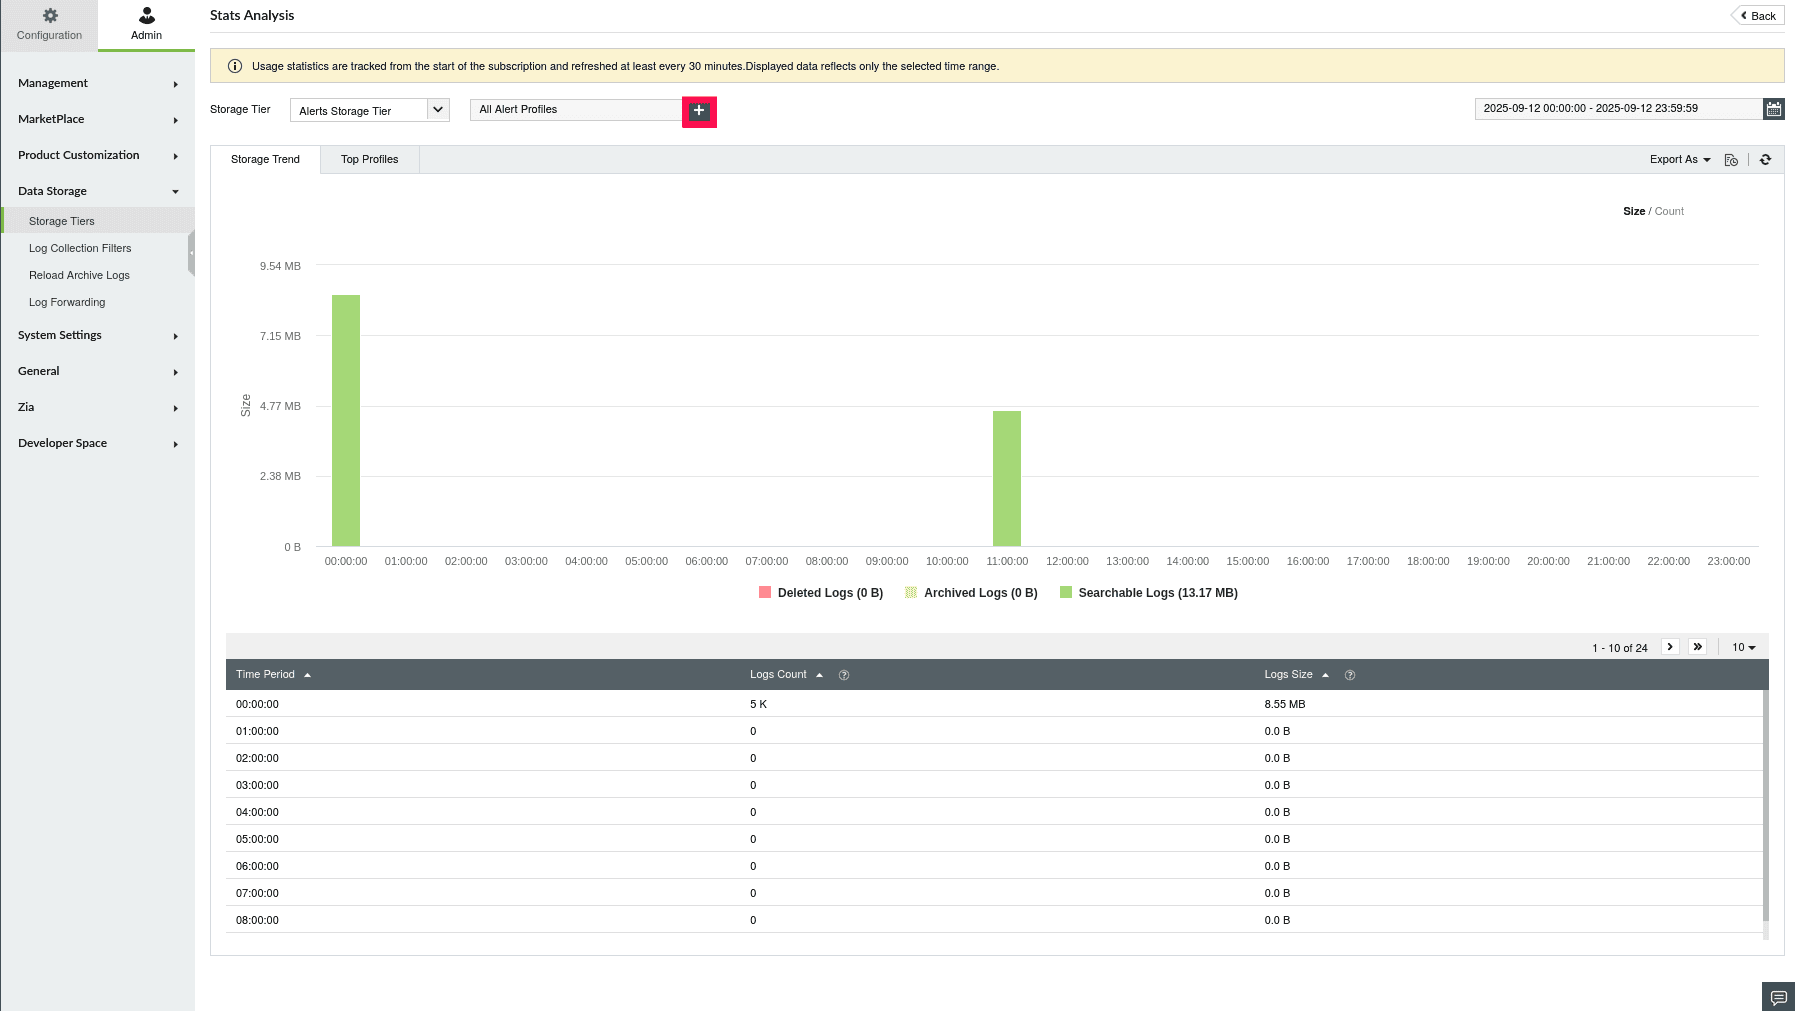
Figure 21: Selecting Alert Profiles
- You can also use the icon to filter alert profiles by name or severity.
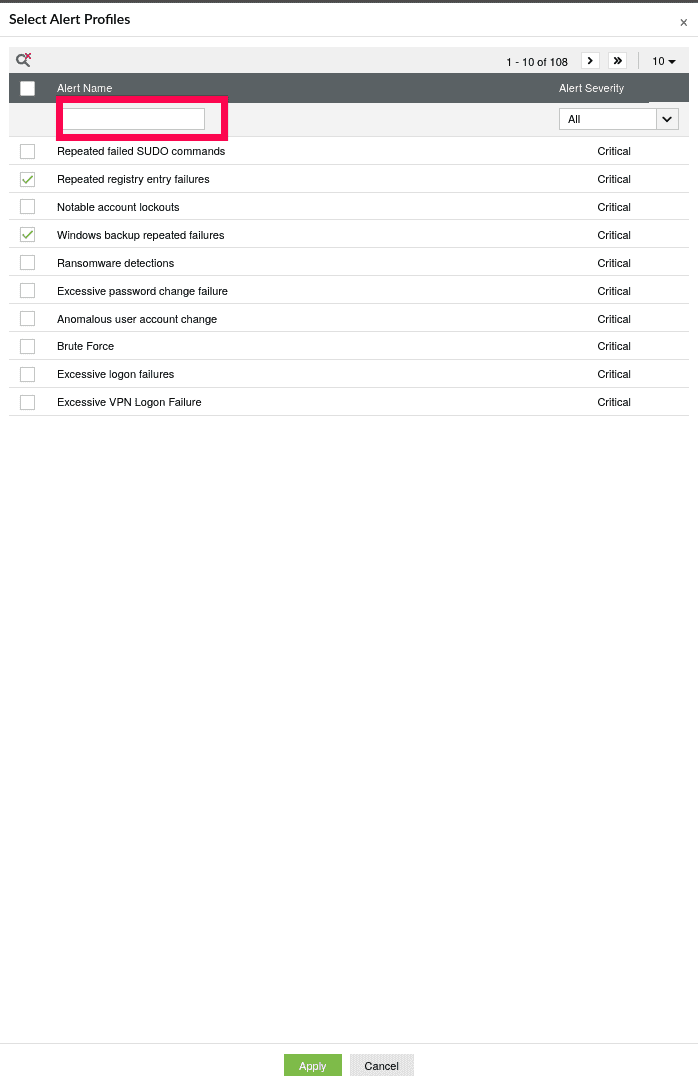
Figure 22: Selecting Alert Profiles
- Choose the required Alert Profiles and click Apply. You can select up to 100 Alert Profiles.
NOTE: Refer to
this document to create alert profiles.
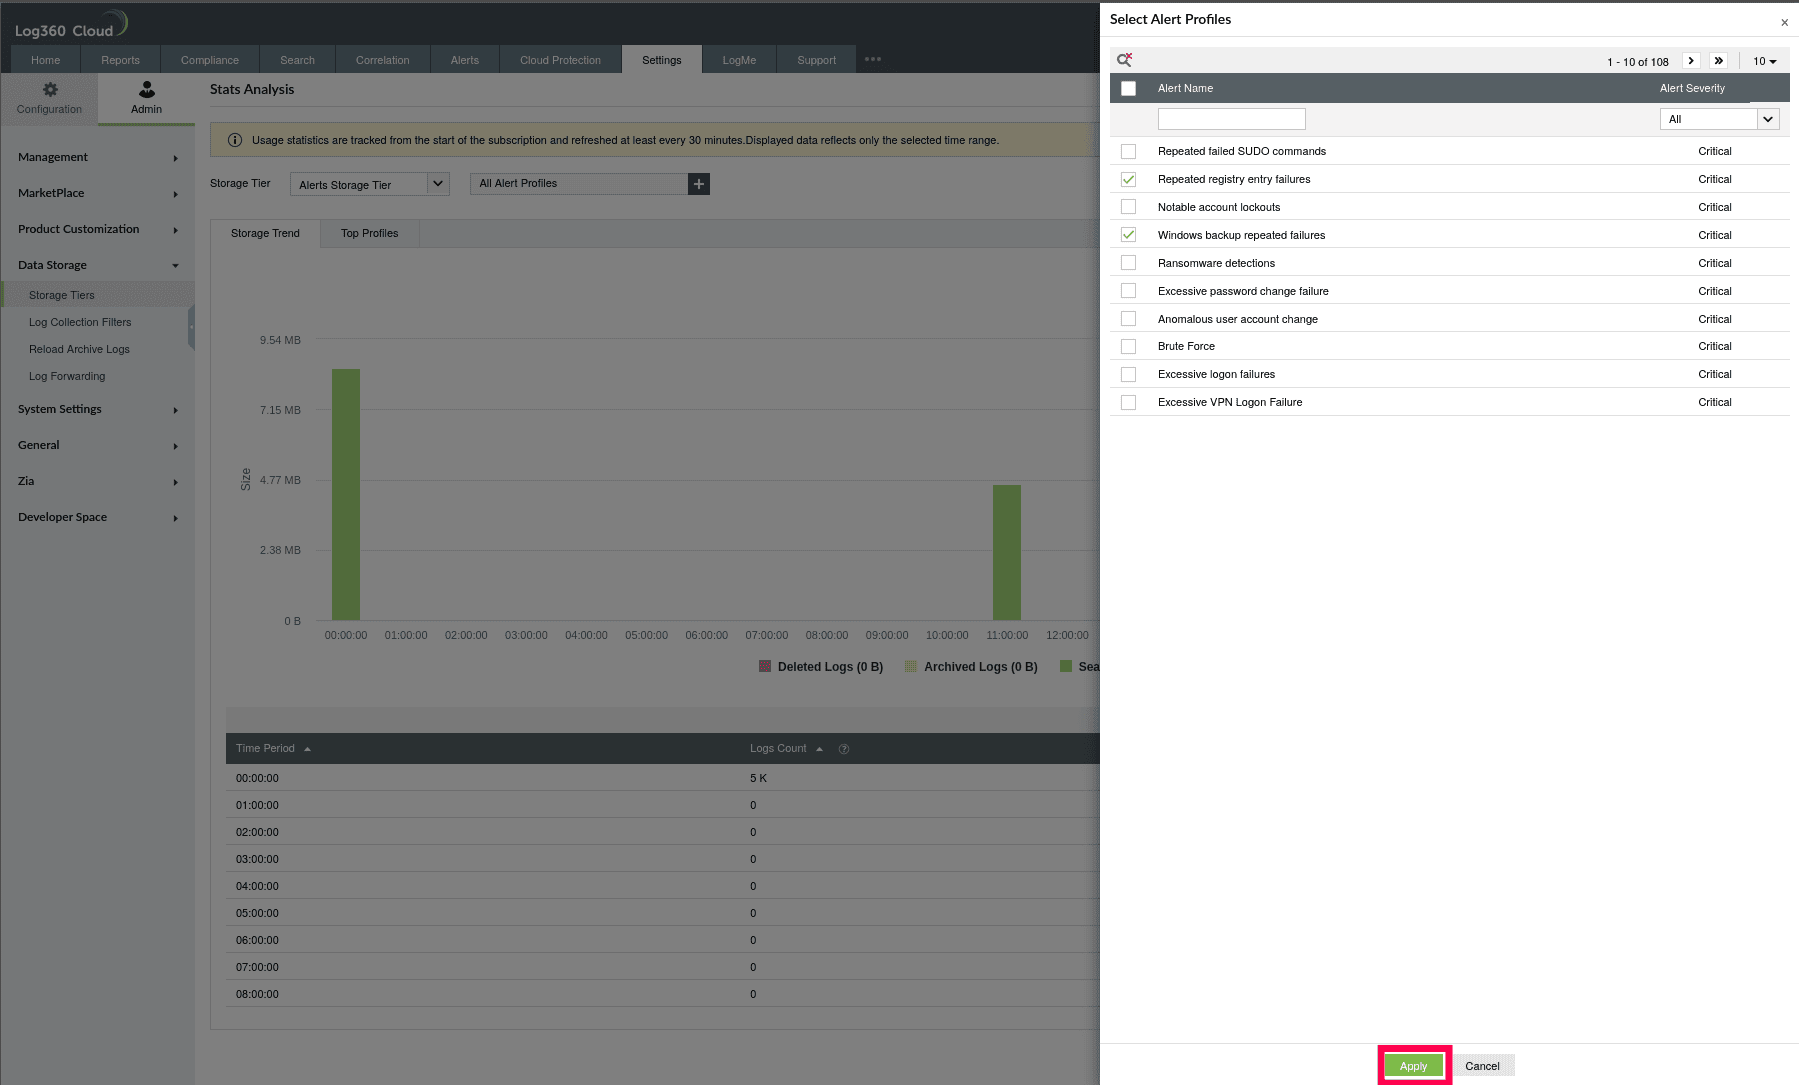
Figure 23: Selecting Alert Profiles
- The page will refresh to display statistical data for logs routed to the Alert Storage Tier.
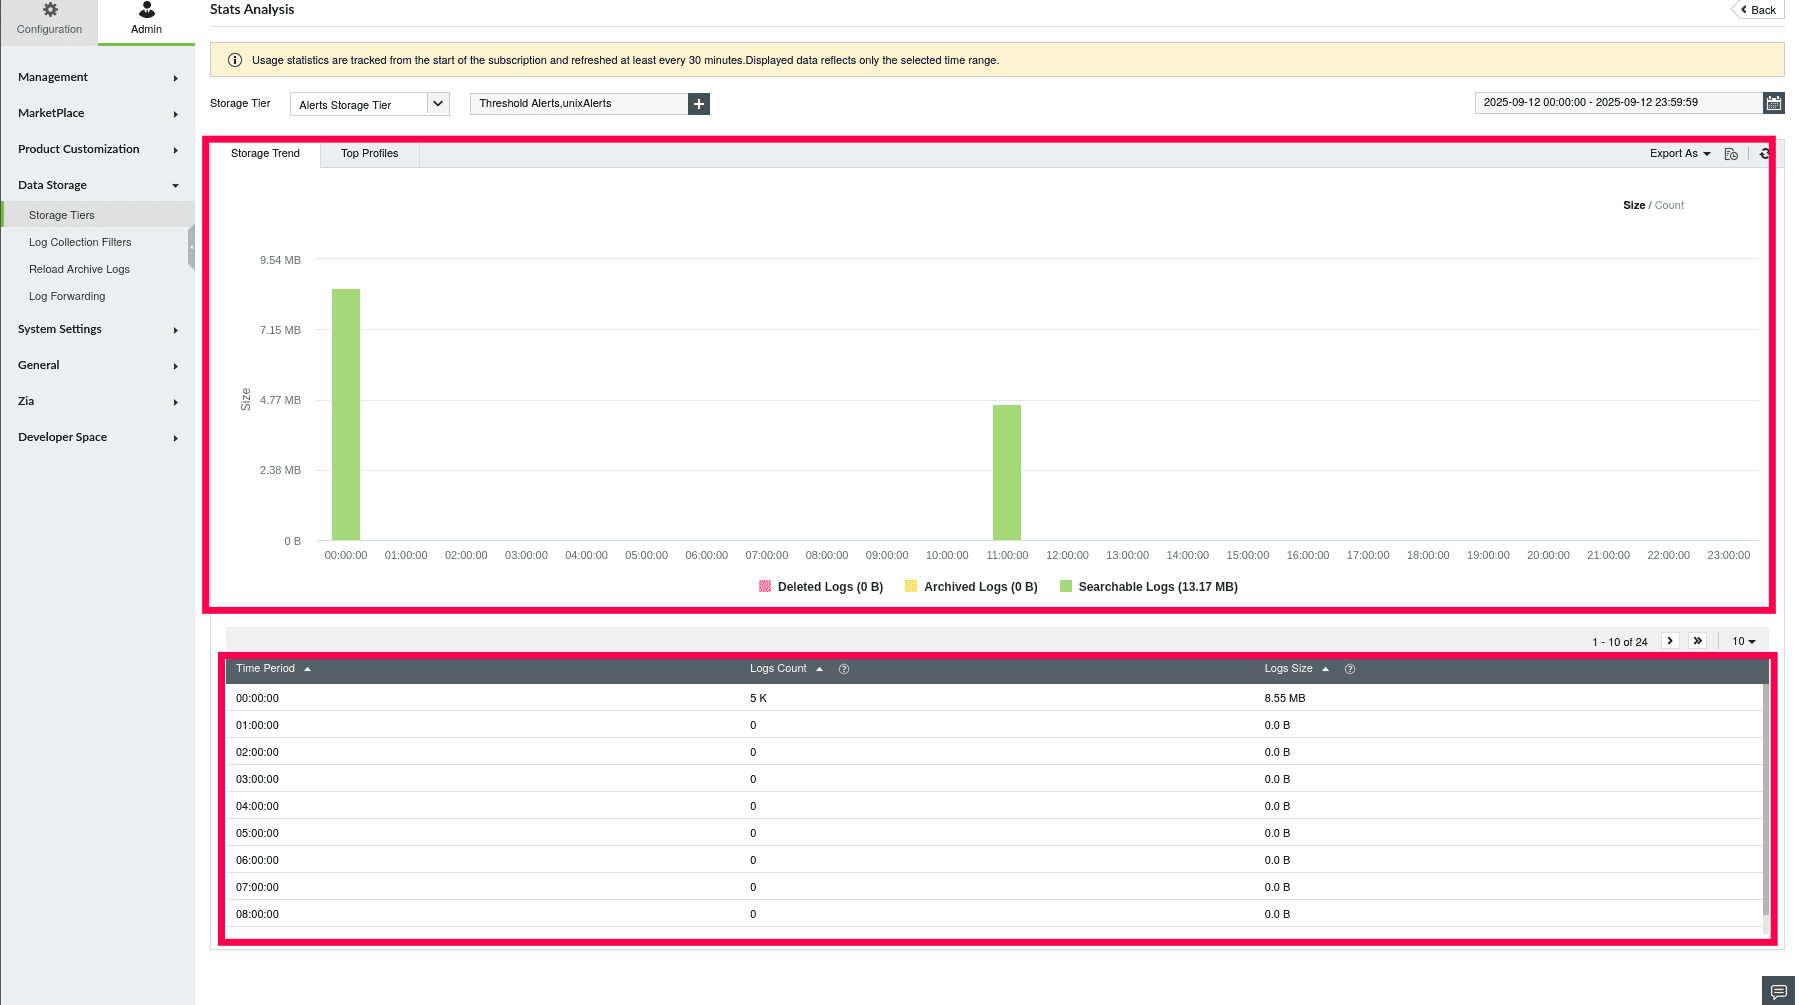
Figure 24: Statistical data for selected Alert Profiles
Read also
This page elaborated on how to use Stats Analysis to analyze storage trends across custom and built-in Storage Tiers in ManageEngine Log360 Cloud. To learn how to configure and manage Storage Tiers, refer to the following articles: