MikroTik overview
MikroTik routers run RouterOS, offering advanced routing, firewall, and VPN features. They are widely used for their flexibility, affordability, and strong network management capabilities.
MikroTik extension scope
The MikroTik extension for Log360Cloud enables integration of MikroTik logs into the Log360 Cloud ecosystem. This extension provides features such as log collection, parsing, reporting, alerting, correlation, and advanced log search capabilities.
Configuring MikroTik syslog forwarding by Web Interface
- Login into the MikroTik web interface.
- Go to System -> Logging -> Actions -> remote
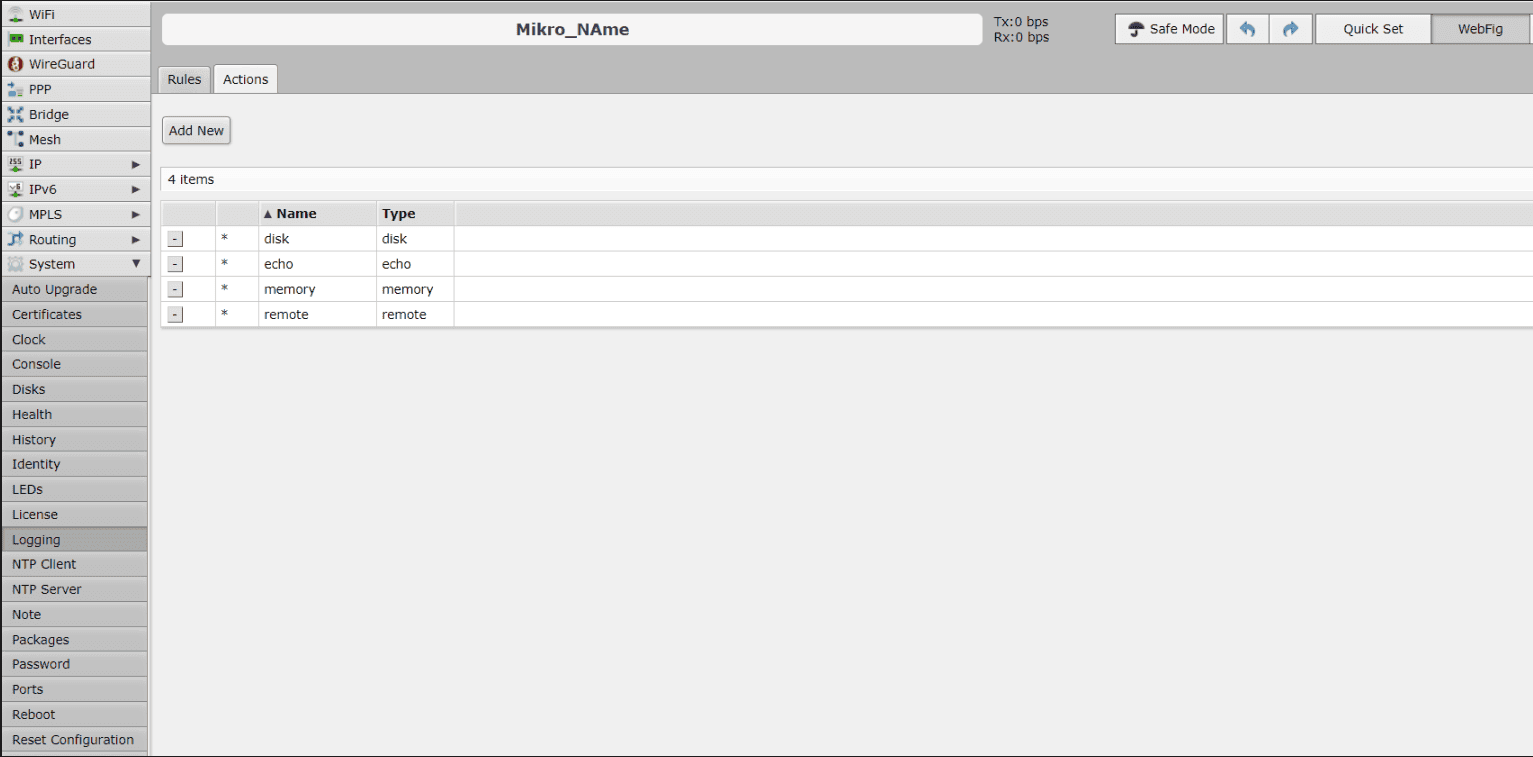
- This will open the configuration console.

- In the Remote Address field, add the Log360 Cloud agent's IP address.
- Set the Remote Port to 514.
Note: Check if the BSD Syslog is enabled. This is mandatory for the syslogs to be forwarded with timestamp values.
- Click OK to save the configuration.
- Go to System -> Logging -> Rules.

- Select the Syslog message topics you want to send to Log360 Cloud by marking them and setting the associated action to remote. If you are forwarding all logs to Log360 Cloud agents, the configuration should appear as follows:

Configuring MikroTik syslog forwarding by command-line interface(CLI)
- Use Telnet or SSH to access the MikroTik router from your command-line interface.
- Run the following command to access the logging action configuration
/system logging action
- Run the following command to view existing actions:
print
- Look for an entry named "remote". This is the action that forwards logs to a remote syslog server.
- Replace Log360CloudAgentIP with the IP address of your Log360 Cloud agent
set [find name=remote] remote=<Log360CloudAgentIP> remote-port=513
- Run the following to verify:
print
- Ensure the remote IP address is correctly updated and the remote-port is set to 513 (default syslog port).
- Navigate to the logging rules section
/system logging
- Print the current logging rules
print
- Identify the rule numbers based on the topics listed. Use those numbers to assign the remote action. Example (sending all logs to remote):
set action=remote 0,1,2,3
- Run the following to verify that the action fields are now set to remote:
print
Configuring in Log360 Cloud
In Log360 Cloud, the format of the logs collected from MikroTik devices will not be automatically identified as they follow the Basic Syslog Structure (RFC 3164).
User must manually assign "Mikrotik" as the log type. To implement this:
- Login to your Log360 Cloud console.
- Navigate to Settings → Configuration → Log Source Configuration → Device Management → Devices → Syslog Devices.
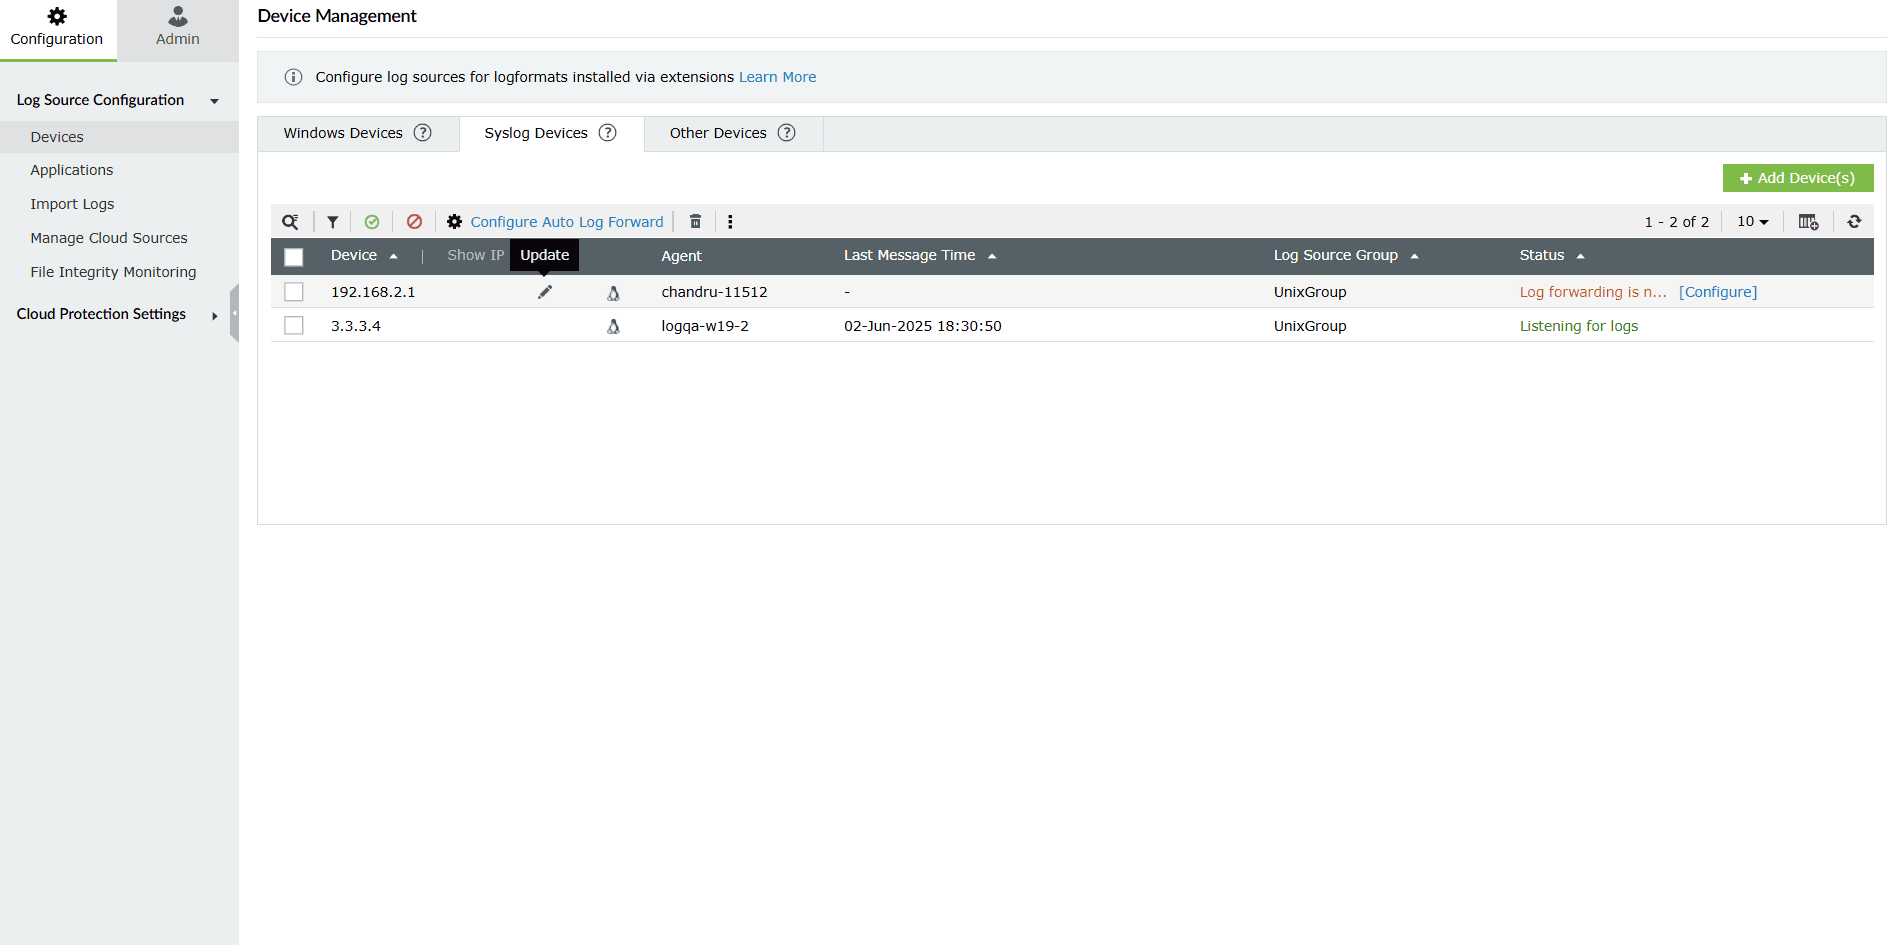
- In the Syslog Devices page, select the devices and click the update
 icon This will open the Update Device window.
- Click the Log Source Type dropdown and select MikroTik.

Audited MikroTik Events
| Category |
Events |
| Logon events |
Logins, Logoff, Failed logons |
| Allowed traffic |
Allowed traffic |
| Denied traffic |
Denied connections |
| Interface status |
Interface up, Interface down |
| Firewall rule management |
Rules added, Rules deleted, Rules modified |
| User account management |
Users added, Users modified, Users deleted, Group added, Group deleted, Group modified |
| DHCP events |
DHCP lease assignment, DHCP lease acquisition |
| DNS events |
DNS configuration changes, Resolved DNS queries |
| Routing events |
Static route management, Policy based route management, Route table management |
| System events |
Configuration changes, Clock update, System reboot |
| Severity events |
Warning events, Debug events, Notice events, Error events, Critical events, Emergency events, Alert events |
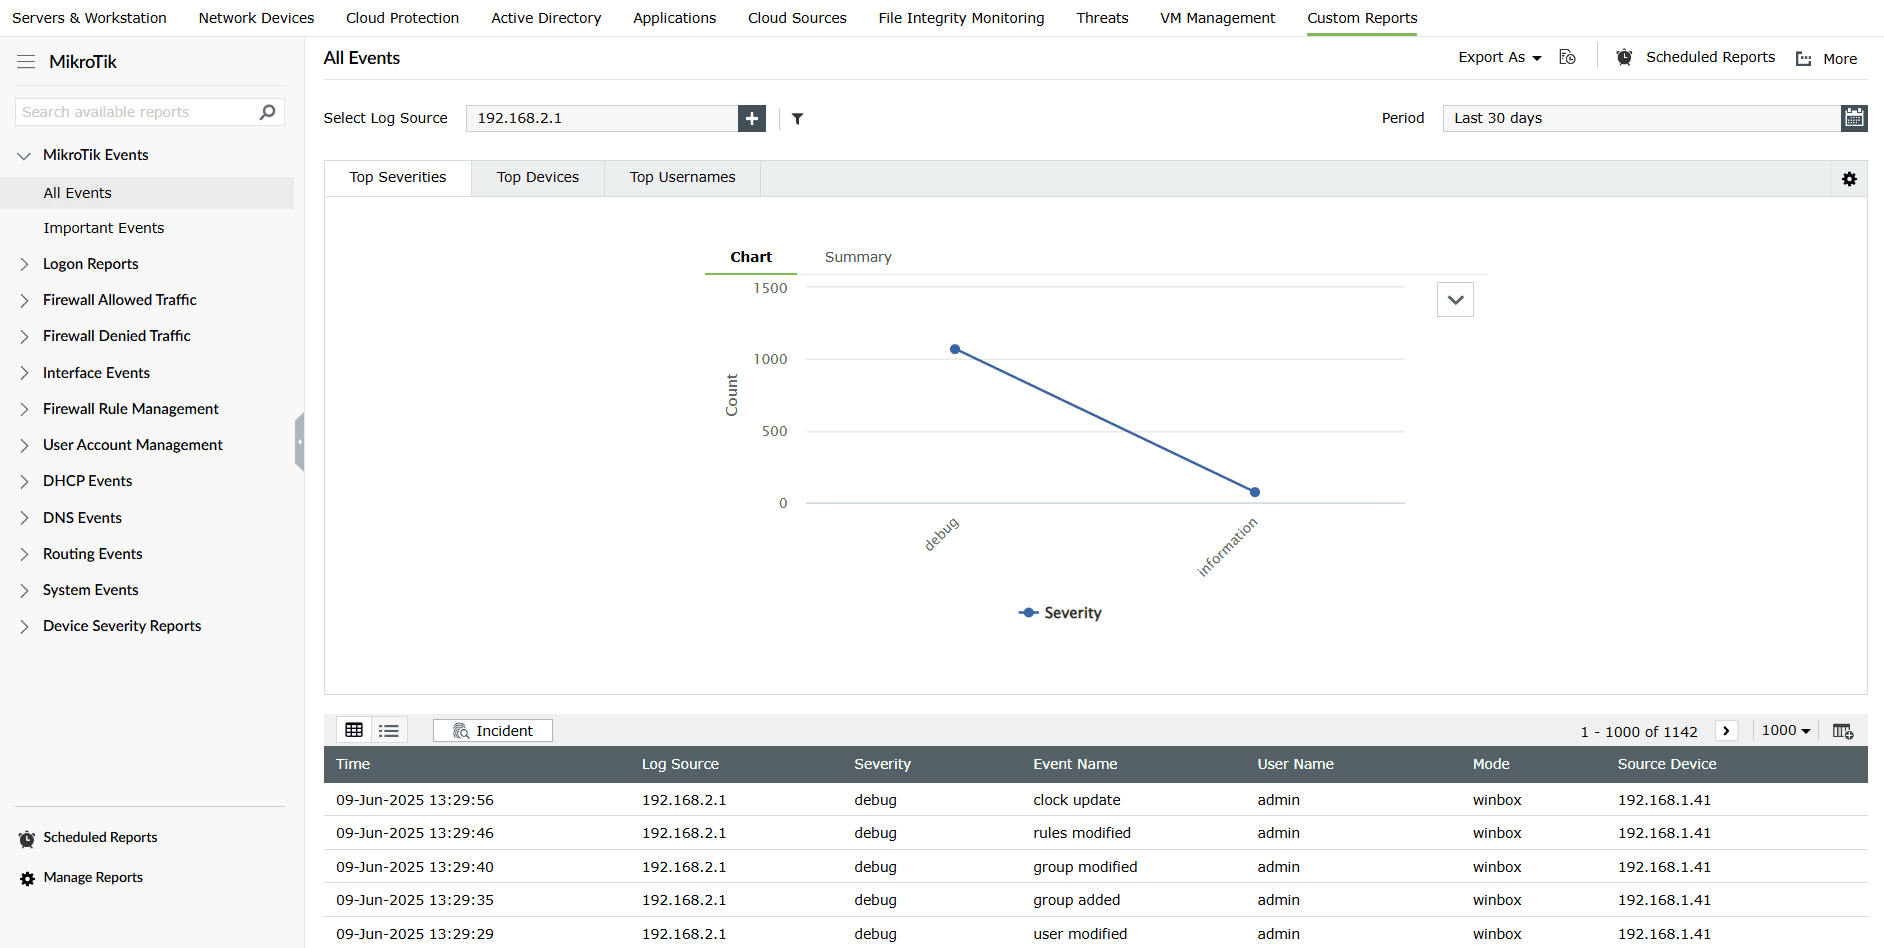
Viewing MikroTik reports
To view MikroTik reports, navigate to the Reports tab and select MikroTik from the Custom Reports sub-tab.
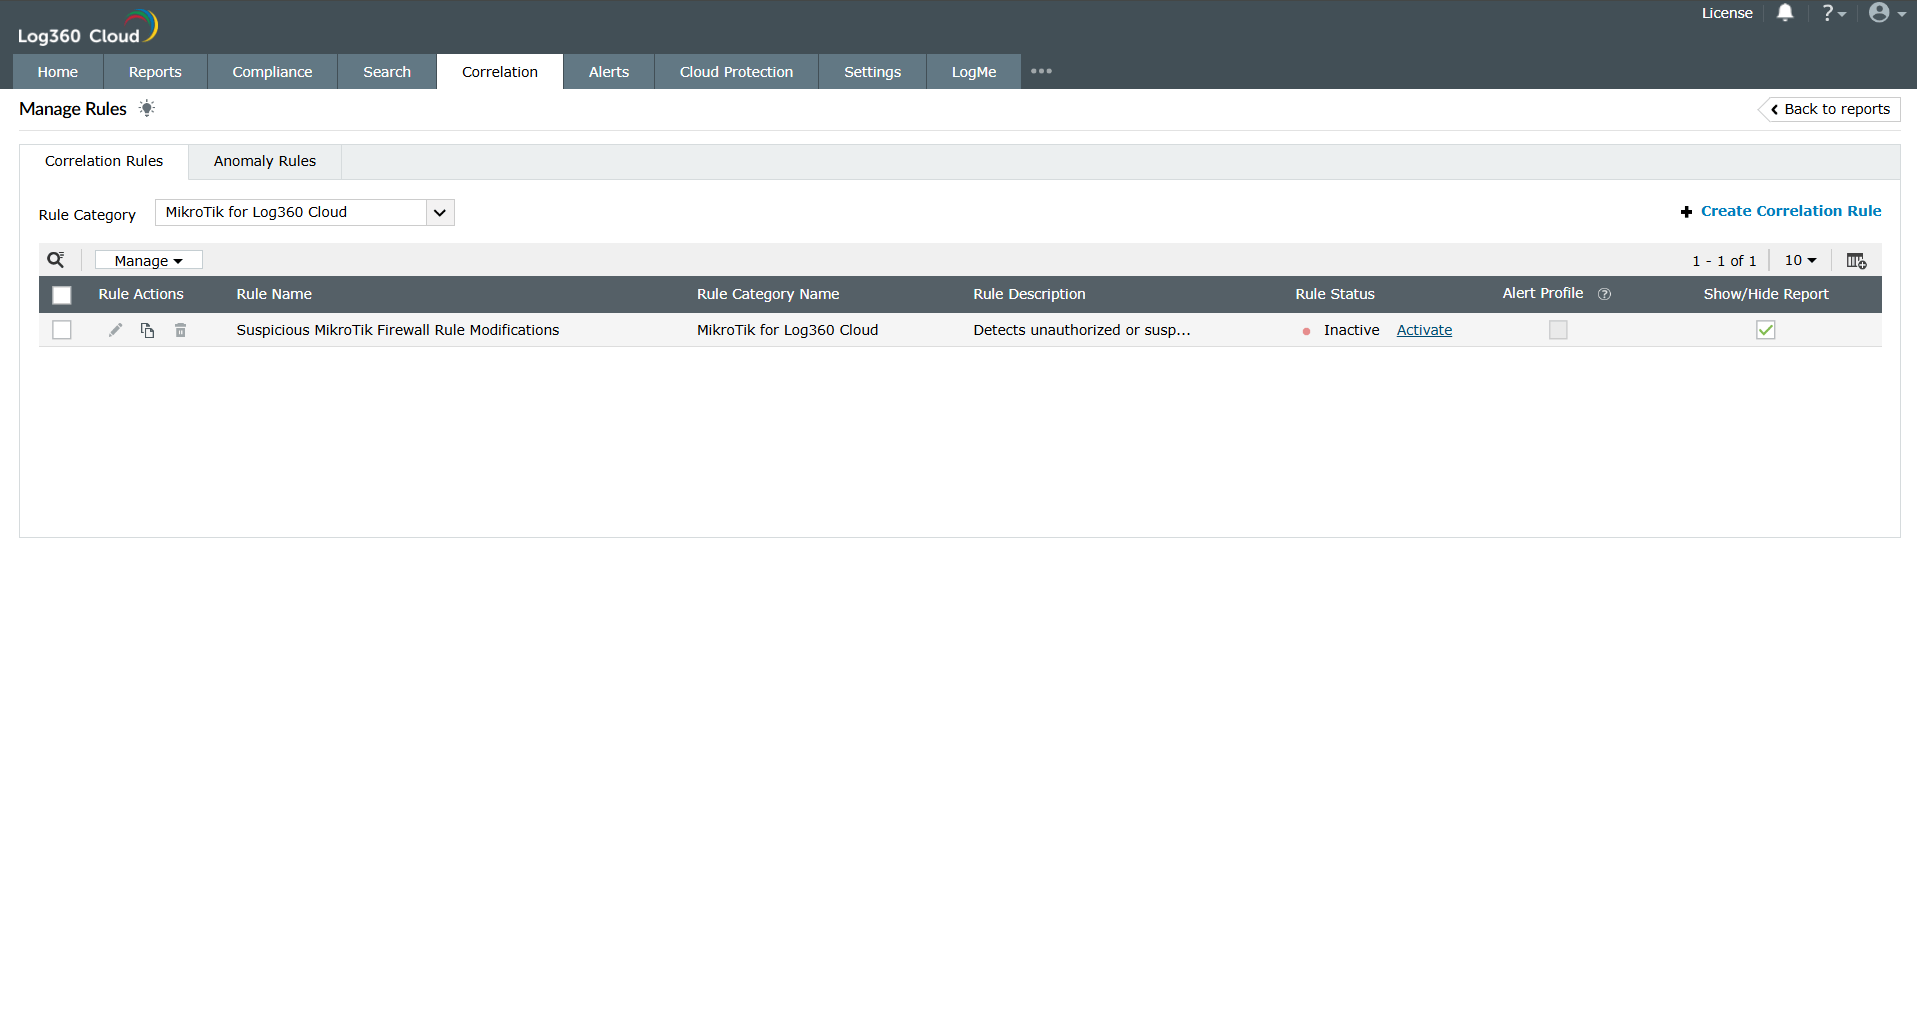
Enable MikroTik correlation rules
To view the correlation rules, navigate to the Correlation tab -> Manage Rules.
In the Manage Rules page, select MikroTik as the Rule Category to filter out the related correlation rules. You can enable them manually by selecting the rule and clicking on Activate in the Rule Status column.
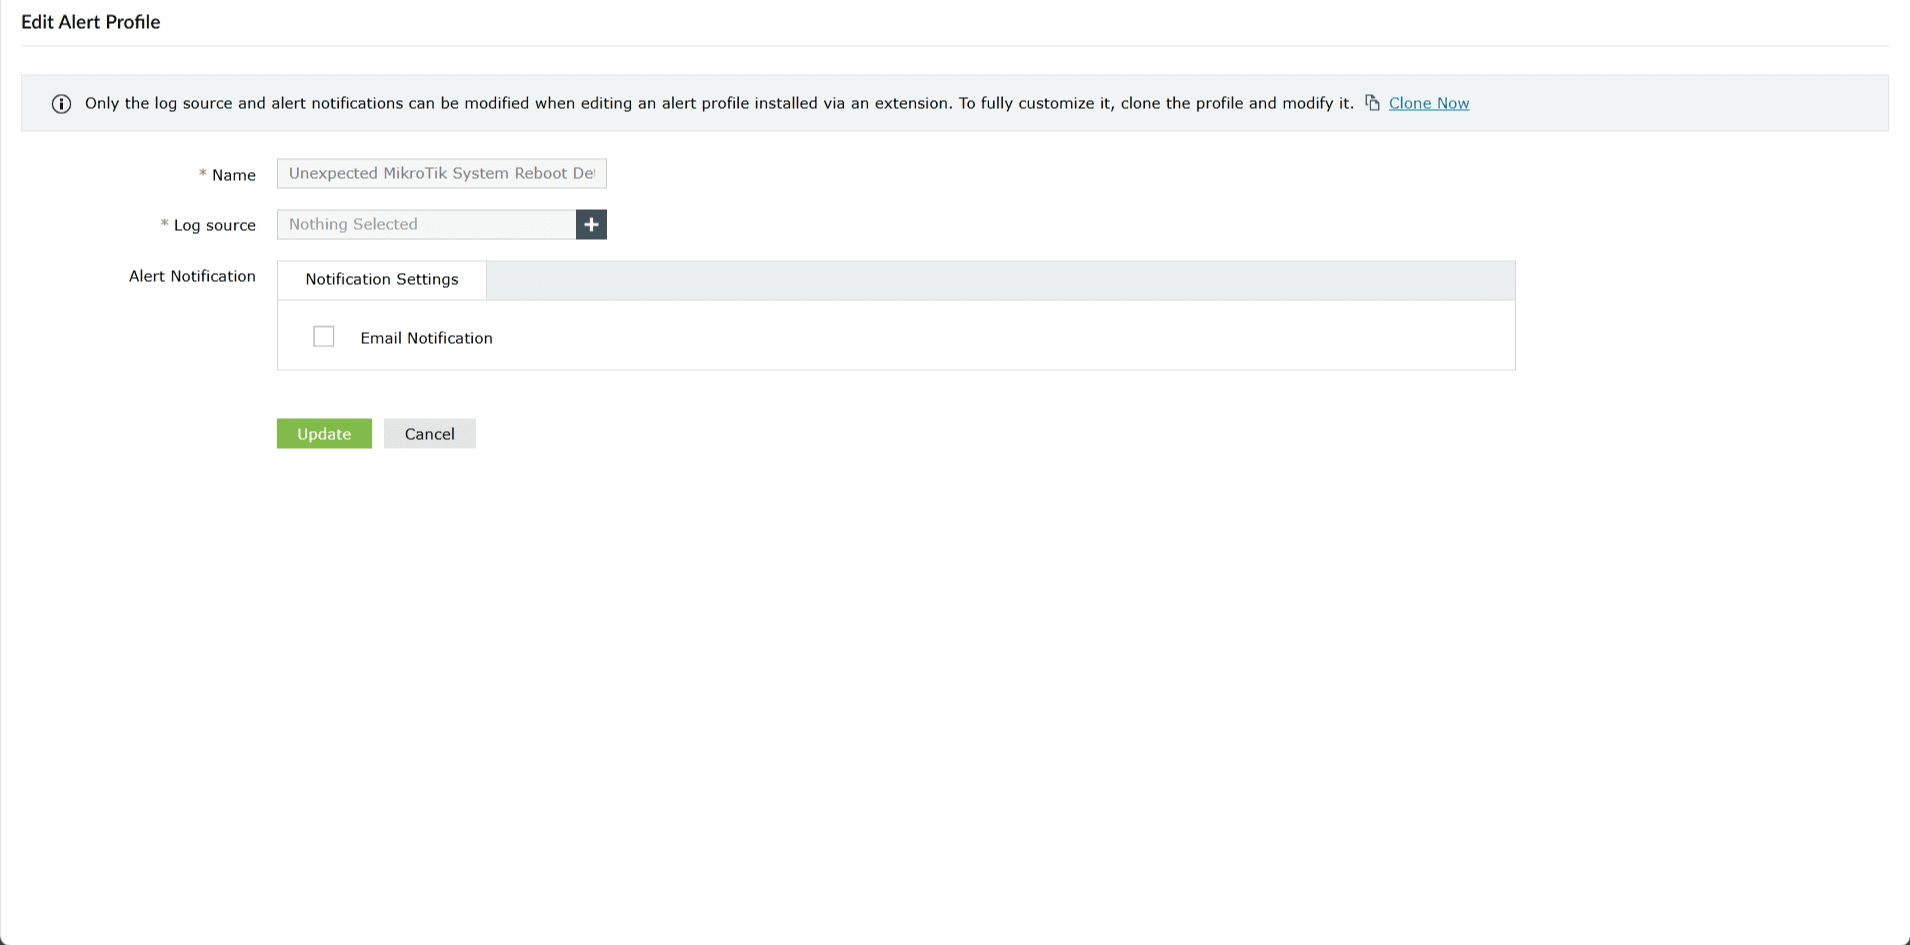
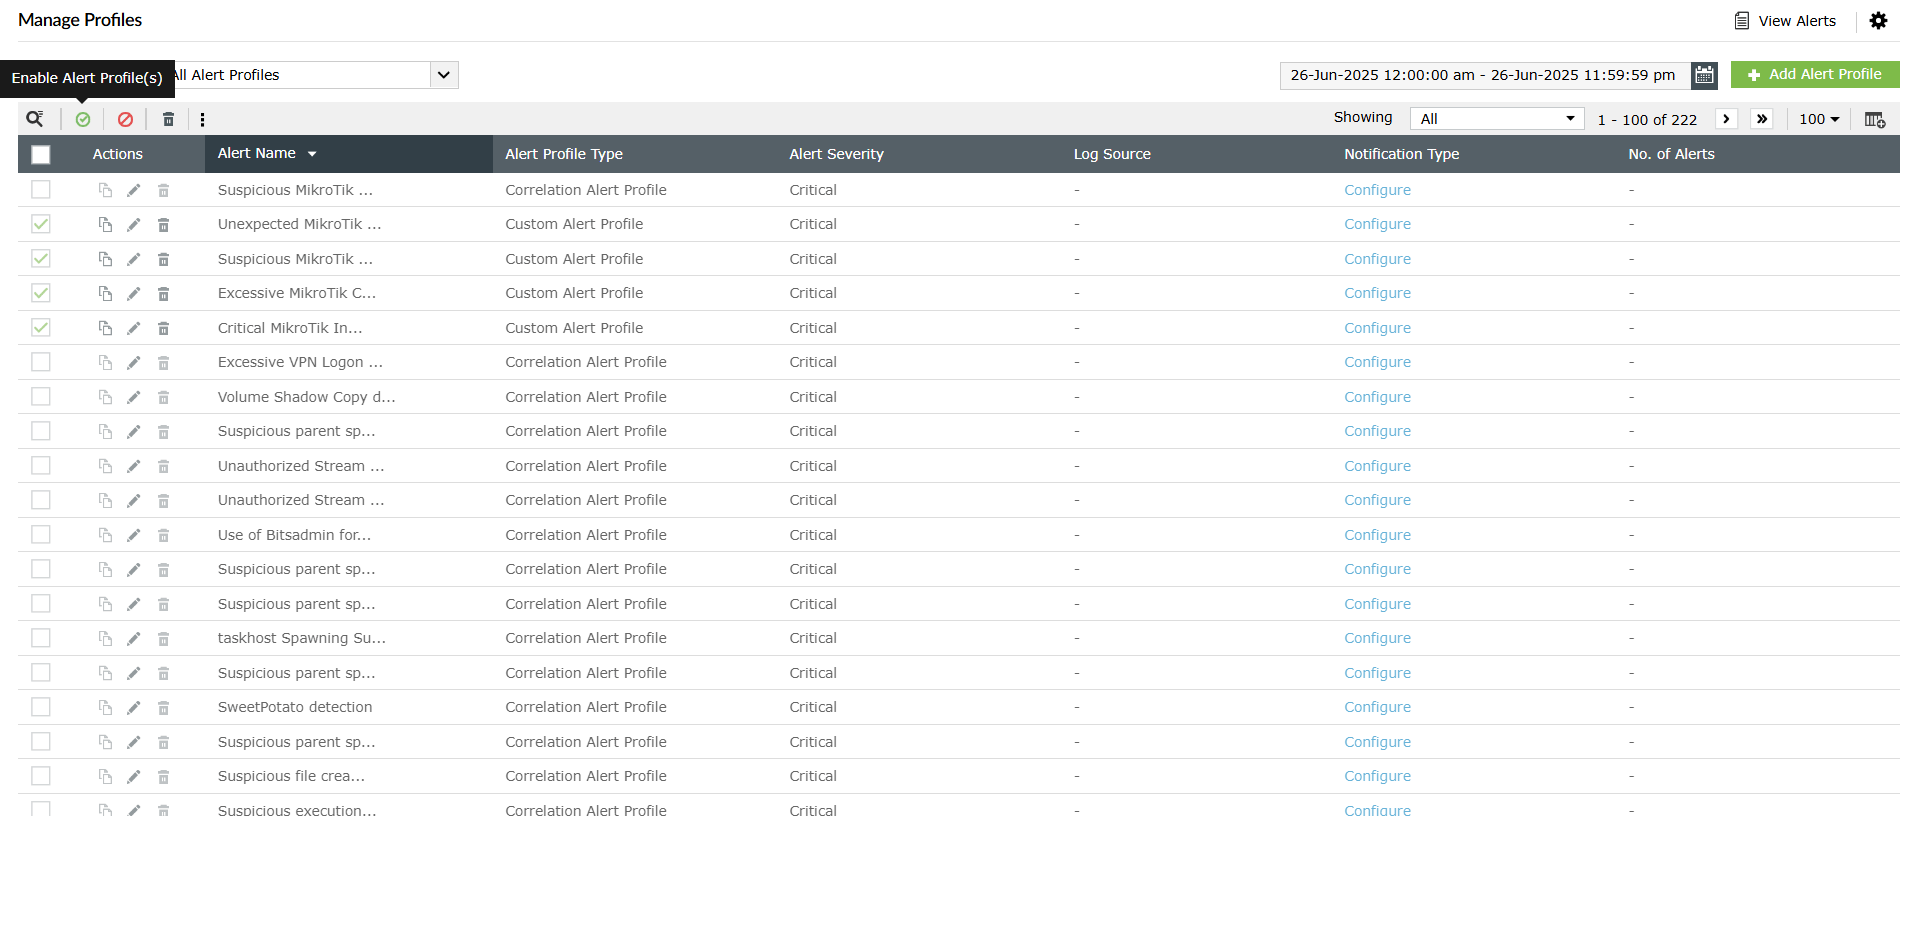
Enabling MikroTik Alerts
To view the Alerts, navigate to the Alerts tab -> Manage Alert Profiles.
- In the Manage Alert Profiles page, select Custom Alert Profiles as the Alert Profile Type. Click the search icon and add MikroTik to filter out the alert profile(s). Select the profile(s) and click the green check mark icon
 to enable the alert profile.
- To associate the log source, click the edit icon to open the Edit Alert Profile window. In the Log Source field, click the add button and select the configured log source for MikroTik. Click Update to save the changes.