How to monitor latency between devices?
What is latency?
Network latency, in general, is the delay in communication between any two network devices. It is indicative of the time taken by data to traverse across the network from the sender to the receiver. Networks with higher delay will have a higher latency and thus subsequent lag, while networks with quick response times will have lower latency.
On an enterprise level, businesses intend to keep network latency as low as possible; for quicker network communications and increased productivity. Some applications and high-performance computing instances mandate low latency connections to keep up with the computational demands. An internal network with low latency also tends to improve business operations. This is why it is imperative to maintain an eye on the latency across your devices.
How does OpManager help you monitor latency?
Since the term latency is descriptive of a very large scope, it has to be broken down into the context on network monitoring. There are many approaches to measuring and monitoring network latency. There are many contexts to latency monitoring. Here we will discuss about:
- The latency between OpManager server and the end-devices
- The latency between two end-devices
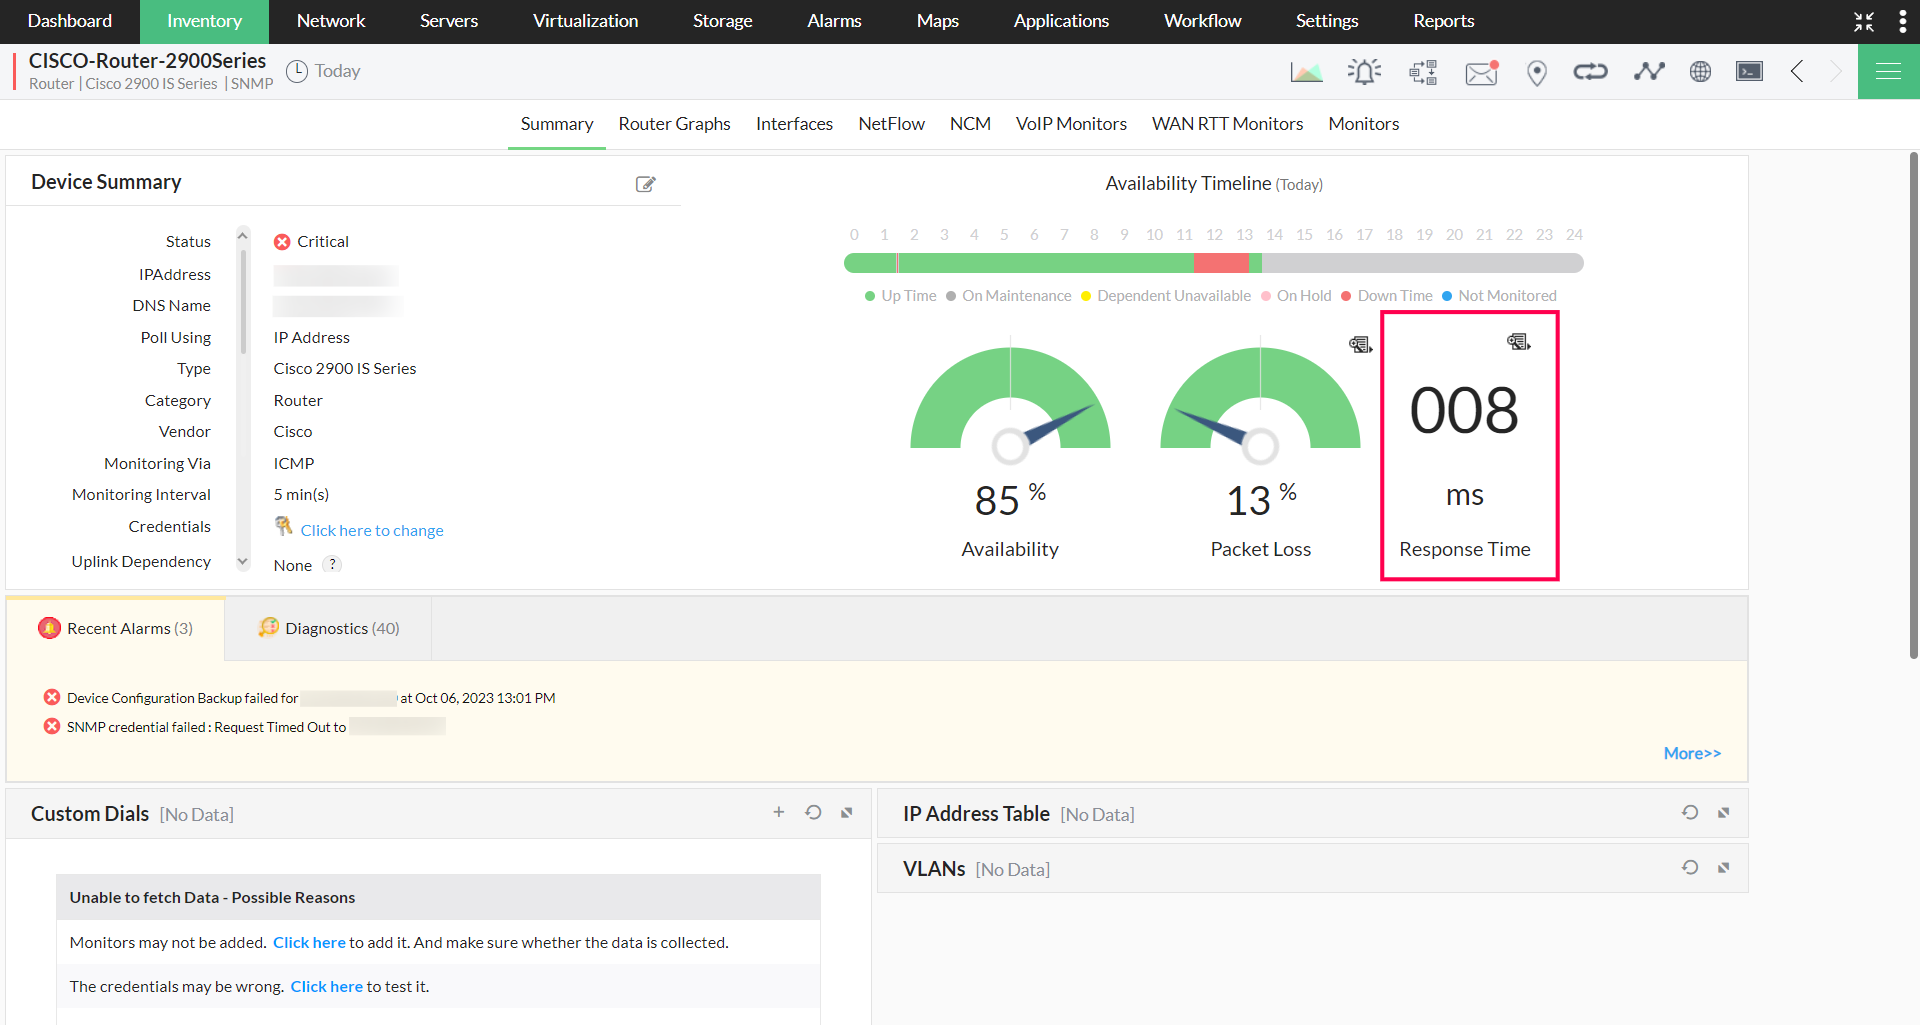
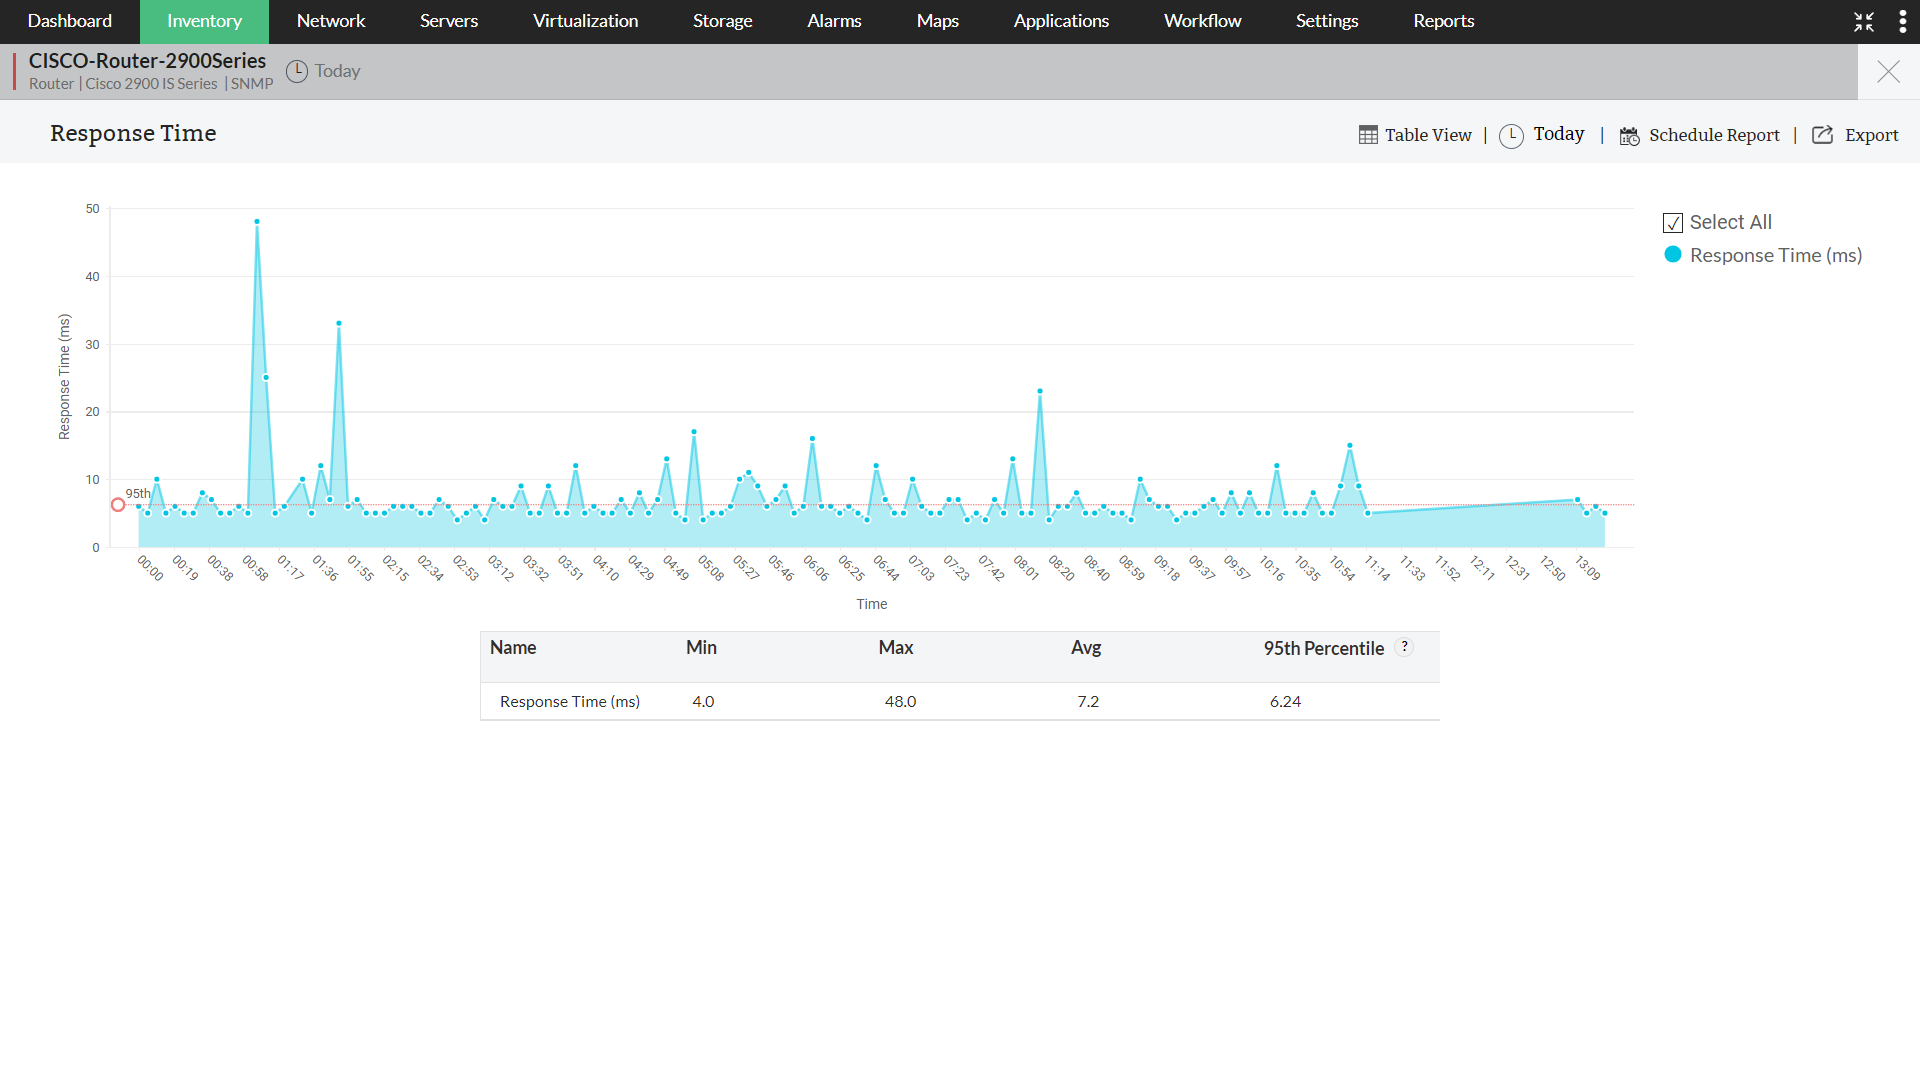
Latency between the device and the OpManager server: To monitor the latency between the device and the OpManager server, OpManager measures the "response time" metric by default. This measurement is protocol specific (via ICMP, TCP, or SNMP), and gives you an idea of how reachable the device is.
Latency between end-devices: Latency is more relevant between network-critical devices that communicate among each other. Let us say, for instance, you have a few border routers on your network edge, and some digital subscriber line access multiplexers (DSLAMs) for high-speed digital communications. It is very important to monitor the latency between these routers and DSLAMs, so as to maintain operational integrity. OpManager can effectively monitor the latency between these devices using its latency monitoring tools.
The measurement of latency between two end-devices is done in two ways; using either:
- One-way Latency
- Two-way Latency
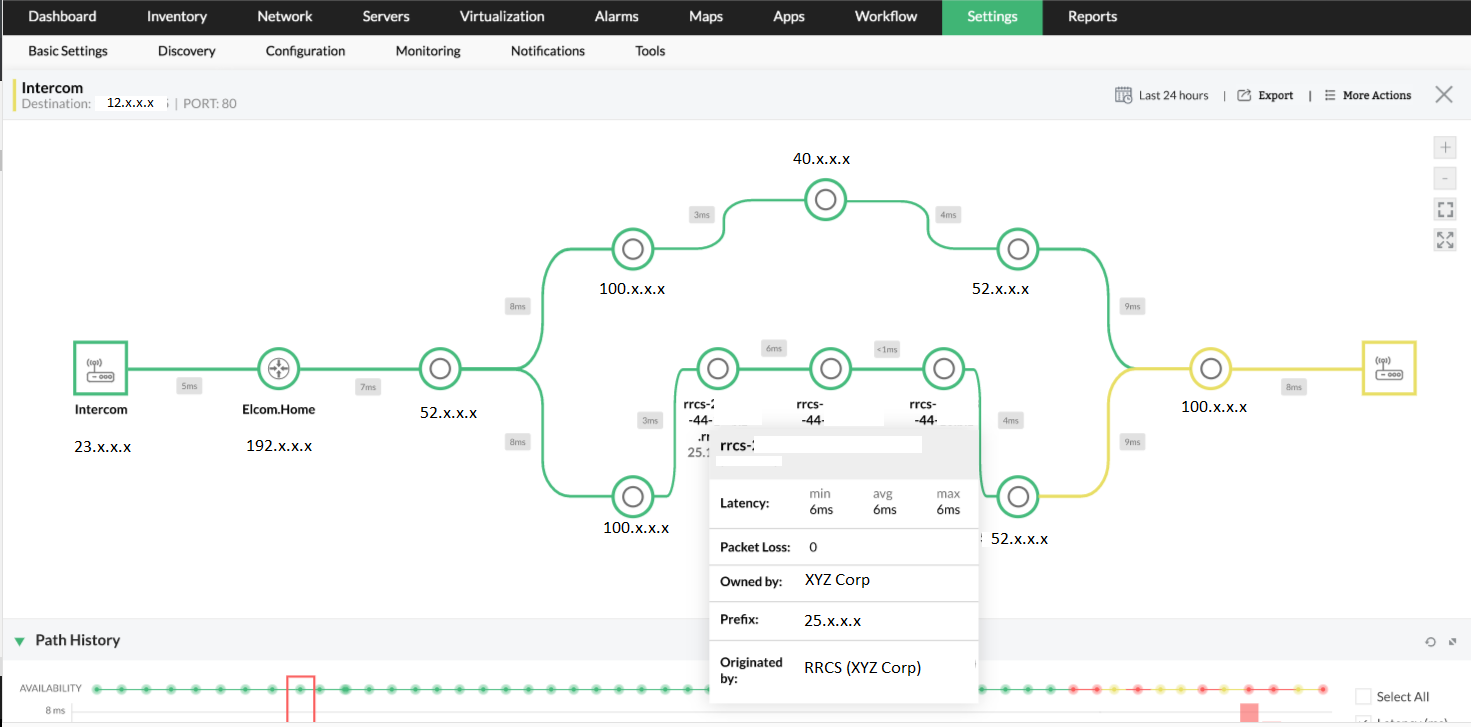
One-way latency is the measure of the time a packet of data takes to travel from the source to the destination. To check the latency between two end devices, you can use OpManager's Network Path Analysis Tool. If you can configure a path in a manner that it includes both the devices between which you want to measure the latency, the Network Path Analysis Tool keeps checking the latency and packet loss between the nodes at regular intervals.

Two-way latency (also called Round-Trip Latency) is when we measure the time taken by a data packet to travel from the source to the destination and back again. To do this, OpManager uses Cisco IP SLA Monitoring. IP SLA monitoring utilizes VoIP and WAN monitors to measure the latency between CISCO enabled devices and other end-devices.

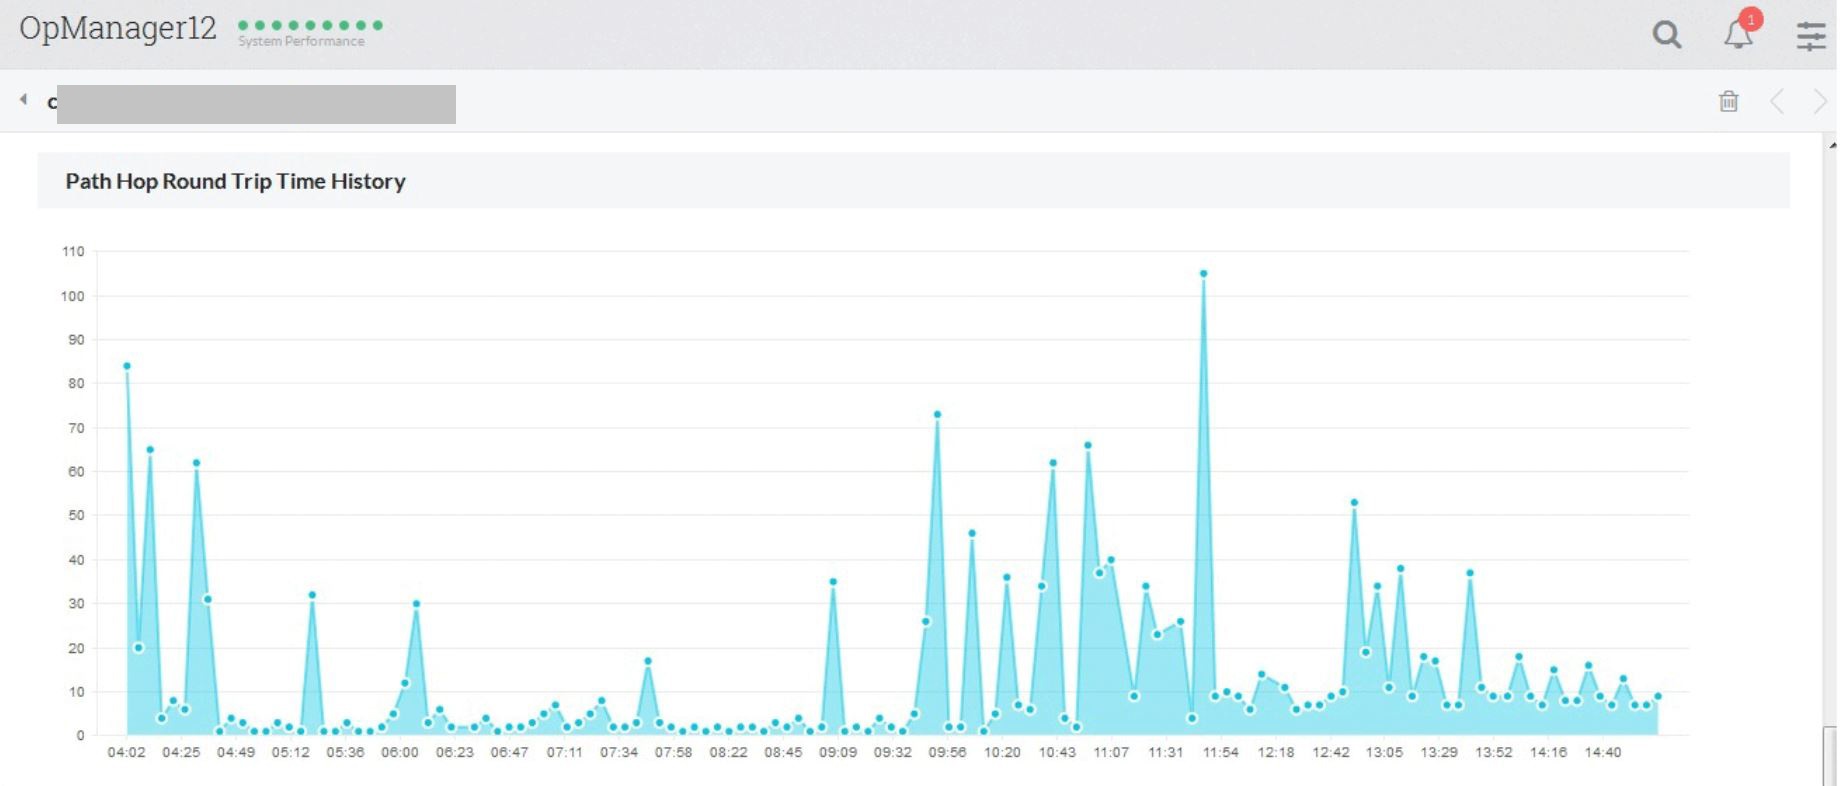
The VoIP and WAN RTT monitors in OpManager mitigate network latency issues by diagnosing the network paths with a high RTT and helps the you resolve poor network performance. It identifies outages between two network stations, and provides a hop-wise view of the latency graph in a single window. This network latency monitor helps you drill down and precisely locate the hop at which the outage occurred.
Additionally, we also use the Cisco IP SLA to monitor the latency and raise alerts based on the thresholds you configure in OpManager. To know more about Cisco IP SLA, check the link given below: https://www.cisco.com/c/en/us/td/docs/ios-xml/ios/ipsla/configuration/15-mt/sla-15-mt-book/sla_overview-0.html
The WAN RTT (Round Trip Time) monitor will help you,
- Monitor latency between end points across WAN.
- Raise alerts based on the Round Trip Time thresholds. The thresholds are customizable.
- Monitor Latency for each HOP between the end points.
- Custom reports to identify the problem quickly.
- Auto-Configuration of Cisco IP SLA monitors to the router, without having you to log on to the router.

