To ensure the continuity of network services, you need to have comprehensive visibility over network elements and network performance. As enterprises move towards solutions that are more sustainable in the long term, one of the most important choices they can make is whether or not to switch to a virtual infrastructure. Apart from the economic advantage and reduced maintenance, virtual servers also provide effortless scalability to suit your growing network needs.
However, when virtual server infrastructure is employed in a network, one of the major problems is the lack of visibility over your virtual devices' health and performance. Each vendor provides dedicated tools to monitor and manage their virtual machines (VMs), but this becomes a hassle when the network has virtual devices from two or more vendors. In these cases, you must switch between different tools constantly to gain critical stats about the virtual network's performance, which consumes quite a lot of time and resources.
Here's where OpManager can make a huge difference in managing your network's virtual infrastructure better. OpManager's server monitoring dashboard, such as the dedicated virtualization monitoring dashboard can be utilized to monitor all your virtual devices from different vendors all in one place, on a single pane of glass.
In OpManager, dashboards are used to consolidate network performance and health stats from various devices or device groups, which are then displayed on a single screen for a quick overview of the network's performance. OpManager has several predefined dashboards combined into major groups, such as network, server, virtualization, and storage, so they're easily accessible whenever you want to view the related information for that group. In addition, you can design custom dashboards by selecting the related information panels, or widgets, desired on your dashboard.
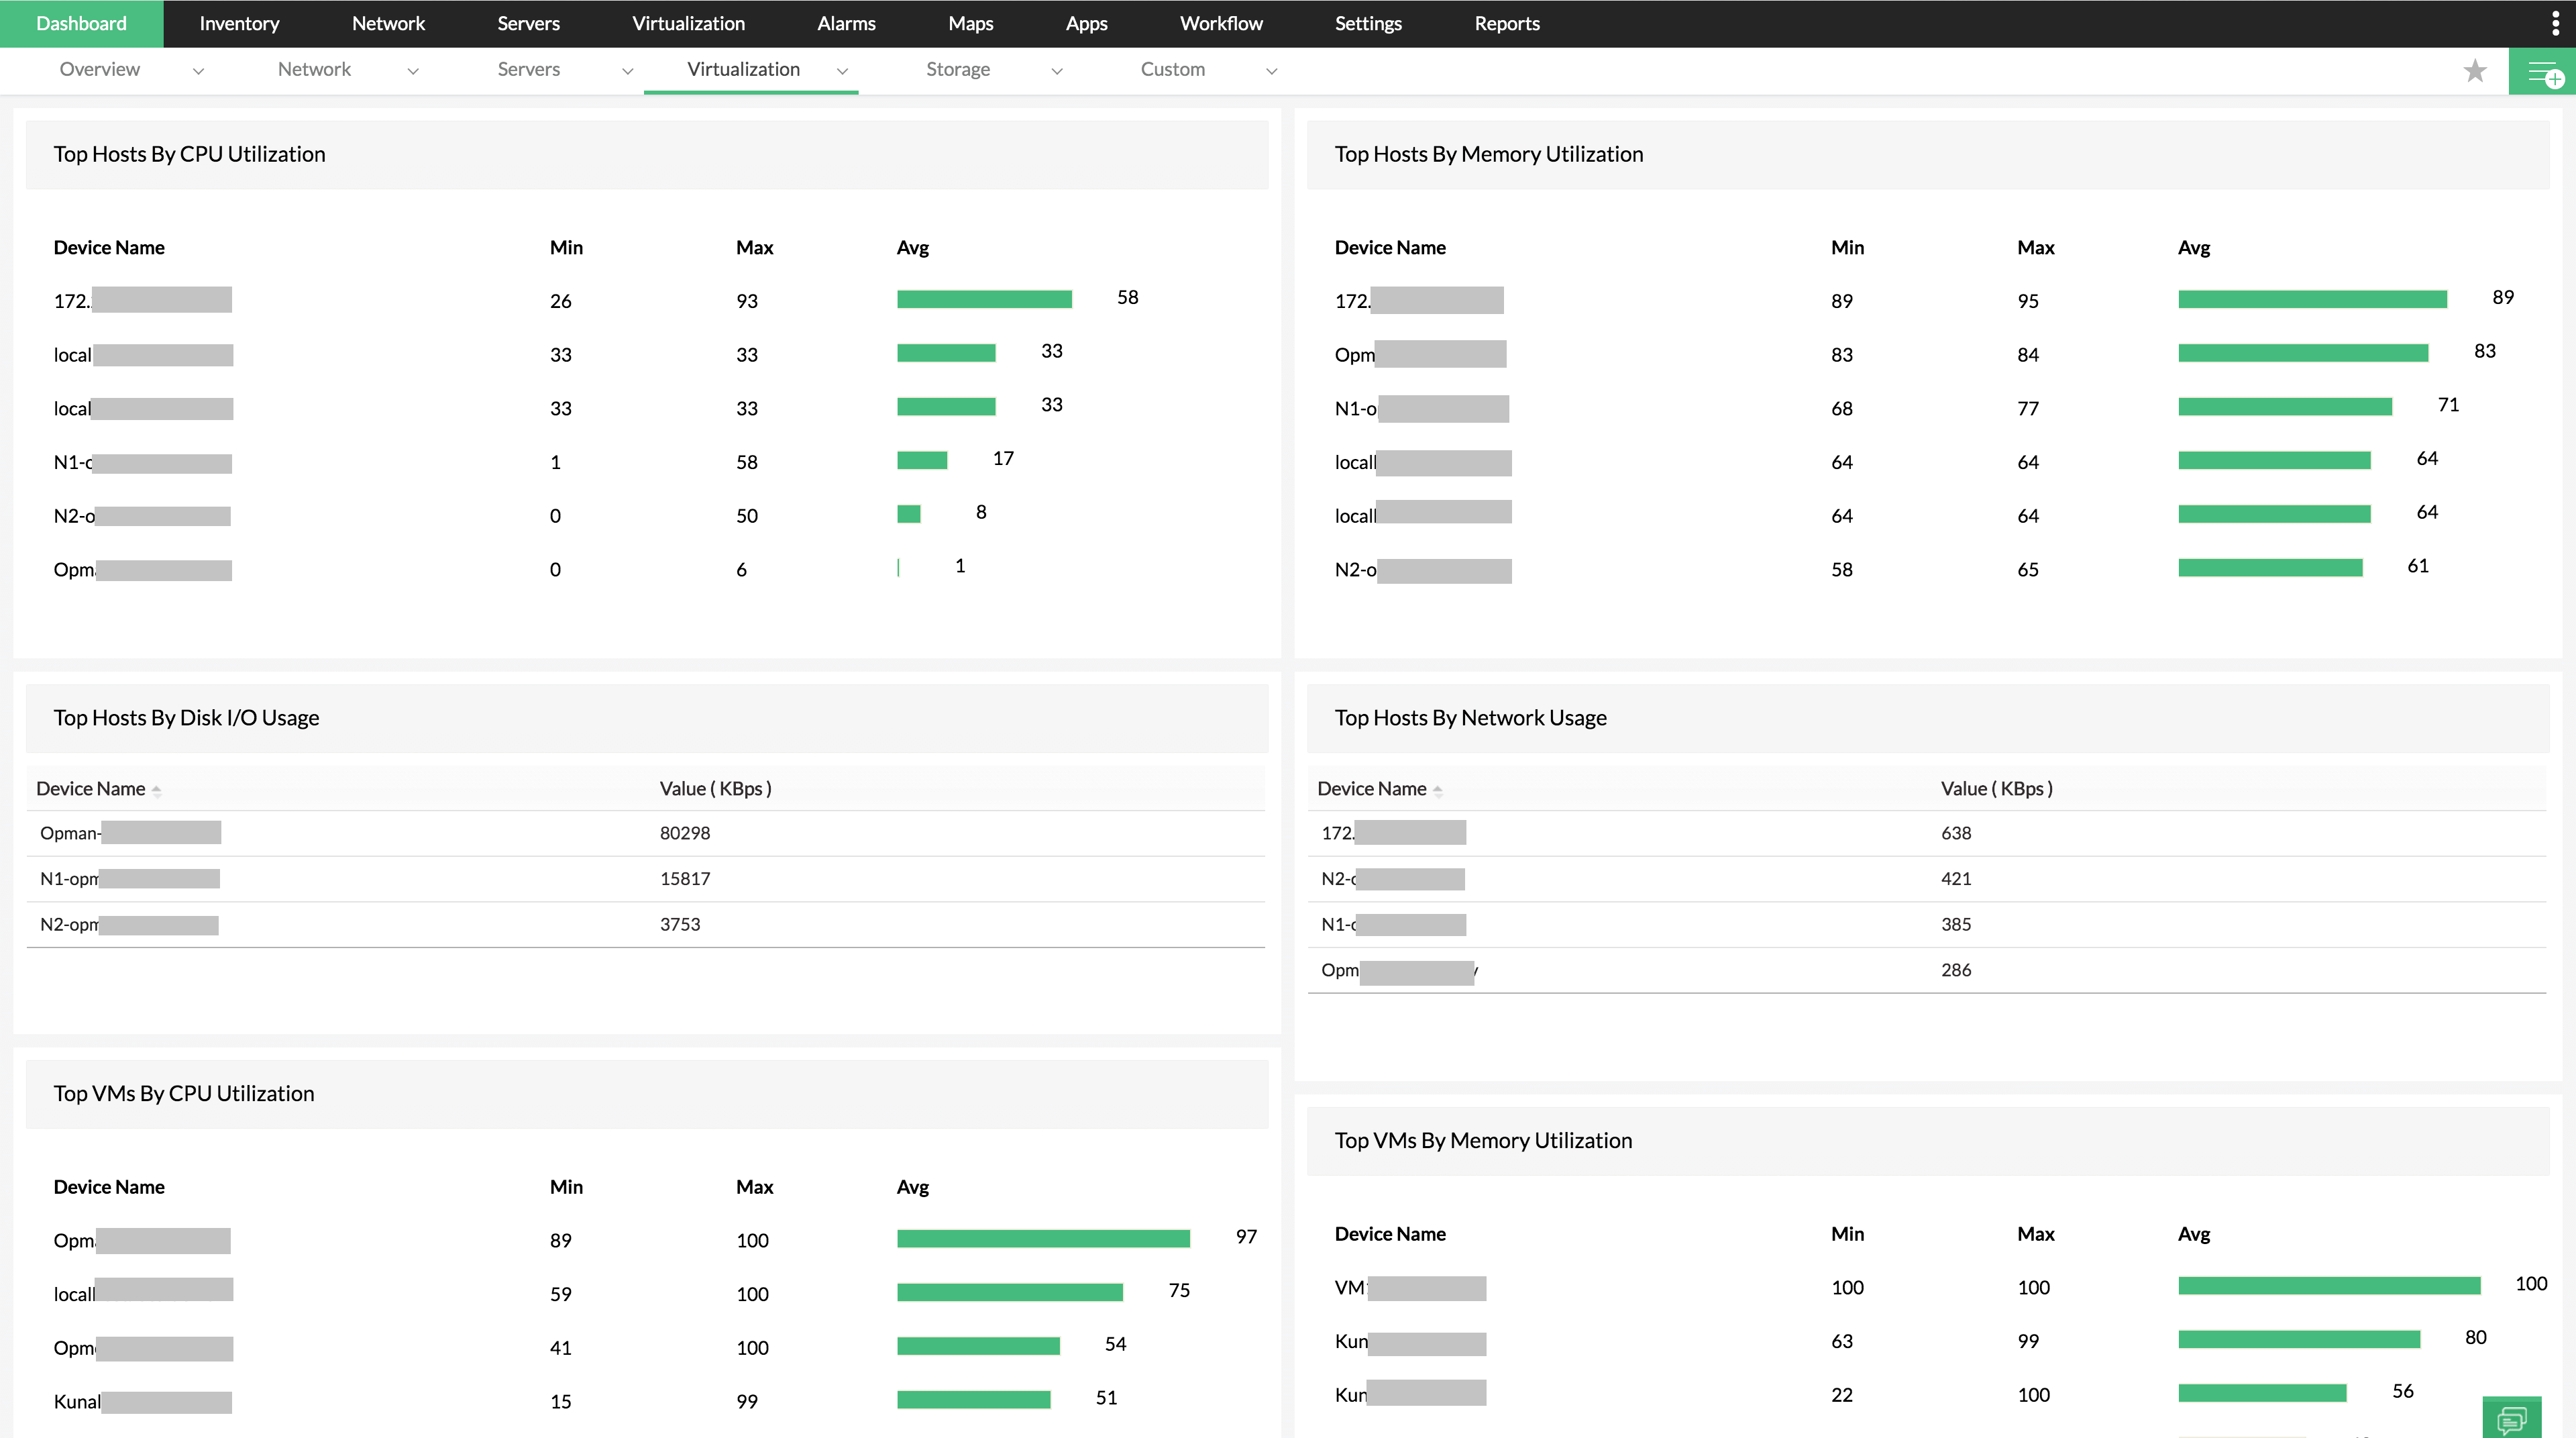
By opening the virtualization monitoring dashboard summary under the dashboard tab in OpManager, you'll be able to view readily available widgets with critical information about virtual devices such as Top Hosts By CPU/Memory Utilization and Top VMs By CPU/Memory Utilization. You can also view the top virtual devices by network and disk I/O usage to learn which VMs or hosts are over-consuming your network bandwidth. Apart from the virtualization dashboard, OpManager also offers a comprehensive network monitoring dashboard.
Under the Dashboard menu, you can also find dedicated virtualization monitoring dashboards for each major vendor like Microsoft (Hyper-V), VMware (vCenter/ESX/ESXi), and Citrix (Hypervisor). These dashboards help you collect vendor-wise virtual device metrics to view the overall status of that vendor's devices in your network.
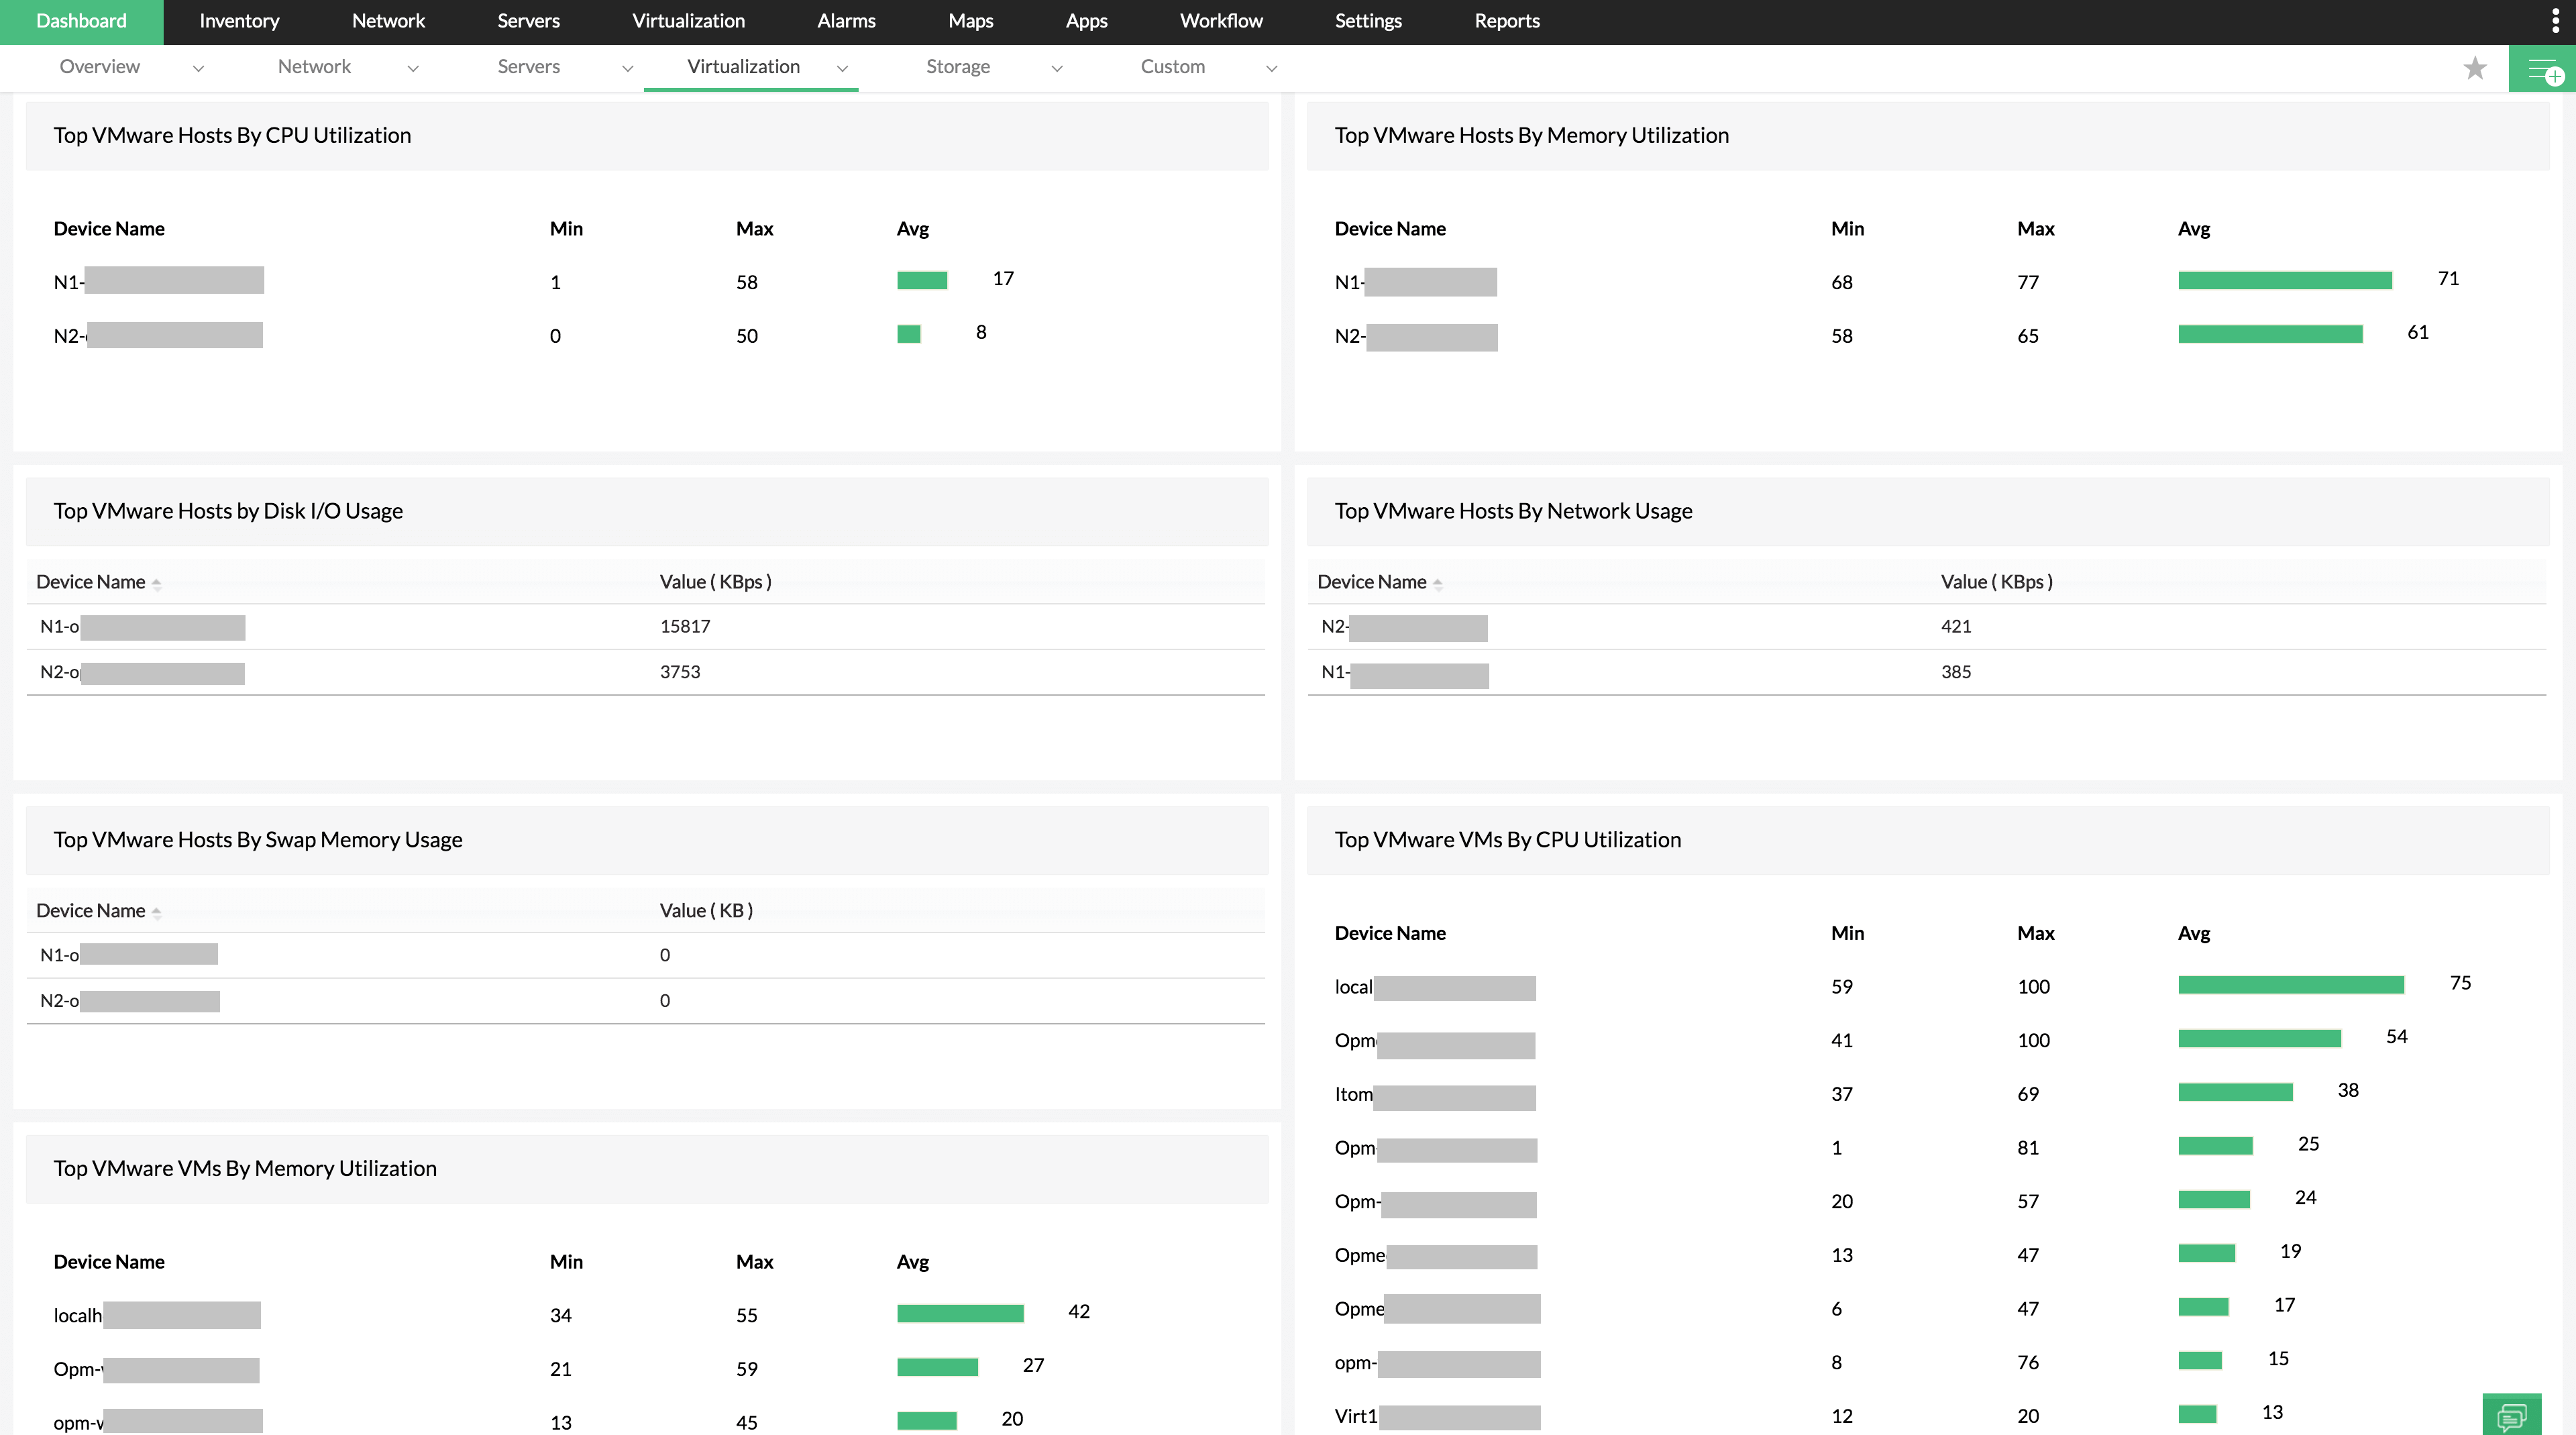
VMware dashboard: For VMware, you can view critical performance widgets such as Top VMs/Hosts By Memory/CPU/Disk, and also by network usage. Also, OpManager lists the top VMs by Swap Memory Usage so you can monitor which VMs use the highest amount of physical memory in your servers. Learn more about VMware monitoring.
Hyper-V dashboard: By default, the dashboard for Microsoft Hyper-V also displays the Top VMs/Hosts By Disk, Memory, or CPU Utilization. You can also edit the monitoring criteria for any of these widgets simply by clicking the Edit icon in the top-right corner of the widget, and modifying the listed criteria as per your requirement. Anything from the name of the widget or the type of VM you wish to monitor to advanced settings like the monitoring window and the period you want to view the stats for can be changed. Learn more about Hyper-V monitoring.

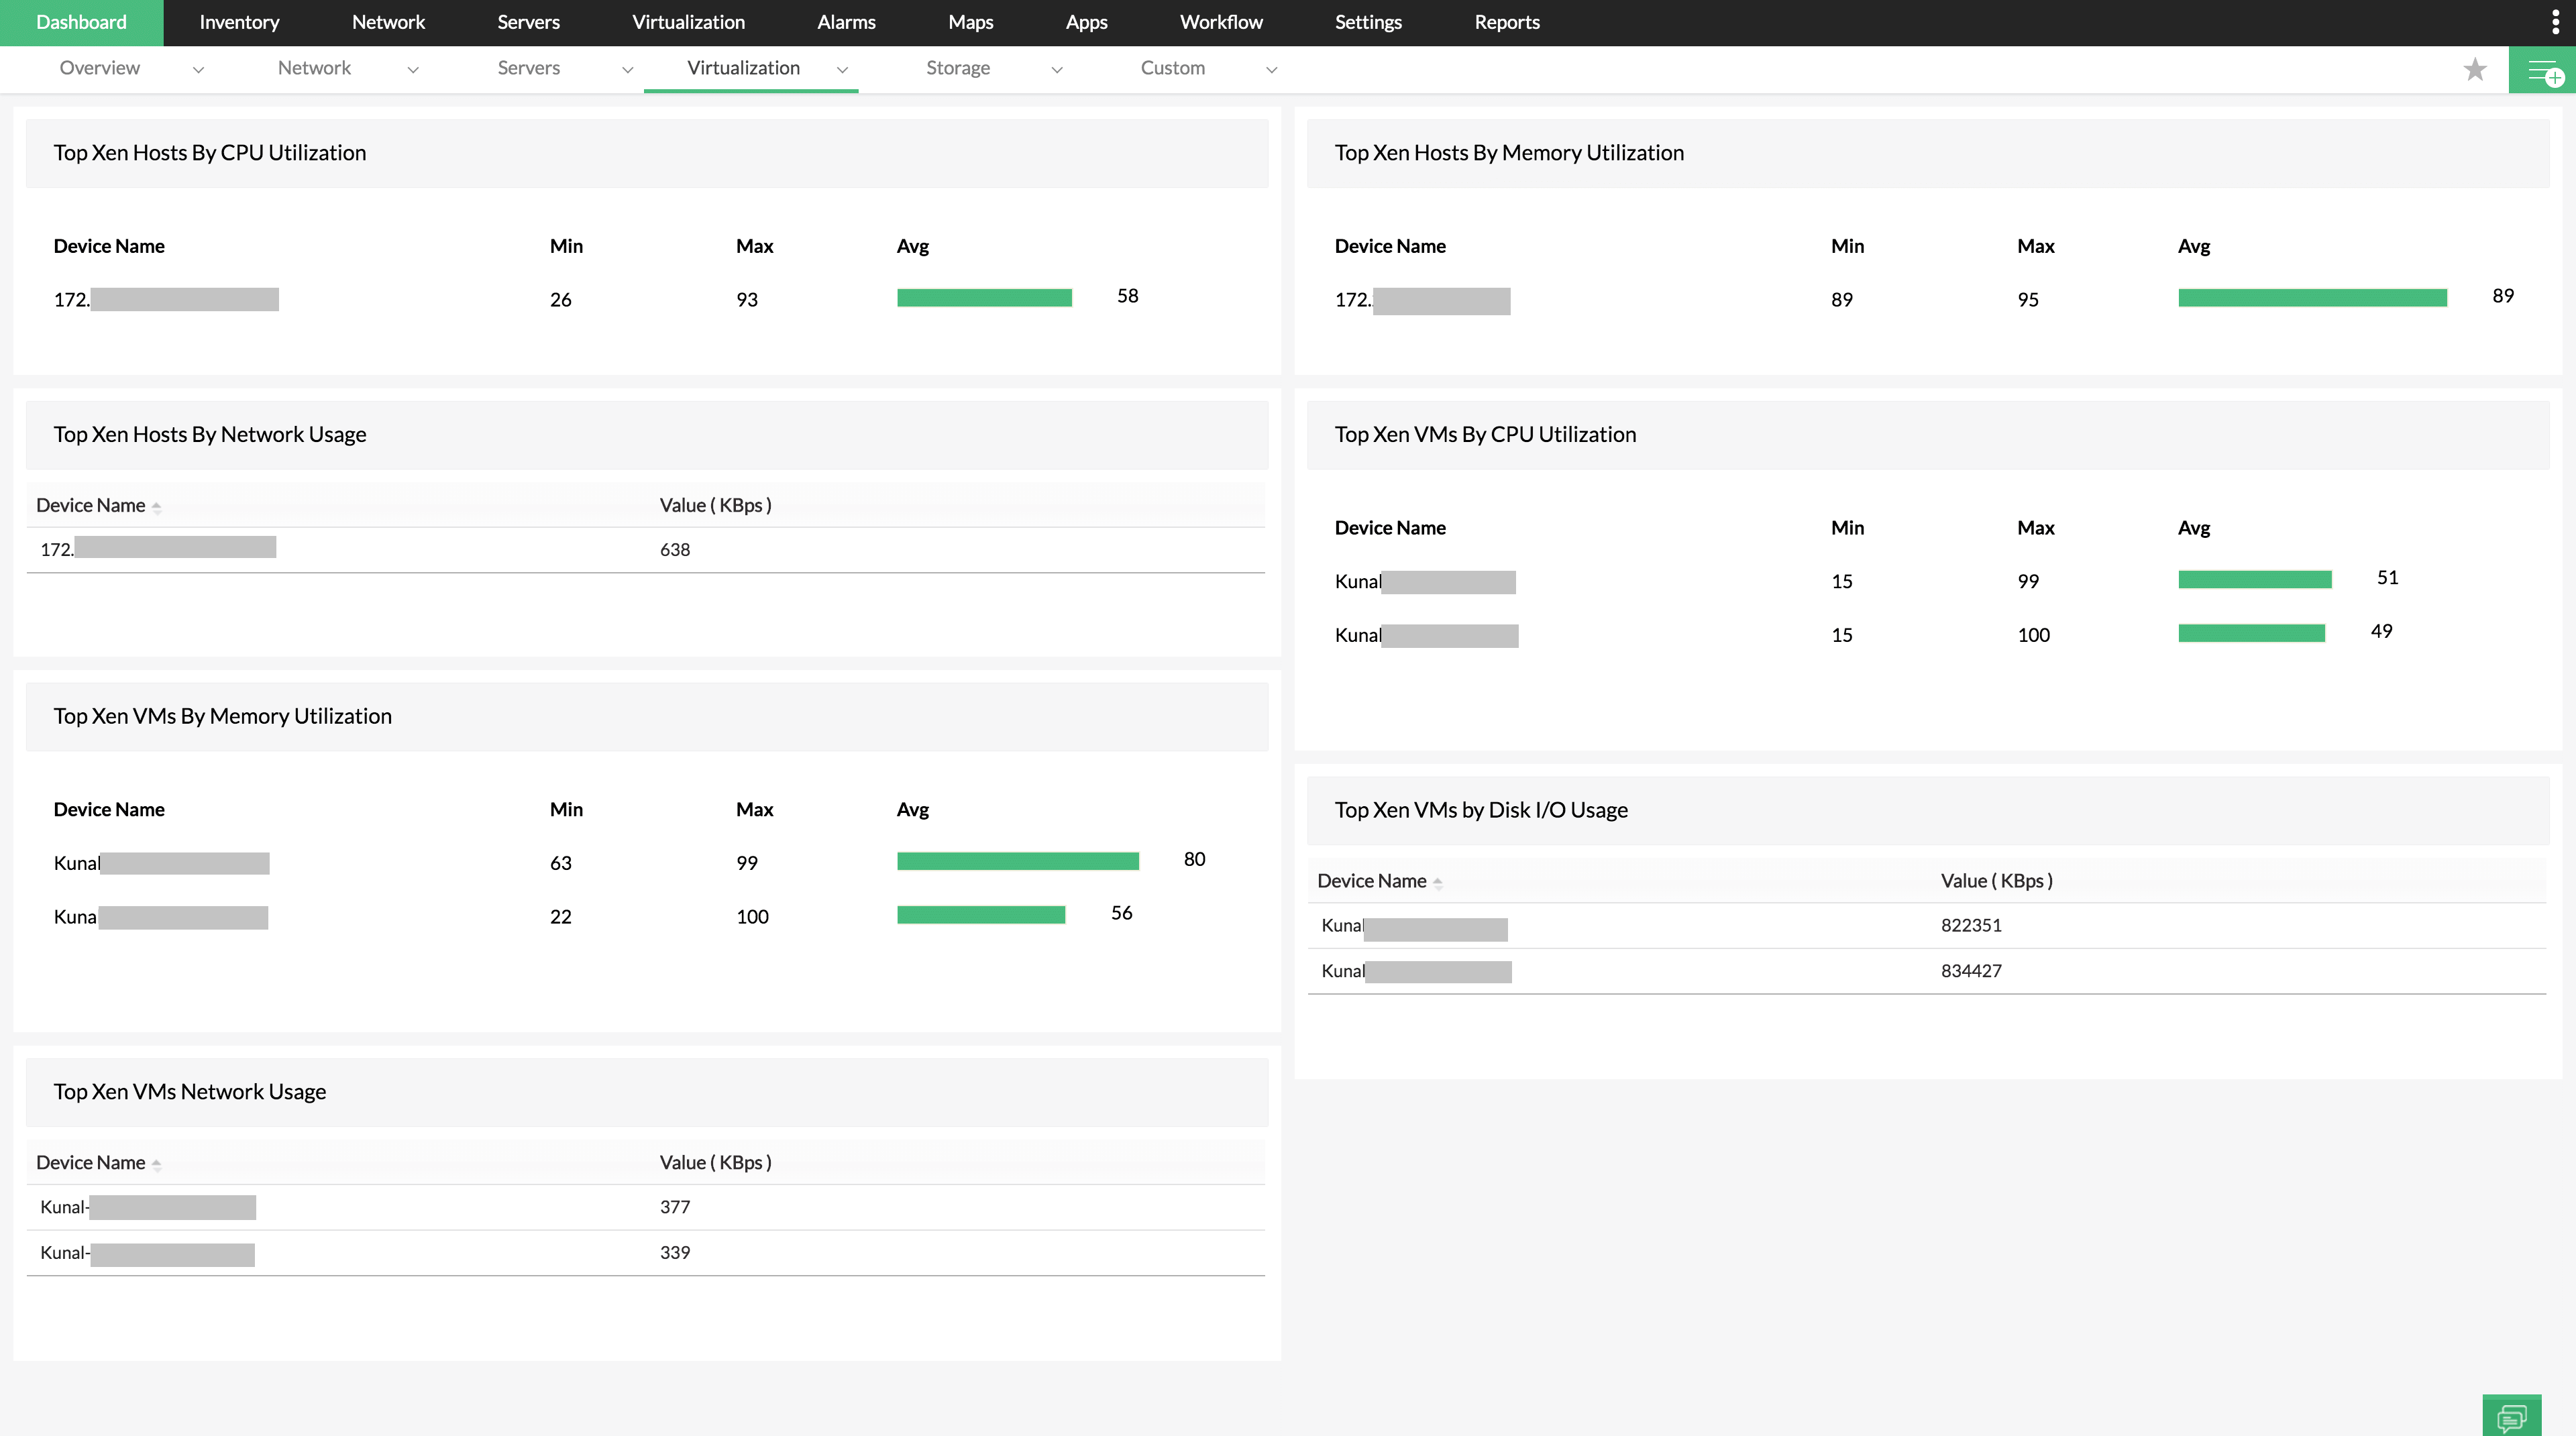
Xen Dashboard: The Xen dashboard also has the critical performance stats mentioned above, displaying the top usage based on the VM/Host's Disk, Memory, or CPU utilization. All these widgets help you quickly identify the status of your virtual resources and if any of them need attention. Also, you can access the Device Snapshot page of any VM or host simply by clicking the device name from any of these widgets to perform device-related functions. Learn more about Xen monitoring.
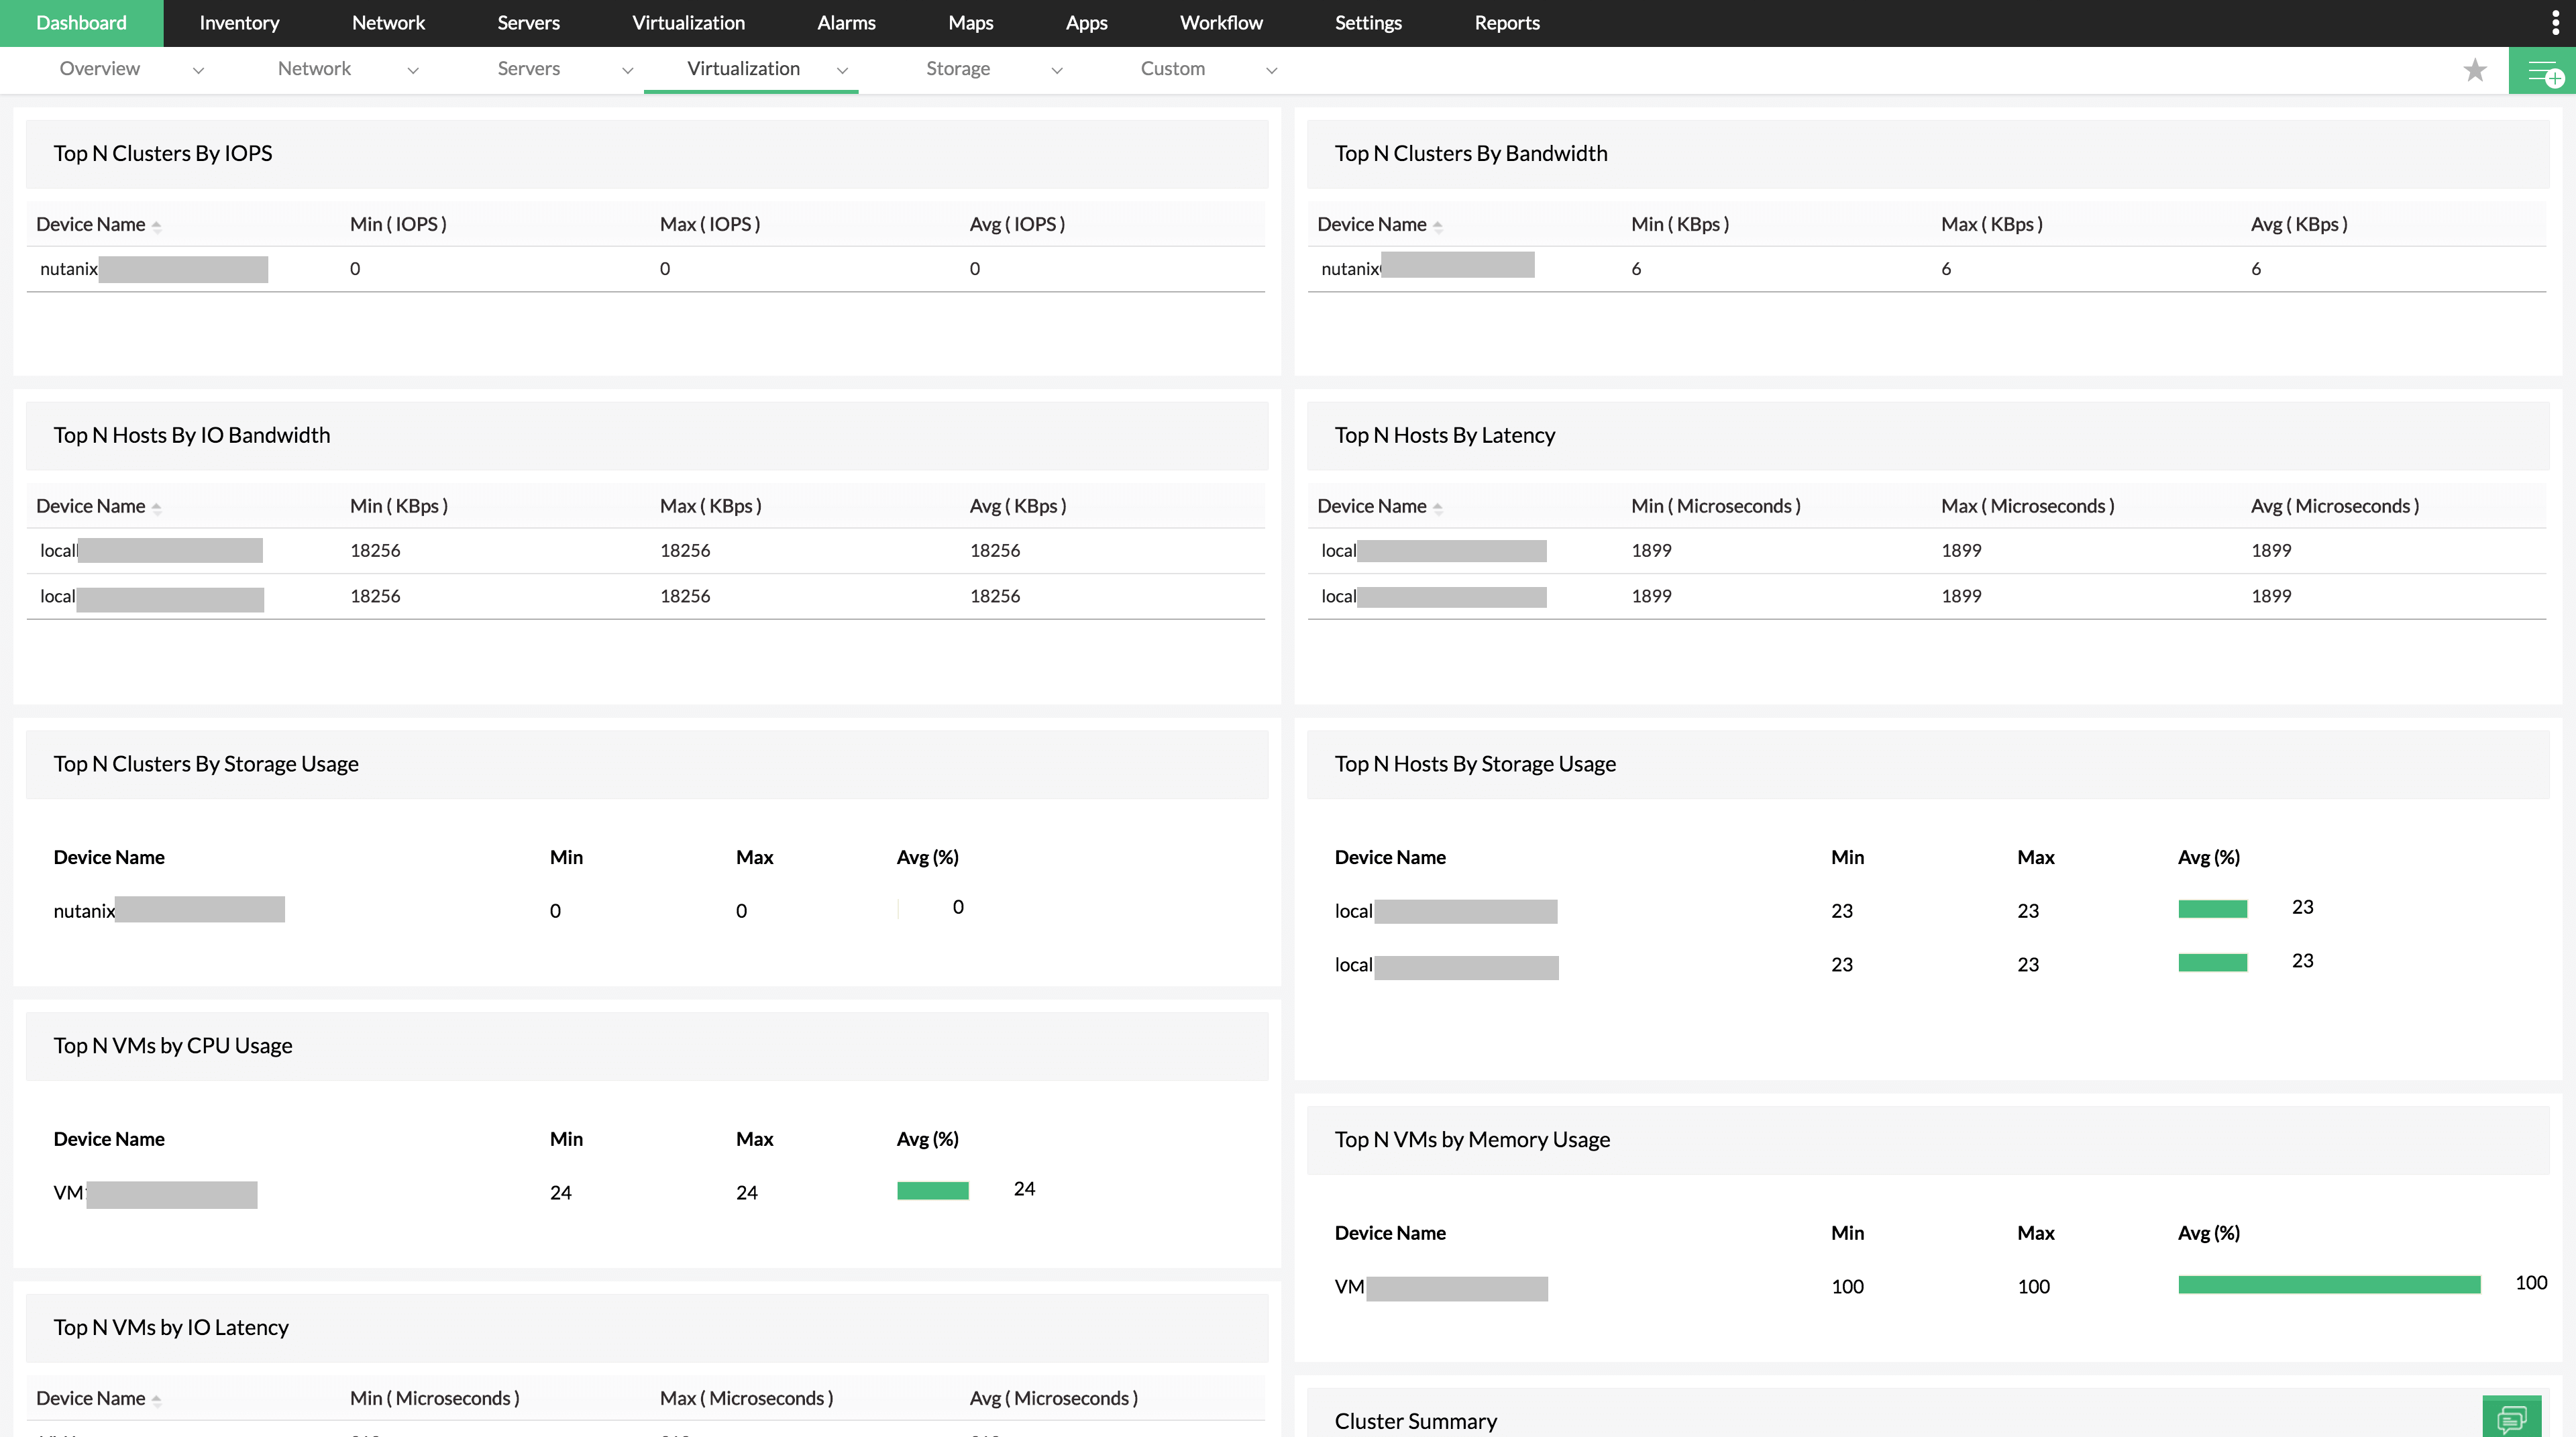
Support for Nutanix (HCI): OpManager also provides support for your Nutanix hyper-converged infrastructure (HCI) by enabling you to monitor the performance and health of all your Nutanix assets using Prism API. Additionally, you can effectively monitor all your Nutanix devices from one screen with a dedicated virtualization monitoring dashboard. In addition to providing device-level information on the top VMs and Hosts, the Nutanix dashboard also provides the top usage stats on a cluster level so you can monitor and manage multiple Nutanix clusters with ease.
When it comes to VM monitoring and management, it's important to take VM sprawl into account. VM sprawl occurs when you cannot effectively manage your VMs anymore due to the sheer number of them in the network. In those cases, the network resources end up being excessively allocated for an unnecessary VM, causing critical VMs to work in an underpowered state and taking a toll on the overall network performance.
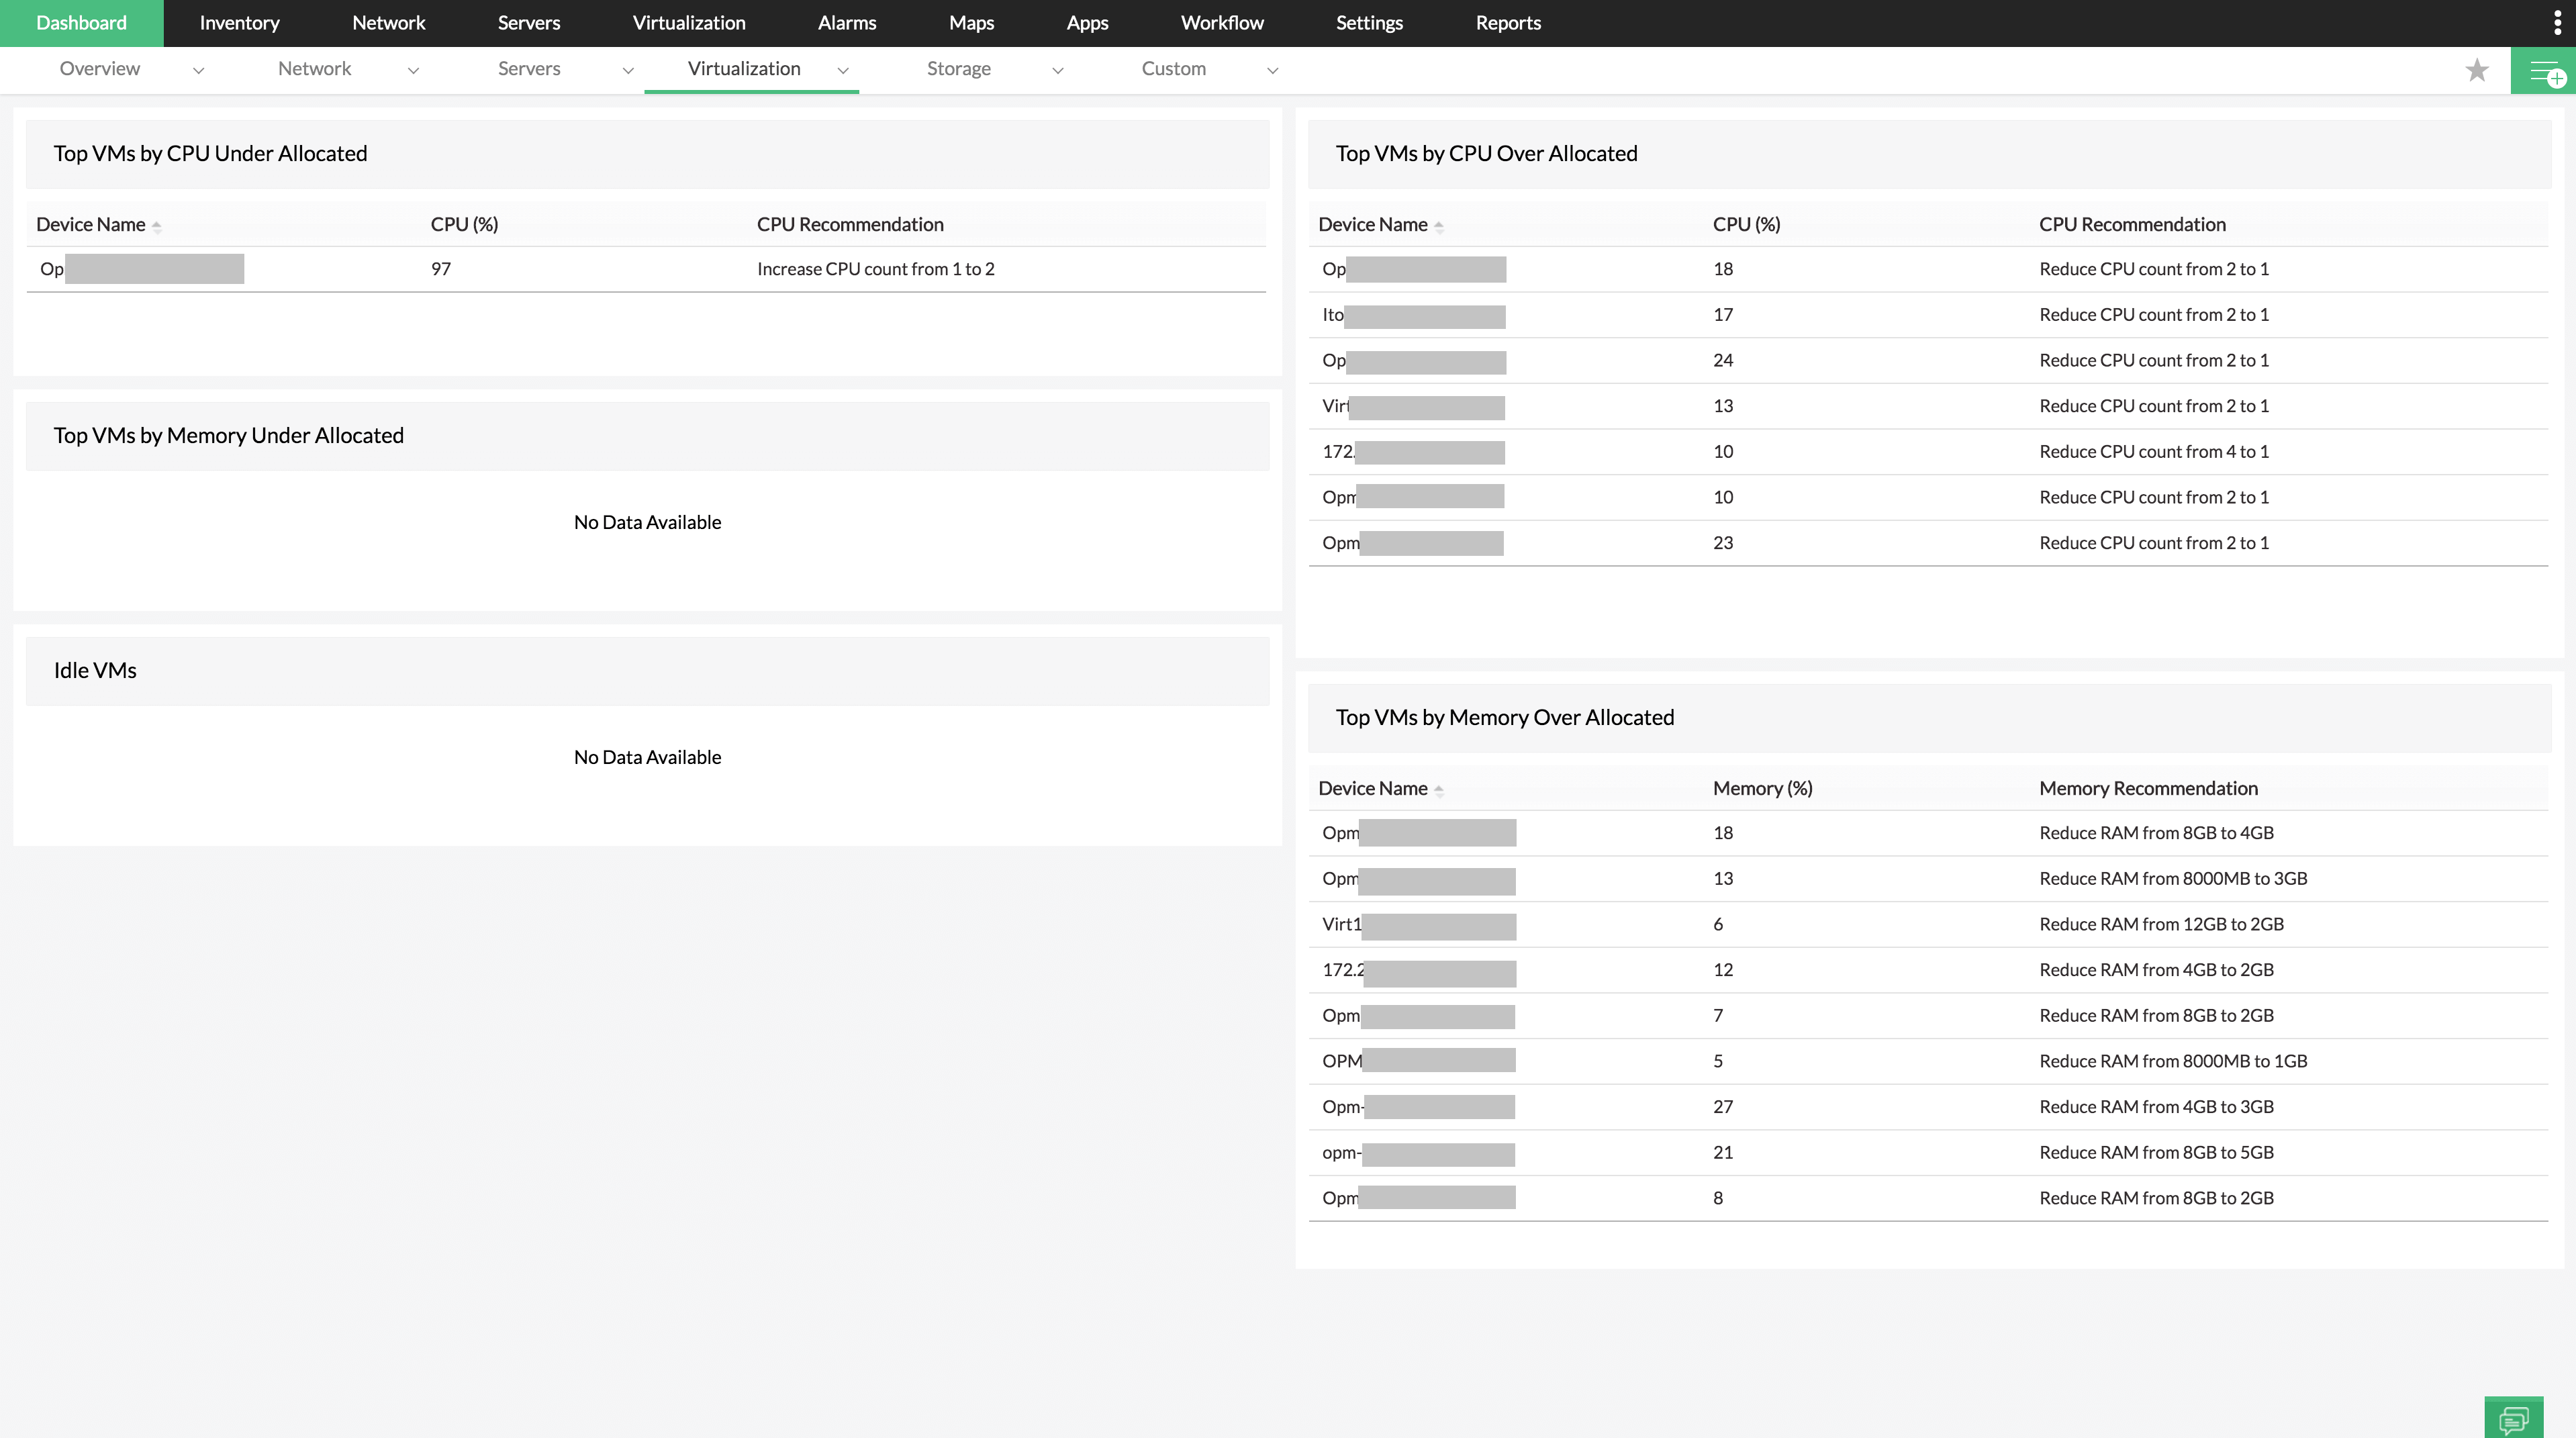
To avoid this situation, OpManager has a default VM sprawl monitoring dashboard, which provides highly useful information on the top resource users in the virtual network. It displays the top VMs with CPU or memory under allocation/overallocation and also displays a recommended action that can be performed on that VM to remediate the sprawl. Also, the Idle VMs widget helps you understand which VMs are idle in your network for longer periods, so you can delete them and reallocate the resources to more critical VMs in the network.
While dashboards are an effective means to get at-a-glance information on your virtual devices, there are situations where you may have to monitor them for days or even weeks. To obtain the latest data, you would have to constantly reload the OpManager web client. This is where network operations center (NOC) views come to the rescue.
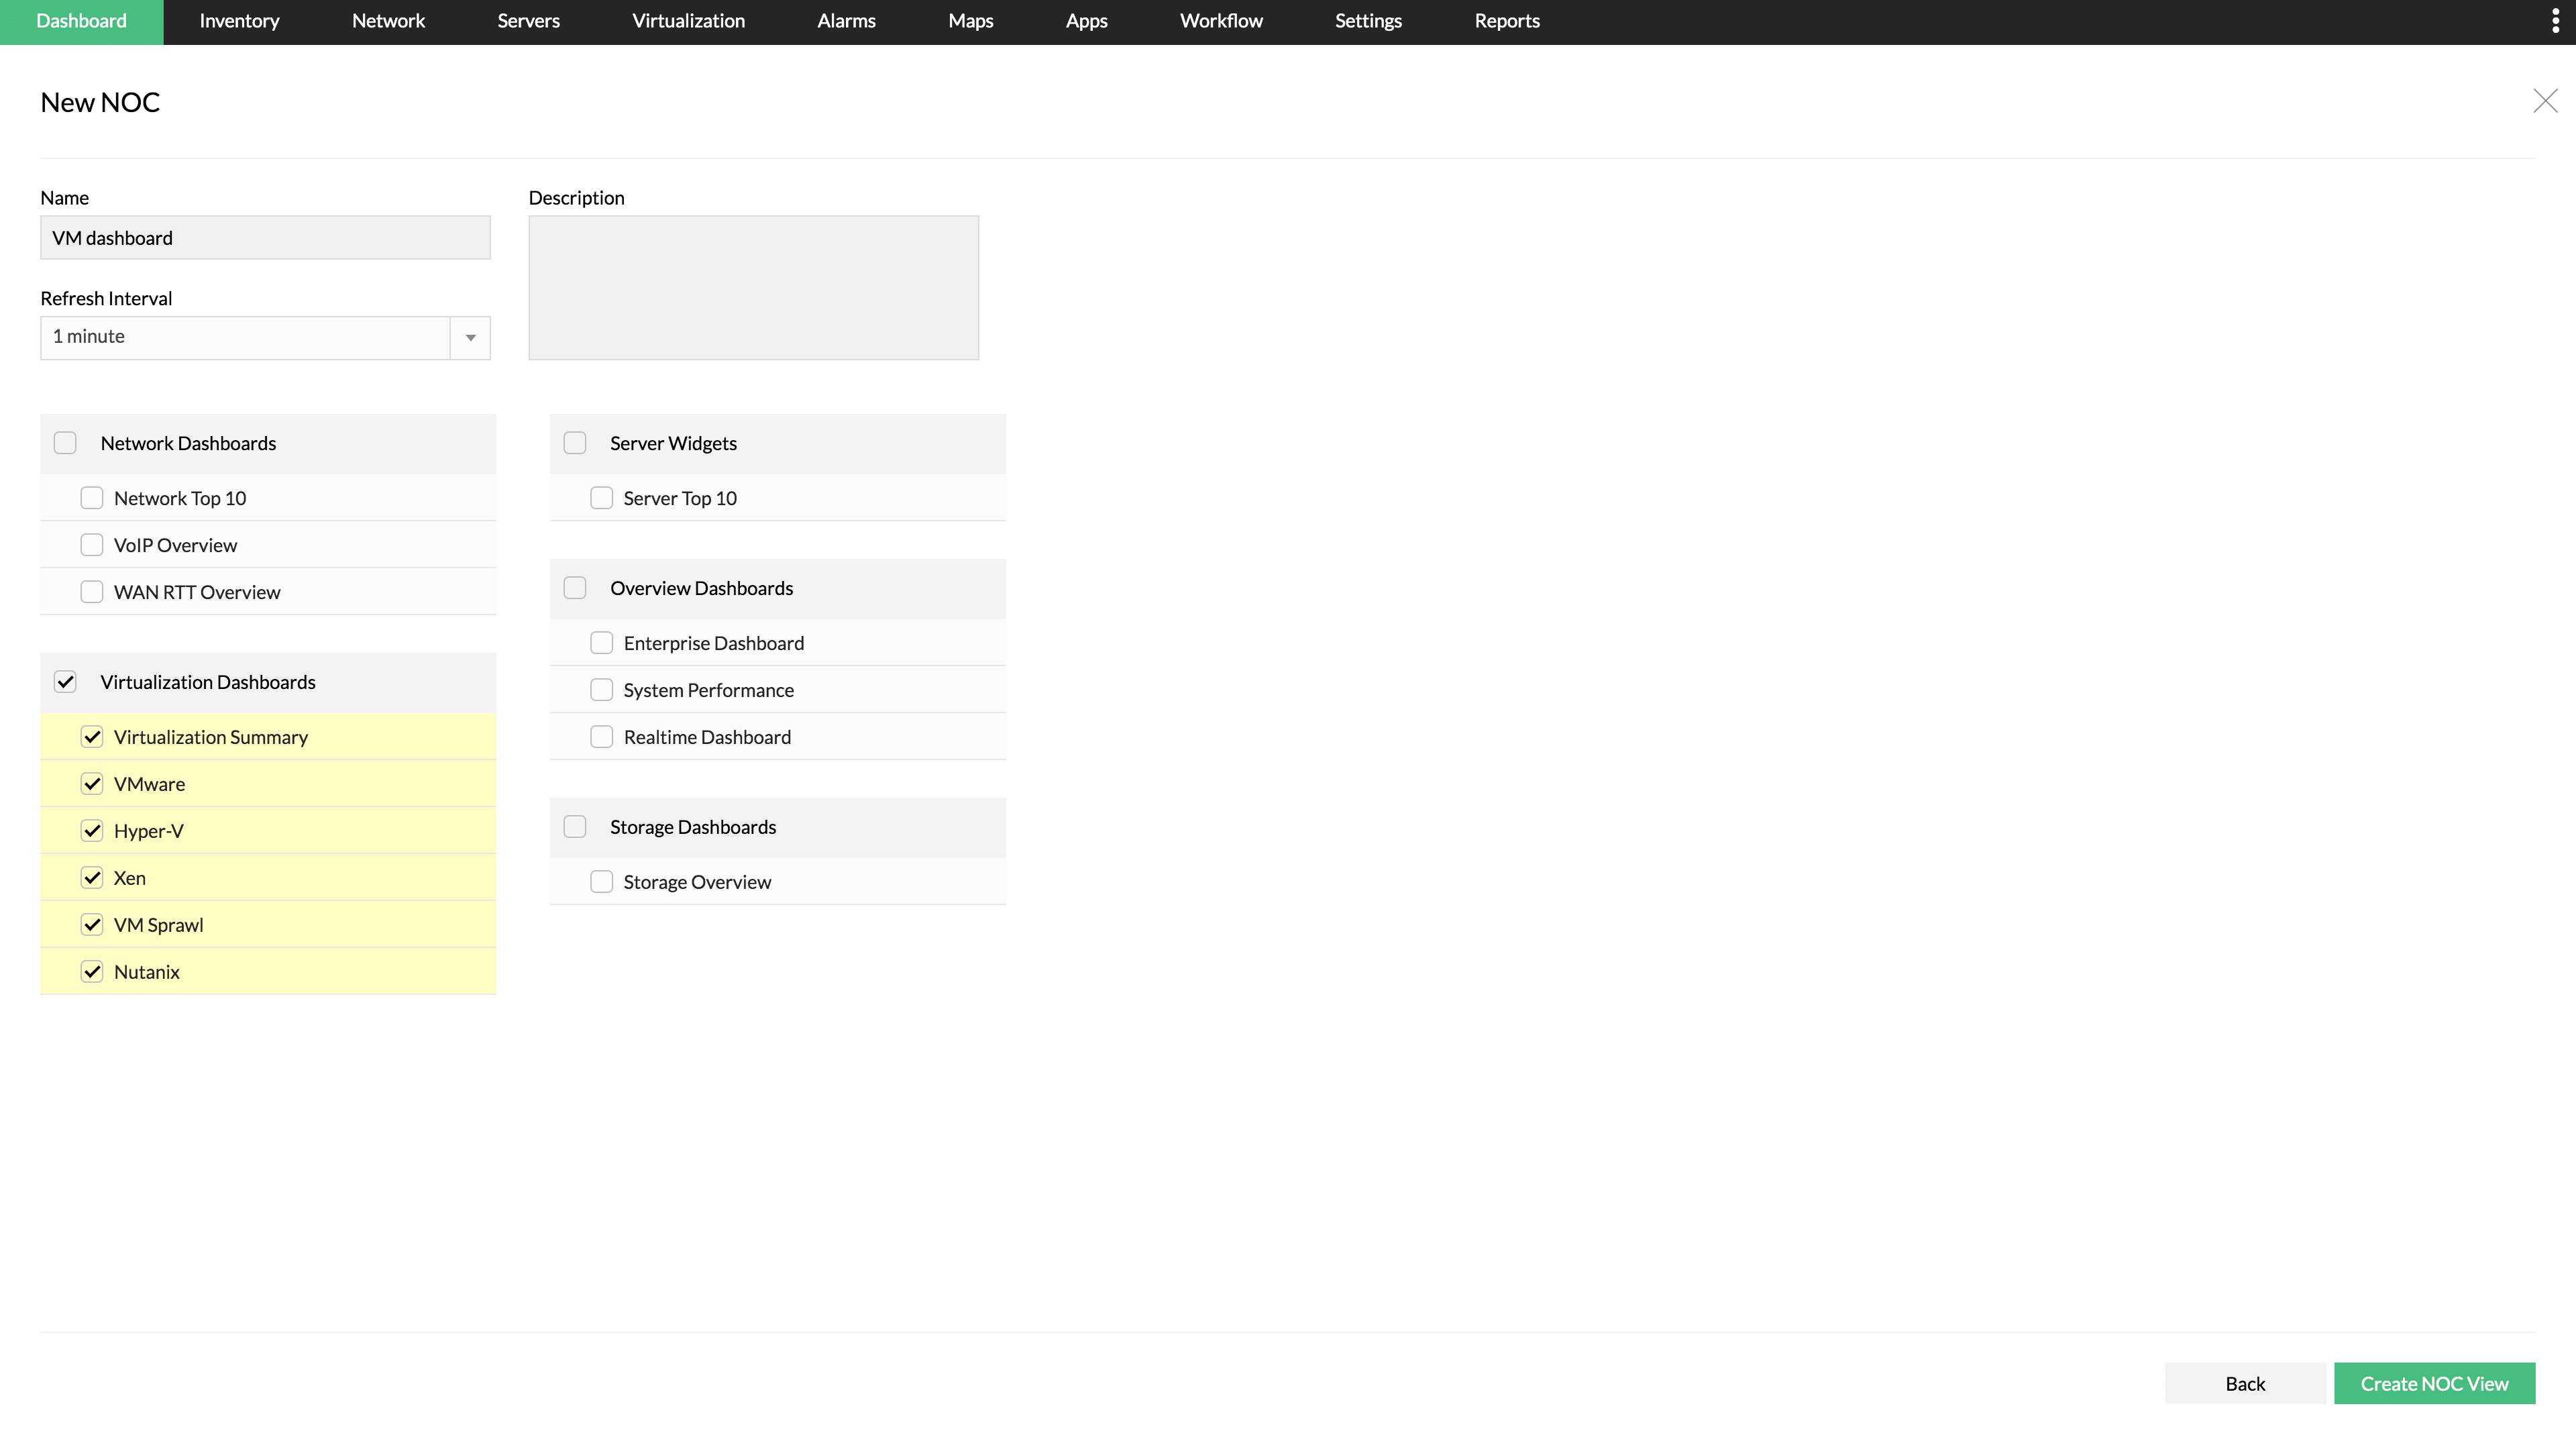
You can easily set up an NOC view using your existing virtual dashboards or even create an NOC view from scratch using all the related widgets available. Once you're done selecting the widgets or dashboards, you can provide a refreshing interval for the dashboard, and OpManager automatically refreshes the page during the set interval, making the latest stats instantly available to you. This is especially handy for enterprises with large virtual networks that have dedicated VM admins to run these views. Learn more about NOC monitoring.
Even with the dashboards, you may find it difficult to monitor the network's status when you're not unrestricted at work, or if you don't have regular access to a computer or the internet. In cases like these, you can choose to view the required data in a single click using OpManager's reports section. What's more, you can schedule the reports to be sent to you daily at a particular time or on particular days so you don't have to worry about losing the time-specific stats of your network devices.
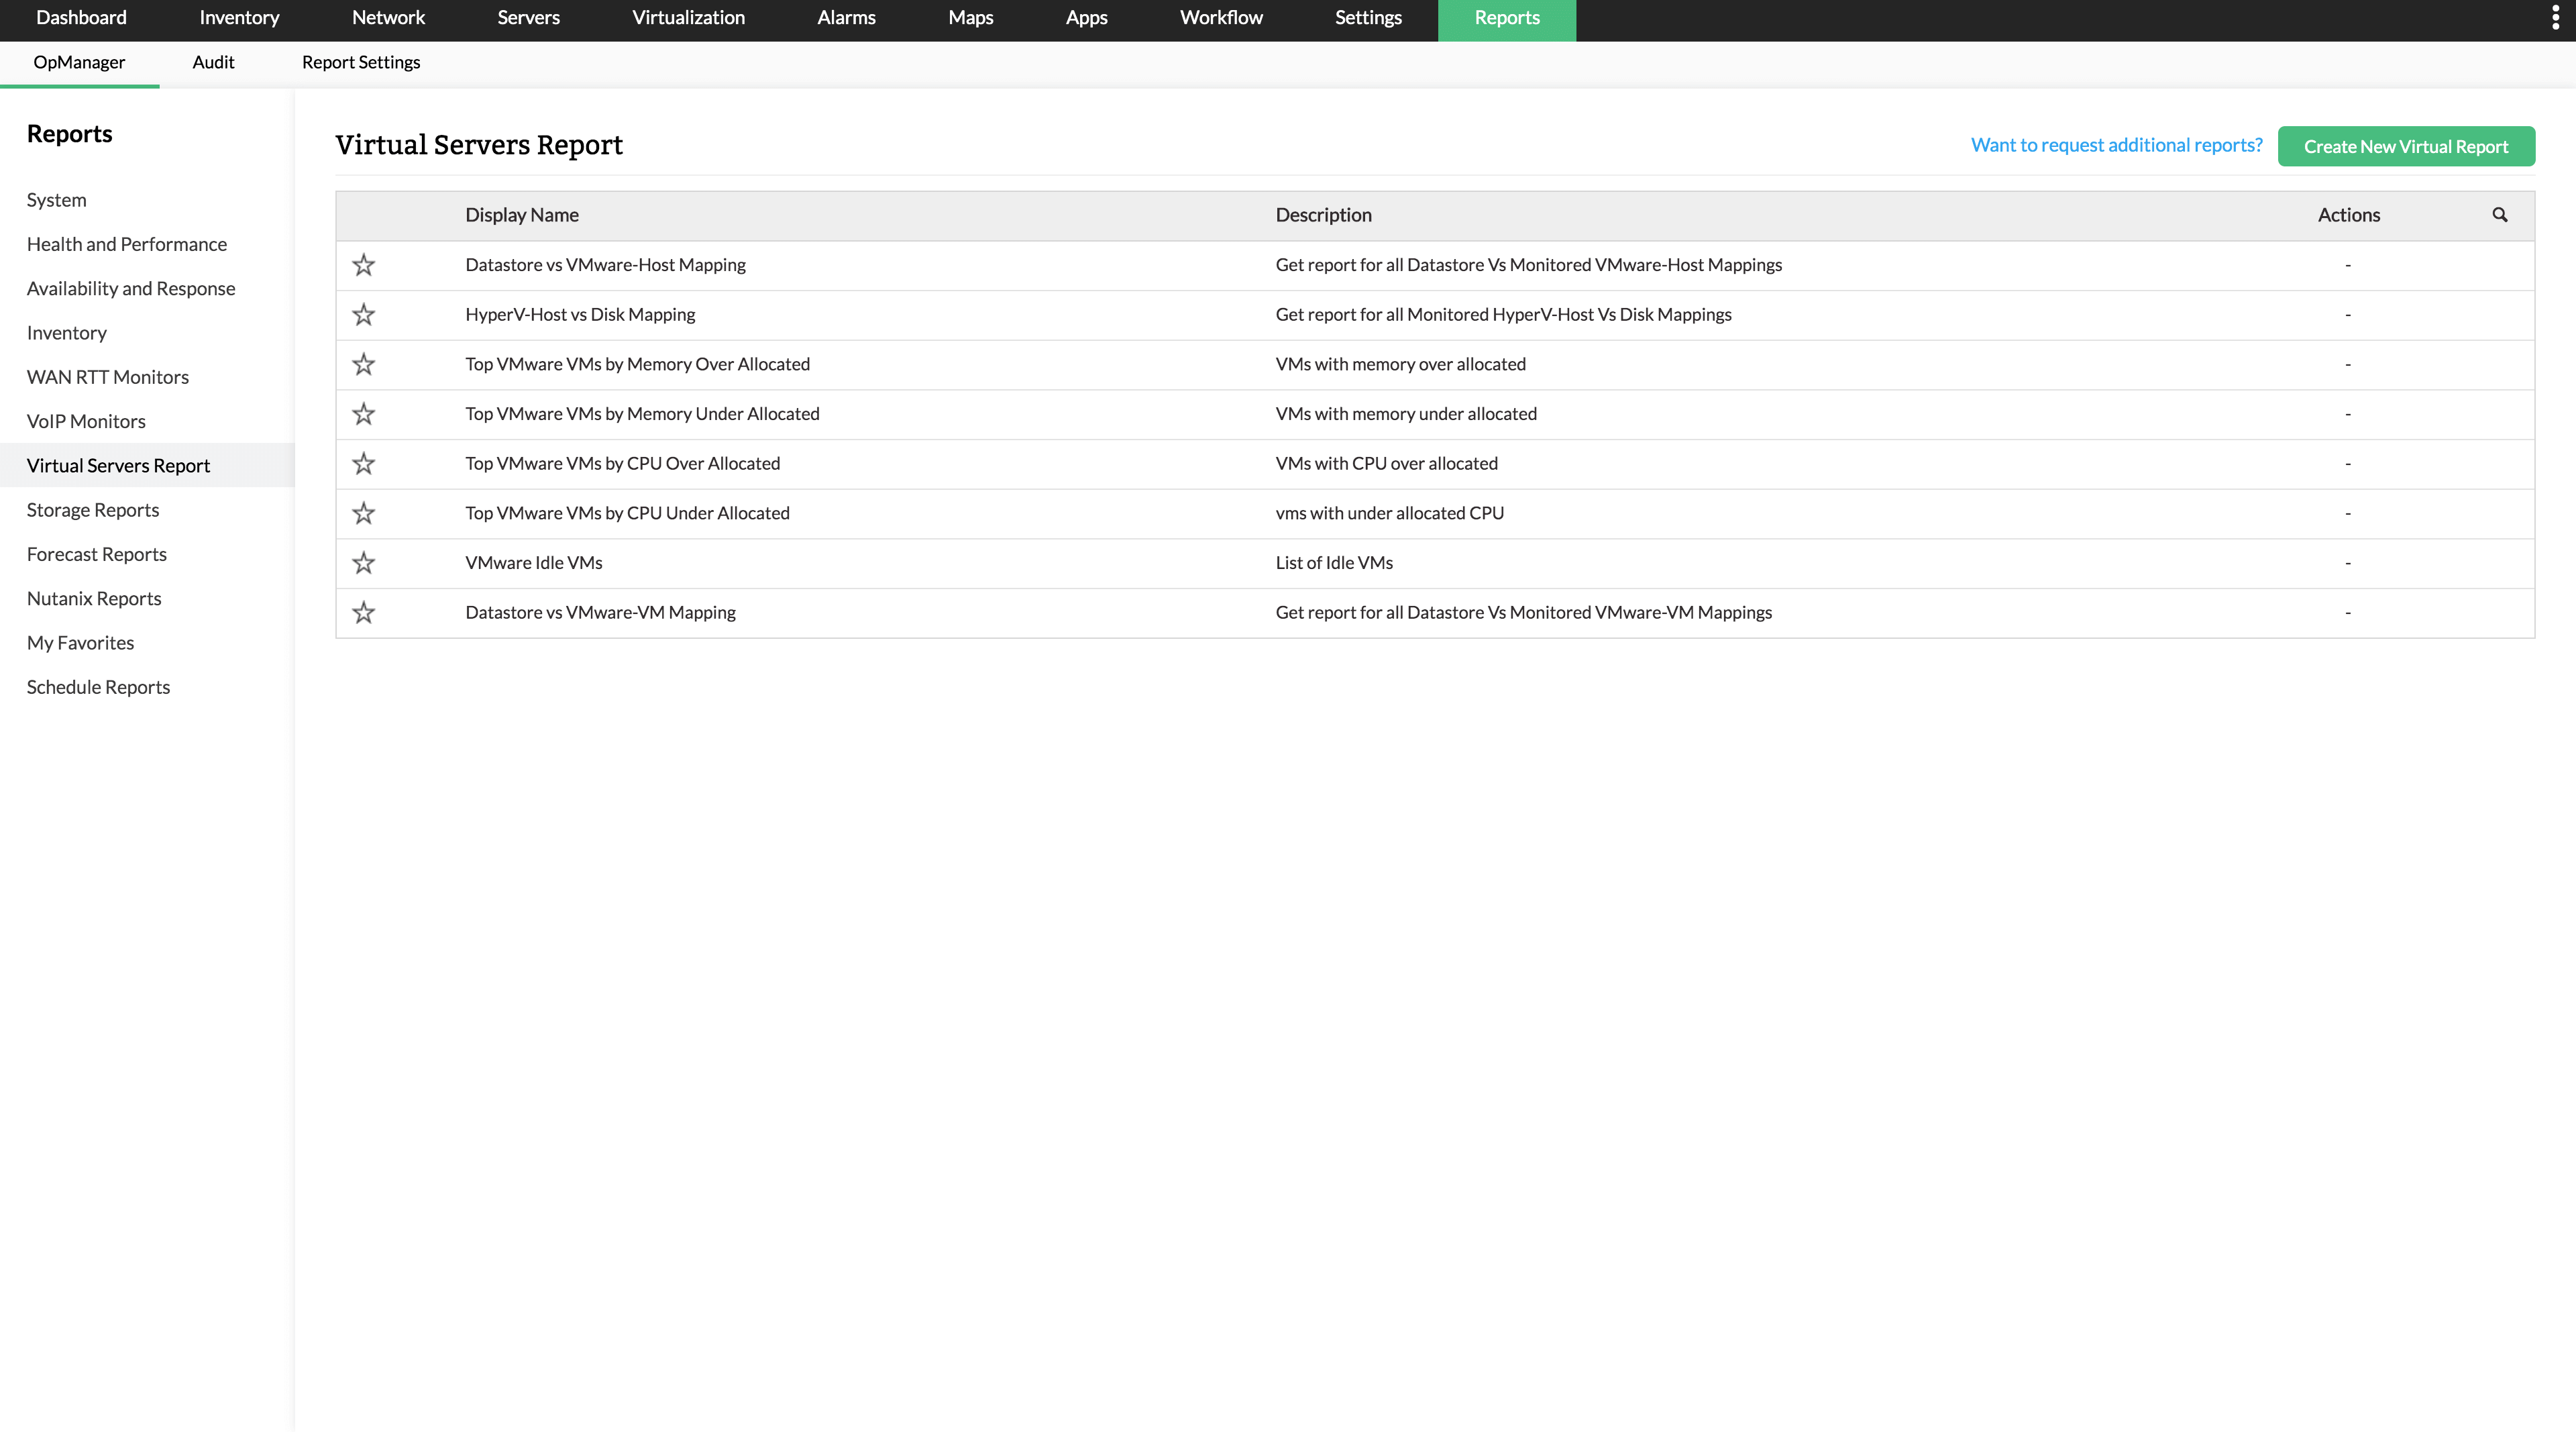
OpManager also has a dedicated Reports section for Nutanix, which can be used in the same way to get all critical info about the health and performance of your Nutanix devices.